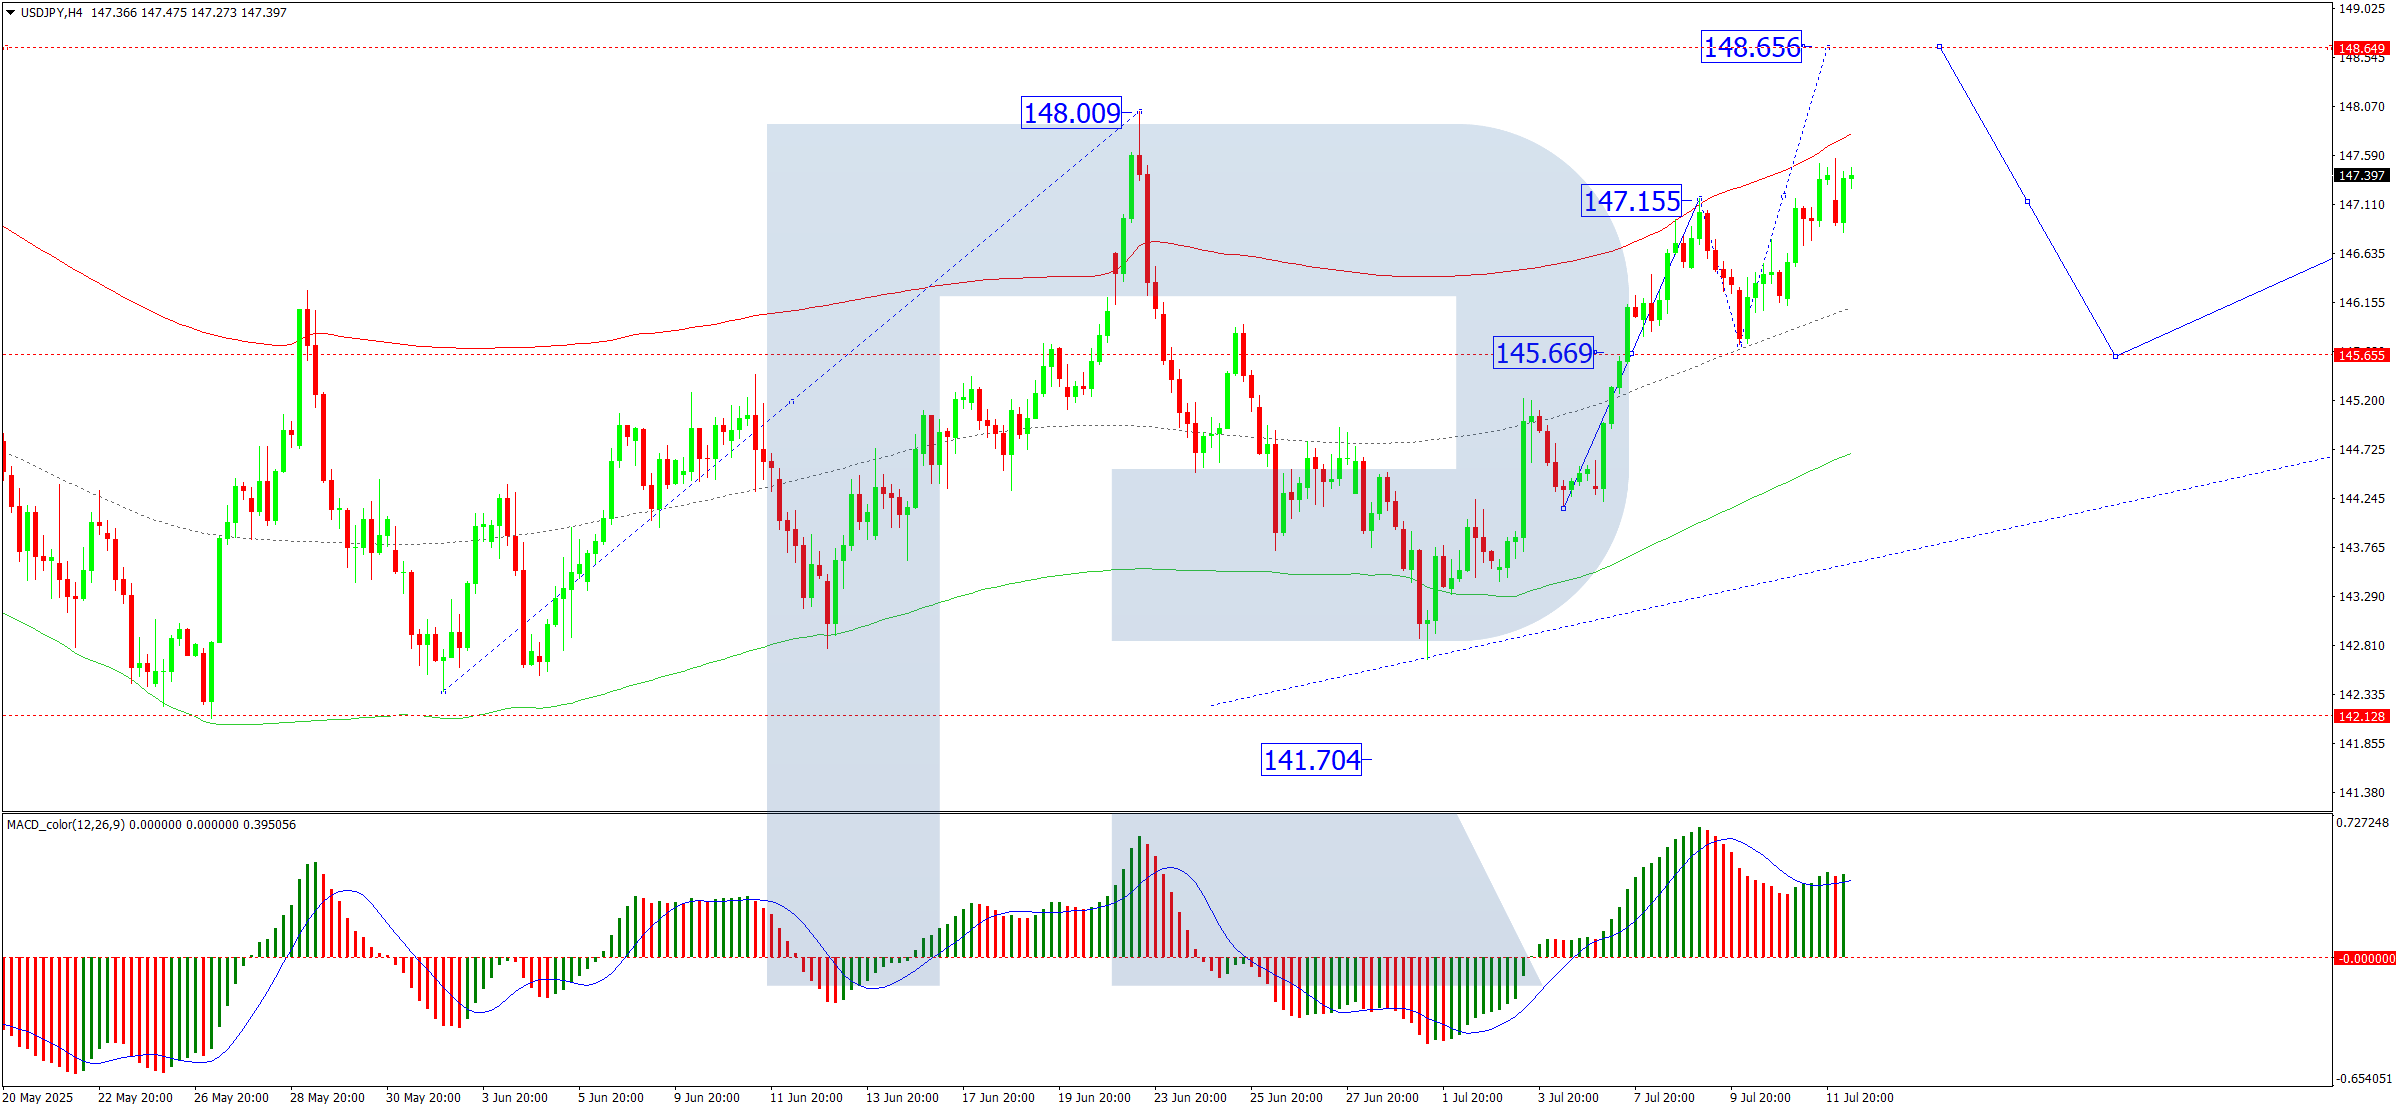
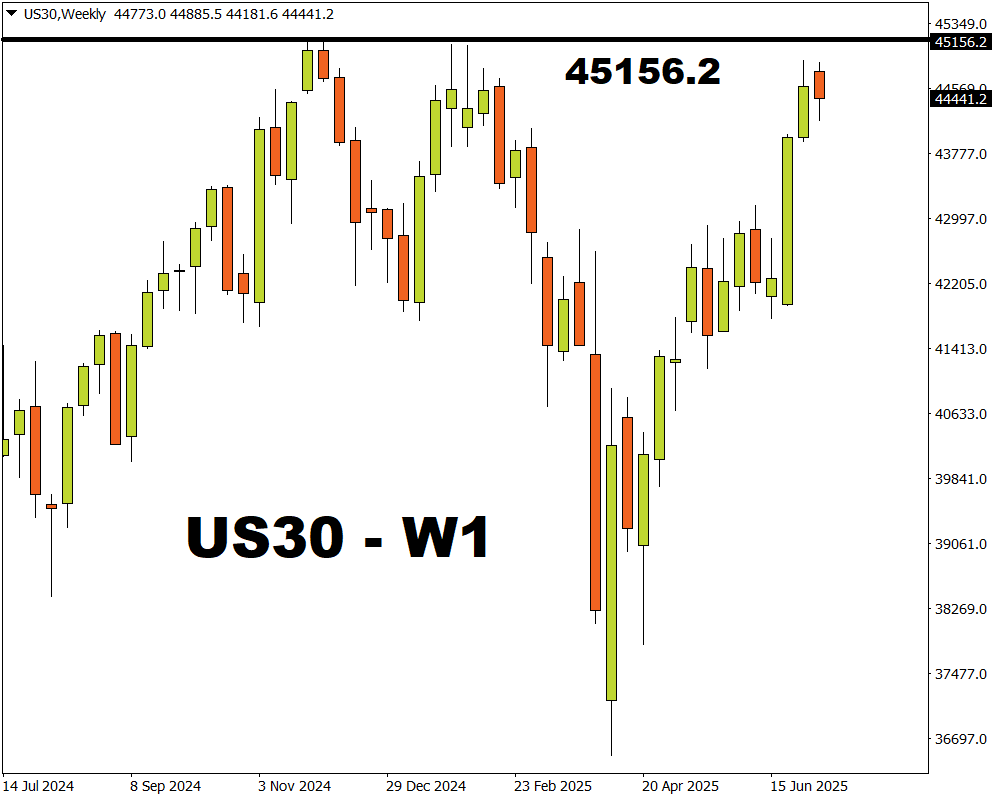
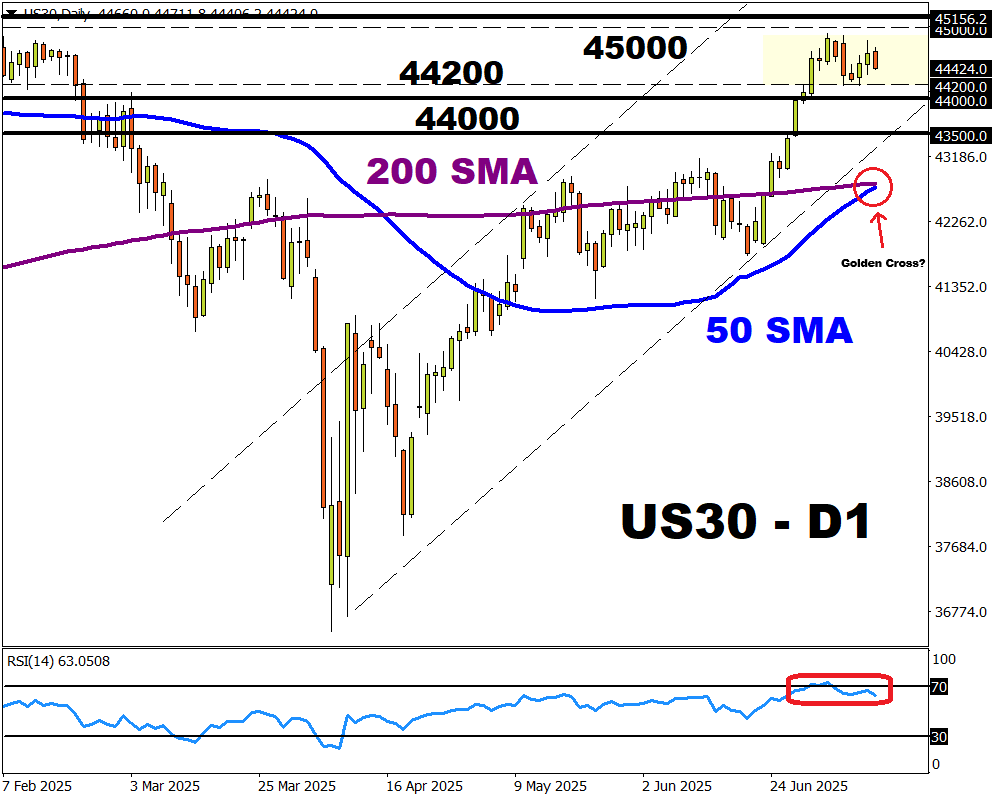
Archive for Financial News – Page 60

Japanese Yen Strengthens as US Dollar Weakens Following Credit Downgrade

By RoboForex Analytical Department

The USD/JPY pair declined for a fifth consecutive day, touching 145.25, as the US dollar faced sustained pressure following Moody’s decision to downgrade the US credit rating.

Key drivers affecting USD/JPY

On Friday, Moody’s cut the US credit rating from Aaa to Aa1, citing a deteriorating fiscal outlook and a lack of “effective measures” to curb the widening budget deficit.

Meanwhile, domestic data revealed that Japan’s economy contracted in Q1 2025, shrinking by 0.2% month-on-month and 0.7% year-on-year, falling short of expectations in both cases. This marks the first economic contraction of the year, driven primarily by a decline in exports.

Investors are now closely monitoring Japan’s trade figures, particularly as the potential impact of new US tariffs looms.

In a recent statement, Prime Minister Shigeru Ishiba stressed that Japan would not accept an unconditional preliminary trade deal, especially concerning automobiles. The country remains wary of a potential 25% US tariff on Japanese car imports. While Japanese diplomats are keen to finalise a trade agreement with the US swiftly, they acknowledge that the outcome is not entirely within their control.

Technical analysis: USD/JPY

On the H4 chart, USD/JPY has corrected to 146.04, with the fifth wave of decline now in motion. The immediate downside target is 143.50, with further downward momentum expected today. Once this target is achieved, a potential rebound towards 146.04 may follow. This scenario is supported by the MACD indicator, where the signal line remains below zero and points firmly downward.

On the H1 chart, the pair consolidated around 146.04 before breaking downward. The current focus is on completing the fifth decline wave towards 143.50. So far, the pair has reached 144.80, followed by a minor correction to 145.30. The next expected move is a further drop to 144.15, with an eventual extension towards 143.50. This outlook is reinforced by the Stochastic oscillator, where the signal line has dipped below 80 and is trending sharply downward towards 20.


Conclusion

The US dollar’s weakness, exacerbated by Moody’s downgrade, continues to drive USD/JPY lower, while Japan’s economic contraction adds further complexity. Traders should monitor trade developments and technical levels for near-term direction.


Disclaimer

Any forecasts contained herein are based on the author’s particular opinion. This analysis may not be treated as trading advice. RoboForex bears no responsibility for trading results based on trading recommendations and reviews contained herein.

COT Metals Charts: Weekly Speculator Bets led lower by Silver & Gold

By InvestMacro

Metals Open Interest COT Chart
Here are the latest charts and statistics for the Commitment of Traders (COT) data published by the Commodities Futures Trading Commission (CFTC).

The latest COT data is updated through Tuesday May 13th and shows a quick view of how large traders (for-profit speculators and commercial entities) were positioned in the futures markets.

Weekly Speculator Changes led lower by Silver & Gold

Metals Net Positions COT Chart
The COT metals markets speculator bets were decisively lower this week as all of the six metals markets we cover had lower speculator contracts.

The markets with declines in speculator bets for the week were Gold (-1,288 contracts), Silver (-1,498 contracts), Steel (-635 contracts), Palladium (-470 contracts), Platinum (-194 contracts) and with Copper (-181 contracts) also registering lower bets on the week.


Metals Data:

Metals Table COT Chart
Legend: Weekly Speculators Change | Speculators Current Net Position | Speculators Strength Score compared to last 3-Years (0-100 range)


Strength Scores led by Steel & Silver

Metals Strength Scores COT Chart

COT Strength Scores (a normalized measure of Speculator positions over a 3-Year range, from 0 to 100 where above 80 is Extreme-Bullish and below 20 is Extreme-Bearish) showed that Steel (77 percent) and Silver (76 percent) lead the metals markets this week.

On the downside, Palladium (26 percent) and Platinum (38 percent) come in at the lowest strength level currently.

Strength Statistics:
Gold (41.4 percent) vs Gold previous week (41.9 percent)
Silver (76.5 percent) vs Silver previous week (78.4 percent)
Copper (53.3 percent) vs Copper previous week (53.5 percent)
Platinum (38.0 percent) vs Platinum previous week (38.4 percent)
Palladium (25.9 percent) vs Palladium previous week (29.5 percent)
Steel (77.3 percent) vs Palladium previous week (80.2 percent)


Copper & Steel top the 6-Week Strength Trends

Metals Trends COT Chart

COT Strength Score Trends (or move index, calculates the 6-week changes in strength scores) showed that all of the metals markets currently have negative trend scores. Copper (-8 percent) and Steel (-9 percent) have the least negative scores while Gold (-29 percent) and Palladium (-20 percent) have the most negative scores.

Move Statistics:
Gold (-29.3 percent) vs Gold previous week (-33.2 percent)
Silver (-12.0 percent) vs Silver previous week (-14.8 percent)
Copper (-7.9 percent) vs Copper previous week (-11.5 percent)
Platinum (-13.4 percent) vs Platinum previous week (-9.6 percent)
Palladium (-19.5 percent) vs Palladium previous week (-12.6 percent)
Steel (-8.6 percent) vs Steel previous week (-13.7 percent)


Individual Markets:

Gold Comex Futures:

Gold Futures COT ChartThe Gold Comex Futures large speculator standing this week equaled a net position of 161,209 contracts in the data reported through Tuesday. This was a weekly reduction of -1,288 contracts from the previous week which had a total of 162,497 net contracts.

This week’s current strength score (the trader positioning range over the past three years, measured from 0 to 100) shows the speculators are currently Bearish with a score of 41.4 percent. The commercials are Bullish with a score of 53.5 percent and the small traders (not shown in chart) are Bullish-Extreme with a score of 92.6 percent.

Price Trend-Following Model: Uptrend

Our weekly trend-following model classifies the current market price position as: Uptrend.

Gold Futures StatisticsSPECULATORSCOMMERCIALSSMALL TRADERS
– Percent of Open Interest Longs:54.020.111.7
– Percent of Open Interest Shorts:17.563.44.9
– Net Position:161,209-191,20729,998
– Gross Longs:238,19188,41251,570
– Gross Shorts:76,982279,61921,572
– Long to Short Ratio:3.1 to 10.3 to 12.4 to 1
NET POSITION TREND:
– Strength Index Score (3 Year Range Pct):41.453.592.6
– Strength Index Reading (3 Year Range):BearishBullishBullish-Extreme
NET POSITION MOVEMENT INDEX:
– 6-Week Change in Strength Index:-29.326.614.2


Silver Comex Futures:

Silver Futures COT ChartThe Silver Comex Futures large speculator standing this week equaled a net position of 47,754 contracts in the data reported through Tuesday. This was a weekly fall of -1,498 contracts from the previous week which had a total of 49,252 net contracts.

This week’s current strength score (the trader positioning range over the past three years, measured from 0 to 100) shows the speculators are currently Bullish with a score of 76.5 percent. The commercials are Bearish with a score of 21.2 percent and the small traders (not shown in chart) are Bullish with a score of 59.8 percent.

Price Trend-Following Model: Uptrend

Our weekly trend-following model classifies the current market price position as: Uptrend.

Silver Futures StatisticsSPECULATORSCOMMERCIALSSMALL TRADERS
– Percent of Open Interest Longs:49.124.019.9
– Percent of Open Interest Shorts:14.671.96.6
– Net Position:47,754-66,18018,426
– Gross Longs:67,94433,16427,520
– Gross Shorts:20,19099,3449,094
– Long to Short Ratio:3.4 to 10.3 to 13.0 to 1
NET POSITION TREND:
– Strength Index Score (3 Year Range Pct):76.521.259.8
– Strength Index Reading (3 Year Range):BullishBearishBullish
NET POSITION MOVEMENT INDEX:
– 6-Week Change in Strength Index:-12.011.3-3.5


Copper Grade #1 Futures:

Copper Futures COT ChartThe Copper Grade #1 Futures large speculator standing this week equaled a net position of 21,522 contracts in the data reported through Tuesday. This was a weekly decrease of -181 contracts from the previous week which had a total of 21,703 net contracts.

This week’s current strength score (the trader positioning range over the past three years, measured from 0 to 100) shows the speculators are currently Bullish with a score of 53.3 percent. The commercials are Bearish with a score of 49.5 percent and the small traders (not shown in chart) are Bearish with a score of 34.8 percent.

Price Trend-Following Model: Weak Uptrend

Our weekly trend-following model classifies the current market price position as: Weak Uptrend.

Copper Futures StatisticsSPECULATORSCOMMERCIALSSMALL TRADERS
– Percent of Open Interest Longs:36.731.07.3
– Percent of Open Interest Shorts:25.743.55.9
– Net Position:21,522-24,3432,821
– Gross Longs:71,92660,80514,368
– Gross Shorts:50,40485,14811,547
– Long to Short Ratio:1.4 to 10.7 to 11.2 to 1
NET POSITION TREND:
– Strength Index Score (3 Year Range Pct):53.349.534.8
– Strength Index Reading (3 Year Range):BullishBearishBearish
NET POSITION MOVEMENT INDEX:
– 6-Week Change in Strength Index:-7.95.810.5


Platinum Futures:

Platinum Futures COT ChartThe Platinum Futures large speculator standing this week equaled a net position of 9,316 contracts in the data reported through Tuesday. This was a weekly reduction of -194 contracts from the previous week which had a total of 9,510 net contracts.

This week’s current strength score (the trader positioning range over the past three years, measured from 0 to 100) shows the speculators are currently Bearish with a score of 38.0 percent. The commercials are Bullish with a score of 62.7 percent and the small traders (not shown in chart) are Bearish with a score of 27.8 percent.

Price Trend-Following Model: Strong Uptrend

Our weekly trend-following model classifies the current market price position as: Strong Uptrend.

Platinum Futures StatisticsSPECULATORSCOMMERCIALSSMALL TRADERS
– Percent of Open Interest Longs:56.624.511.3
– Percent of Open Interest Shorts:44.342.25.8
– Net Position:9,316-13,4694,153
– Gross Longs:42,96818,6038,566
– Gross Shorts:33,65232,0724,413
– Long to Short Ratio:1.3 to 10.6 to 11.9 to 1
NET POSITION TREND:
– Strength Index Score (3 Year Range Pct):38.062.727.8
– Strength Index Reading (3 Year Range):BearishBullishBearish
NET POSITION MOVEMENT INDEX:
– 6-Week Change in Strength Index:-13.413.4-4.8


Palladium Futures:

Palladium Futures COT ChartThe Palladium Futures large speculator standing this week equaled a net position of -10,461 contracts in the data reported through Tuesday. This was a weekly reduction of -470 contracts from the previous week which had a total of -9,991 net contracts.

This week’s current strength score (the trader positioning range over the past three years, measured from 0 to 100) shows the speculators are currently Bearish with a score of 25.9 percent. The commercials are Bullish with a score of 71.0 percent and the small traders (not shown in chart) are Bullish with a score of 67.8 percent.

Price Trend-Following Model: Weak Downtrend

Our weekly trend-following model classifies the current market price position as: Weak Downtrend.

Palladium Futures StatisticsSPECULATORSCOMMERCIALSSMALL TRADERS
– Percent of Open Interest Longs:26.950.911.1
– Percent of Open Interest Shorts:76.65.07.3
– Net Position:-10,4619,659802
– Gross Longs:5,66110,7152,345
– Gross Shorts:16,1221,0561,543
– Long to Short Ratio:0.4 to 110.1 to 11.5 to 1
NET POSITION TREND:
– Strength Index Score (3 Year Range Pct):25.971.067.8
– Strength Index Reading (3 Year Range):BearishBullishBullish
NET POSITION MOVEMENT INDEX:
– 6-Week Change in Strength Index:-19.520.0-1.2


Steel Futures Futures:

Steel Futures COT ChartThe Steel Futures large speculator standing this week equaled a net position of 171 contracts in the data reported through Tuesday. This was a weekly lowering of -635 contracts from the previous week which had a total of 806 net contracts.

This week’s current strength score (the trader positioning range over the past three years, measured from 0 to 100) shows the speculators are currently Bullish with a score of 77.3 percent. The commercials are Bearish with a score of 24.2 percent and the small traders (not shown in chart) are Bearish with a score of 30.9 percent.

Price Trend-Following Model: Uptrend

Our weekly trend-following model classifies the current market price position as: Uptrend.

Steel Futures StatisticsSPECULATORSCOMMERCIALSSMALL TRADERS
– Percent of Open Interest Longs:29.765.00.6
– Percent of Open Interest Shorts:29.265.40.7
– Net Position:171-157-14
– Gross Longs:10,44022,868218
– Gross Shorts:10,26923,025232
– Long to Short Ratio:1.0 to 11.0 to 10.9 to 1
NET POSITION TREND:
– Strength Index Score (3 Year Range Pct):77.324.230.9
– Strength Index Reading (3 Year Range):BullishBearishBearish
NET POSITION MOVEMENT INDEX:
– 6-Week Change in Strength Index:-8.69.0-8.1


Article By InvestMacroReceive our weekly COT Newsletter

*COT Report: The COT data, released weekly to the public each Friday, is updated through the most recent Tuesday (data is 3 days old) and shows a quick view of how large speculators or non-commercials (for-profit traders) were positioned in the futures markets.

The CFTC categorizes trader positions according to commercial hedgers (traders who use futures contracts for hedging as part of the business), non-commercials (large traders who speculate to realize trading profits) and nonreportable traders (usually small traders/speculators) as well as their open interest (contracts open in the market at time of reporting). See CFTC criteria here.

COT Bonds Charts: Weekly Speculator Bets led by 5-Year & 10-Year Bonds

By InvestMacro

Bonds Market Open Interest Comparison
Here are the latest charts and statistics for the Commitment of Traders (COT) reports data published by the Commodities Futures Trading Commission (CFTC).

The latest COT data is updated through Tuesday May 13th and shows a quick view of how large traders (for-profit speculators and commercial hedgers) were positioned in the futures markets.

Weekly Speculator Changes led by 5-Year & 10-Year Bonds

Bonds Market Net Speculators Positions
The COT bond market speculator bets were overall higher this week as six out of the nine bond markets we cover had higher positioning while the other three markets had lower speculator contracts.

Leading the gains for the bond markets was the 5-Year Bonds (116,453 contracts) with the 10-Year Bonds (62,817 contracts), the Fed Funds (36,496 contracts), the US Treasury Bonds (18,160 contracts), the Ultra Treasury Bonds (3,553 contracts) and the SOFR 1-Month (3,019 contracts) also showing positive weeks.

The bond markets with declines in speculator bets for the week were the Ultra 10-Year Bonds (-35,910 contracts), the SOFR 3-Months (-6,465 contracts) and with the 2-Year Bonds (-1,439 contracts) also seeing lower bets on the week.


Bonds Data:

Bonds Market Speculators Data Table
Legend: Open Interest | Speculators Current Net Position | Weekly Specs Change | Specs Strength Score compared to last 3-Years (0-100 range)


Strength Scores led by Ultra Treasury Bonds & SOFR 1-Month

Bonds Market Strength Index Comparison
COT Strength Scores (a normalized measure of Speculator positions over a 3-Year range, from 0 to 100 where above 80 is Extreme-Bullish and below 20 is Extreme-Bearish) showed that the Ultra Treasury Bonds (75 percent) and the SOFR 1-Month (67 percent) lead the bond markets this week. The US Treasury Bonds (56 percent) comes in as the next highest in the weekly strength scores.

On the downside, the Ultra 10-Year Bond (0 percent), the 5-Year Bonds (5 percent) and the 2-Year Bonds (18 percent) come in at the lowest strength level currently and are in Extreme-Bearish territory (below 20 percent). The next lowest strength scores were the SOFR 3-Months (22 percent) and the 10-Year Bonds (24 percent).

Strength Statistics:
Fed Funds (39.9 percent) vs Fed Funds previous week (33.2 percent)
2-Year Bond (18.2 percent) vs 2-Year Bond previous week (18.3 percent)
5-Year Bond (5.3 percent) vs 5-Year Bond previous week (0.0 percent)
10-Year Bond (24.5 percent) vs 10-Year Bond previous week (18.4 percent)
Ultra 10-Year Bond (0.0 percent) vs Ultra 10-Year Bond previous week (11.5 percent)
US Treasury Bond (56.4 percent) vs US Treasury Bond previous week (50.0 percent)
Ultra US Treasury Bond (74.6 percent) vs Ultra US Treasury Bond previous week (73.2 percent)
SOFR 1-Month (67.2 percent) vs SOFR 1-Month previous week (66.5 percent)
SOFR 3-Months (21.8 percent) vs SOFR 3-Months previous week (22.1 percent)


Fed Funds & SOFR 1-Month top the 6-Week Strength Trends

Bonds Market Trend Index Comparison
COT Strength Score Trends (or move index, calculates the 6-week changes in strength scores) showed that the Fed Funds (13 percent) and the SOFR 1-Month (9 percent) lead the past six weeks trends for bonds.

The Ultra 10-Year Bond (-68 percent), the US Treasury Bonds (-16 percent) and the 5-Year Bonds (-7 percent) leads the downside trend scores currently.

Strength Trend Statistics:
Fed Funds (13.0 percent) vs Fed Funds previous week (-0.4 percent)
2-Year Bond (0.3 percent) vs 2-Year Bond previous week (-2.7 percent)
5-Year Bond (-7.2 percent) vs 5-Year Bond previous week (-18.1 percent)
10-Year Bond (-2.6 percent) vs 10-Year Bond previous week (-13.8 percent)
Ultra 10-Year Bond (-68.3 percent) vs Ultra 10-Year Bond previous week (-63.7 percent)
US Treasury Bond (-15.6 percent) vs US Treasury Bond previous week (-20.0 percent)
Ultra US Treasury Bond (-2.7 percent) vs Ultra US Treasury Bond previous week (-12.4 percent)
SOFR 1-Month (8.7 percent) vs SOFR 1-Month previous week (11.0 percent)
SOFR 3-Months (5.5 percent) vs SOFR 3-Months previous week (1.1 percent)


30-Day Federal Funds Futures:

Federal Funds 30-Day Bonds Futures COT ChartThe 30-Day Federal Funds large speculator standing this week resulted in a net position of -79,469 contracts in the data reported through Tuesday. This was a weekly lift of 36,496 contracts from the previous week which had a total of -115,965 net contracts.

This week’s current strength score (the trader positioning range over the past three years, measured from 0 to 100) shows the speculators are currently Bearish with a score of 39.9 percent. The commercials are Bullish with a score of 55.7 percent and the small traders (not shown in chart) are Bullish with a score of 68.0 percent.

Price Trend-Following Model: Downtrend

Our weekly trend-following model classifies the current market price position as: Downtrend.

30-Day Federal Funds StatisticsSPECULATORSCOMMERCIALSSMALL TRADERS
– Percent of Open Interest Longs:18.066.83.0
– Percent of Open Interest Shorts:21.963.12.8
– Net Position:-79,46974,8674,602
– Gross Longs:365,2901,354,08560,600
– Gross Shorts:444,7591,279,21855,998
– Long to Short Ratio:0.8 to 11.1 to 11.1 to 1
NET POSITION TREND:
– Strength Index Score (3 Year Range Pct):39.955.768.0
– Strength Index Reading (3 Year Range):BearishBullishBullish
NET POSITION MOVEMENT INDEX:
– 6-Week Change in Strength Index:13.0-10.4-17.2


Secured Overnight Financing Rate (3-Month) Futures:

SOFR 3-Months Bonds Futures COT ChartThe Secured Overnight Financing Rate (3-Month) large speculator standing this week resulted in a net position of -744,868 contracts in the data reported through Tuesday. This was a weekly reduction of -6,465 contracts from the previous week which had a total of -738,403 net contracts.

This week’s current strength score (the trader positioning range over the past three years, measured from 0 to 100) shows the speculators are currently Bearish with a score of 21.8 percent. The commercials are Bullish with a score of 78.3 percent and the small traders (not shown in chart) are Bullish-Extreme with a score of 81.5 percent.

Price Trend-Following Model: Weak Uptrend

Our weekly trend-following model classifies the current market price position as: Weak Uptrend.

SOFR 3-Months StatisticsSPECULATORSCOMMERCIALSSMALL TRADERS
– Percent of Open Interest Longs:11.760.60.9
– Percent of Open Interest Shorts:18.553.70.9
– Net Position:-744,868749,170-4,302
– Gross Longs:1,274,5386,601,97195,390
– Gross Shorts:2,019,4065,852,80199,692
– Long to Short Ratio:0.6 to 11.1 to 11.0 to 1
NET POSITION TREND:
– Strength Index Score (3 Year Range Pct):21.878.381.5
– Strength Index Reading (3 Year Range):BearishBullishBullish-Extreme
NET POSITION MOVEMENT INDEX:
– 6-Week Change in Strength Index:5.5-5.1-3.9


Individual Bond Markets:

Secured Overnight Financing Rate (1-Month) Futures:

SOFR 1-Month Bonds Futures COT ChartThe Secured Overnight Financing Rate (1-Month) large speculator standing this week resulted in a net position of -5,072 contracts in the data reported through Tuesday. This was a weekly boost of 3,019 contracts from the previous week which had a total of -8,091 net contracts.

This week’s current strength score (the trader positioning range over the past three years, measured from 0 to 100) shows the speculators are currently Bullish with a score of 67.2 percent. The commercials are Bearish with a score of 28.9 percent and the small traders (not shown in chart) are Bullish-Extreme with a score of 100.0 percent.

Price Trend-Following Model: Weak Downtrend

Our weekly trend-following model classifies the current market price position as: Weak Downtrend.

SOFR 1-Month StatisticsSPECULATORSCOMMERCIALSSMALL TRADERS
– Percent of Open Interest Longs:16.563.71.9
– Percent of Open Interest Shorts:16.964.60.6
– Net Position:-5,072-10,92916,001
– Gross Longs:199,970774,06223,195
– Gross Shorts:205,042784,9917,194
– Long to Short Ratio:1.0 to 11.0 to 13.2 to 1
NET POSITION TREND:
– Strength Index Score (3 Year Range Pct):67.228.9100.0
– Strength Index Reading (3 Year Range):BullishBearishBullish-Extreme
NET POSITION MOVEMENT INDEX:
– 6-Week Change in Strength Index:8.7-14.851.4


2-Year Treasury Note Futures:

2-Year Treasury Bonds Futures COT ChartThe 2-Year Treasury Note large speculator standing this week resulted in a net position of -1,222,232 contracts in the data reported through Tuesday. This was a weekly decrease of -1,439 contracts from the previous week which had a total of -1,220,793 net contracts.

This week’s current strength score (the trader positioning range over the past three years, measured from 0 to 100) shows the speculators are currently Bearish-Extreme with a score of 18.2 percent. The commercials are Bullish-Extreme with a score of 82.0 percent and the small traders (not shown in chart) are Bullish with a score of 69.5 percent.

Price Trend-Following Model: Uptrend

Our weekly trend-following model classifies the current market price position as: Uptrend.

2-Year Treasury Note StatisticsSPECULATORSCOMMERCIALSSMALL TRADERS
– Percent of Open Interest Longs:13.677.76.0
– Percent of Open Interest Shorts:43.050.93.3
– Net Position:-1,222,2321,113,426108,806
– Gross Longs:562,7623,224,121247,644
– Gross Shorts:1,784,9942,110,695138,838
– Long to Short Ratio:0.3 to 11.5 to 11.8 to 1
NET POSITION TREND:
– Strength Index Score (3 Year Range Pct):18.282.069.5
– Strength Index Reading (3 Year Range):Bearish-ExtremeBullish-ExtremeBullish
NET POSITION MOVEMENT INDEX:
– 6-Week Change in Strength Index:0.3-0.1-0.9


5-Year Treasury Note Futures:

5-Year Treasury Bonds Futures COT ChartThe 5-Year Treasury Note large speculator standing this week resulted in a net position of -2,180,043 contracts in the data reported through Tuesday. This was a weekly boost of 116,453 contracts from the previous week which had a total of -2,296,496 net contracts.

This week’s current strength score (the trader positioning range over the past three years, measured from 0 to 100) shows the speculators are currently Bearish-Extreme with a score of 5.3 percent. The commercials are Bullish-Extreme with a score of 97.9 percent and the small traders (not shown in chart) are Bullish with a score of 74.3 percent.

Price Trend-Following Model: Uptrend

Our weekly trend-following model classifies the current market price position as: Uptrend.

5-Year Treasury Note StatisticsSPECULATORSCOMMERCIALSSMALL TRADERS
– Percent of Open Interest Longs:8.281.26.4
– Percent of Open Interest Shorts:38.752.74.5
– Net Position:-2,180,0432,041,577138,466
– Gross Longs:587,1925,807,519460,064
– Gross Shorts:2,767,2353,765,942321,598
– Long to Short Ratio:0.2 to 11.5 to 11.4 to 1
NET POSITION TREND:
– Strength Index Score (3 Year Range Pct):5.397.974.3
– Strength Index Reading (3 Year Range):Bearish-ExtremeBullish-ExtremeBullish
NET POSITION MOVEMENT INDEX:
– 6-Week Change in Strength Index:-7.212.0-13.0


10-Year Treasury Note Futures:

10-Year Treasury Notes Bonds Futures COT ChartThe 10-Year Treasury Note large speculator standing this week resulted in a net position of -890,351 contracts in the data reported through Tuesday. This was a weekly boost of 62,817 contracts from the previous week which had a total of -953,168 net contracts.

This week’s current strength score (the trader positioning range over the past three years, measured from 0 to 100) shows the speculators are currently Bearish with a score of 24.5 percent. The commercials are Bullish with a score of 77.3 percent and the small traders (not shown in chart) are Bullish with a score of 77.2 percent.

Price Trend-Following Model: Uptrend

Our weekly trend-following model classifies the current market price position as: Uptrend.

10-Year Treasury Note StatisticsSPECULATORSCOMMERCIALSSMALL TRADERS
– Percent of Open Interest Longs:9.377.48.8
– Percent of Open Interest Shorts:26.661.87.2
– Net Position:-890,351805,05385,298
– Gross Longs:480,1713,993,517454,804
– Gross Shorts:1,370,5223,188,464369,506
– Long to Short Ratio:0.4 to 11.3 to 11.2 to 1
NET POSITION TREND:
– Strength Index Score (3 Year Range Pct):24.577.377.2
– Strength Index Reading (3 Year Range):BearishBullishBullish
NET POSITION MOVEMENT INDEX:
– 6-Week Change in Strength Index:-2.67.5-10.1


Ultra 10-Year Notes Futures:

Ultra 10-Year Treasury Notes Bonds Futures COT ChartThe Ultra 10-Year Notes large speculator standing this week resulted in a net position of -319,607 contracts in the data reported through Tuesday. This was a weekly decline of -35,910 contracts from the previous week which had a total of -283,697 net contracts.

This week’s current strength score (the trader positioning range over the past three years, measured from 0 to 100) shows the speculators are currently Bearish-Extreme with a score of 0.0 percent. The commercials are Bullish-Extreme with a score of 95.3 percent and the small traders (not shown in chart) are Bullish-Extreme with a score of 93.6 percent.

Price Trend-Following Model: Weak Uptrend

Our weekly trend-following model classifies the current market price position as: Weak Uptrend.

Ultra 10-Year Notes StatisticsSPECULATORSCOMMERCIALSSMALL TRADERS
– Percent of Open Interest Longs:12.476.410.0
– Percent of Open Interest Shorts:26.161.910.8
– Net Position:-319,607337,514-17,907
– Gross Longs:287,3041,776,279232,514
– Gross Shorts:606,9111,438,765250,421
– Long to Short Ratio:0.5 to 11.2 to 10.9 to 1
NET POSITION TREND:
– Strength Index Score (3 Year Range Pct):0.095.393.6
– Strength Index Reading (3 Year Range):Bearish-ExtremeBullish-ExtremeBullish-Extreme
NET POSITION MOVEMENT INDEX:
– 6-Week Change in Strength Index:-68.381.05.7


US Treasury Bonds Futures:

US Year Treasury Notes Long Bonds Futures COT ChartThe US Treasury Bonds large speculator standing this week resulted in a net position of -77,629 contracts in the data reported through Tuesday. This was a weekly advance of 18,160 contracts from the previous week which had a total of -95,789 net contracts.

This week’s current strength score (the trader positioning range over the past three years, measured from 0 to 100) shows the speculators are currently Bullish with a score of 56.4 percent. The commercials are Bearish with a score of 33.0 percent and the small traders (not shown in chart) are Bullish-Extreme with a score of 85.4 percent.

Price Trend-Following Model: Weak Uptrend

Our weekly trend-following model classifies the current market price position as: Weak Uptrend.

US Treasury Bonds StatisticsSPECULATORSCOMMERCIALSSMALL TRADERS
– Percent of Open Interest Longs:10.174.912.6
– Percent of Open Interest Shorts:14.376.07.2
– Net Position:-77,629-20,57798,206
– Gross Longs:184,7891,369,783230,861
– Gross Shorts:262,4181,390,360132,655
– Long to Short Ratio:0.7 to 11.0 to 11.7 to 1
NET POSITION TREND:
– Strength Index Score (3 Year Range Pct):56.433.085.4
– Strength Index Reading (3 Year Range):BullishBearishBullish-Extreme
NET POSITION MOVEMENT INDEX:
– 6-Week Change in Strength Index:-15.614.6-3.8


Ultra US Treasury Bonds Futures:

Ultra US Year Treasury Notes Long Bonds Futures COT ChartThe Ultra US Treasury Bonds large speculator standing this week resulted in a net position of -261,222 contracts in the data reported through Tuesday. This was a weekly boost of 3,553 contracts from the previous week which had a total of -264,775 net contracts.

This week’s current strength score (the trader positioning range over the past three years, measured from 0 to 100) shows the speculators are currently Bullish with a score of 74.6 percent. The commercials are Bearish with a score of 29.5 percent and the small traders (not shown in chart) are Bearish with a score of 46.9 percent.

Price Trend-Following Model: Weak Uptrend

Our weekly trend-following model classifies the current market price position as: Weak Uptrend.

Ultra US Treasury Bonds StatisticsSPECULATORSCOMMERCIALSSMALL TRADERS
– Percent of Open Interest Longs:6.382.59.5
– Percent of Open Interest Shorts:20.170.18.1
– Net Position:-261,222234,24026,982
– Gross Longs:120,6051,568,207180,961
– Gross Shorts:381,8271,333,967153,979
– Long to Short Ratio:0.3 to 11.2 to 11.2 to 1
NET POSITION TREND:
– Strength Index Score (3 Year Range Pct):74.629.546.9
– Strength Index Reading (3 Year Range):BullishBearishBearish
NET POSITION MOVEMENT INDEX:
– 6-Week Change in Strength Index:-2.74.6-5.9


Article By InvestMacroReceive our weekly COT Newsletter

*COT Report: The COT data, released weekly to the public each Friday, is updated through the most recent Tuesday (data is 3 days old) and shows a quick view of how large speculators or non-commercials (for-profit traders) were positioned in the futures markets.

The CFTC categorizes trader positions according to commercial hedgers (traders who use futures contracts for hedging as part of the business), non-commercials (large traders who speculate to realize trading profits) and nonreportable traders (usually small traders/speculators) as well as their open interest (contracts open in the market at time of reporting). See CFTC criteria here.

COT Soft Commodities Charts: Speculator Bets led higher by Soybeans & Lean Hogs

By InvestMacro

Speculators OI Softs
Here are the latest charts and statistics for the Commitment of Traders (COT) reports data published by the Commodities Futures Trading Commission (CFTC).

The latest COT data is updated through Tuesday May 13th and shows a quick view of how large traders (for-profit speculators and commercial entities) were positioned in the futures markets.

Weekly Speculator Changes led by Soybeans & Lean Hogs

Speculators Nets Softs
The COT soft commodities markets speculator bets were overall higher this week as seven out of the eleven softs markets we cover had higher positioning while the other four markets had lower speculator contracts.

Leading the gains for the softs markets was Soybeans (15,793 contracts) with Lean Hogs (9,256 contracts), Soybean Oil (7,294 contracts), Sugar (6,490 contracts), Cocoa (3,957 contracts), Soybean Meal (3,027 contracts) and Live Cattle (2,016 contracts) also having positive weeks.

The markets with the declines in speculator bets this week were Corn (-97,793 contracts), Wheat (-10,563 contracts), Coffee (-3,271 contracts) and with Cotton (-7,467 contracts) also registering lower bets on the week.


Soft Commodities Data:

Speculators Table Softs
Legend: Weekly Speculators Change | Speculators Current Net Position | Speculators Strength Score compared to last 3-Years (0-100 range)


Strength Scores led by Live Cattle & Soybean Oil

Speculators Strength Softs
COT Strength Scores (a normalized measure of Speculator positions over a 3-Year range, from 0 to 100 where above 80 is Extreme-Bullish and below 20 is Extreme-Bearish) showed that Live Cattle (88 percent) and Soybean Oil (83 percent) lead the softs markets this week. Coffee (71 percent), Soybeans (67 percent) and Lean Hogs (64 percent) come in as the next highest in the weekly strength scores.

On the downside, Wheat (0 percent) and Soybean Meal (7 percent) come in at the lowest strength levels currently and are in Extreme-Bearish territory (below 20 percent). The next lowest strength scores are the Sugar (20 percent) and the Cotton (27 percent).

Strength Statistics:
Corn (38.7 percent) vs Corn previous week (52.0 percent)
Sugar (19.8 percent) vs Sugar previous week (17.8 percent)
Coffee (70.5 percent) vs Coffee previous week (73.7 percent)
Soybeans (67.2 percent) vs Soybeans previous week (63.2 percent)
Soybean Oil (82.8 percent) vs Soybean Oil previous week (78.8 percent)
Soybean Meal (6.5 percent) vs Soybean Meal previous week (5.3 percent)
Live Cattle (87.5 percent) vs Live Cattle previous week (85.6 percent)
Lean Hogs (64.0 percent) vs Lean Hogs previous week (56.8 percent)
Cotton (27.1 percent) vs Cotton previous week (31.7 percent)
Cocoa (31.2 percent) vs Cocoa previous week (27.2 percent)
Wheat (0.0 percent) vs Wheat previous week (7.3 percent)


Soybean Oil & Soybeans top the 6-Week Strength Trends

Speculators Trend Softs
COT Strength Score Trends (or move index, calculates the 6-week changes in strength scores) showed that Soybean Oil (34 percent) and Soybeans (18 percent) lead the past six weeks trends for soft commodities. Cotton (15 percent), Lean Hogs (13 percent) and Cocoa (2 percent) are the next highest positive movers in the latest trends data.

Corn (-20 percent) leads the downside trend scores currently with Live Cattle (-12 percent) and Wheat (-11 percent) following next with lower trend scores.

Strength Trend Statistics:
Corn (-20.2 percent) vs Corn previous week (-11.5 percent)
Sugar (-7.7 percent) vs Sugar previous week (-9.5 percent)
Coffee (-7.7 percent) vs Coffee previous week (-8.8 percent)
Soybeans (17.6 percent) vs Soybeans previous week (16.3 percent)
Soybean Oil (34.3 percent) vs Soybean Oil previous week (49.9 percent)
Soybean Meal (1.4 percent) vs Soybean Meal previous week (-1.9 percent)
Live Cattle (-12.5 percent) vs Live Cattle previous week (-9.0 percent)
Lean Hogs (12.6 percent) vs Lean Hogs previous week (6.3 percent)
Cotton (14.9 percent) vs Cotton previous week (26.7 percent)
Cocoa (2.3 percent) vs Cocoa previous week (-1.4 percent)
Wheat (-10.6 percent) vs Wheat previous week (-17.3 percent)


Individual Soft Commodities Markets:

CORN Futures:

CORN Futures COT ChartThe CORN large speculator standing this week reached a net position of 18,106 contracts in the data reported through Tuesday. This was a weekly reduction of -97,793 contracts from the previous week which had a total of 115,899 net contracts.

This week’s current strength score (the trader positioning range over the past three years, measured from 0 to 100) shows the speculators are currently Bearish with a score of 38.7 percent. The commercials are Bullish with a score of 59.2 percent and the small traders (not shown in chart) are Bullish with a score of 70.2 percent.

Price Trend-Following Model: Strong Downtrend

Our weekly trend-following model classifies the current market price position as: Strong Downtrend.

CORN Futures StatisticsSPECULATORSCOMMERCIALSSMALL TRADERS
– Percent of Open Interest Longs:21.546.38.7
– Percent of Open Interest Shorts:20.345.410.6
– Net Position:18,10613,151-31,257
– Gross Longs:341,178735,478137,591
– Gross Shorts:323,072722,327168,848
– Long to Short Ratio:1.1 to 11.0 to 10.8 to 1
NET POSITION TREND:
– Strength Index Score (3 Year Range Pct):38.759.270.2
– Strength Index Reading (3 Year Range):BearishBullishBullish
NET POSITION MOVEMENT INDEX:
– 6-Week Change in Strength Index:-20.218.928.3


SUGAR Futures:

SUGAR Futures COT ChartThe SUGAR large speculator standing this week reached a net position of 28,930 contracts in the data reported through Tuesday. This was a weekly rise of 6,490 contracts from the previous week which had a total of 22,440 net contracts.

This week’s current strength score (the trader positioning range over the past three years, measured from 0 to 100) shows the speculators are currently Bearish-Extreme with a score of 19.8 percent. The commercials are Bullish-Extreme with a score of 82.1 percent and the small traders (not shown in chart) are Bearish with a score of 24.0 percent.

Price Trend-Following Model: Weak Uptrend

Our weekly trend-following model classifies the current market price position as: Weak Uptrend.

SUGAR Futures StatisticsSPECULATORSCOMMERCIALSSMALL TRADERS
– Percent of Open Interest Longs:25.551.68.3
– Percent of Open Interest Shorts:21.855.68.0
– Net Position:28,930-31,2822,352
– Gross Longs:200,858406,50065,256
– Gross Shorts:171,928437,78262,904
– Long to Short Ratio:1.2 to 10.9 to 11.0 to 1
NET POSITION TREND:
– Strength Index Score (3 Year Range Pct):19.882.124.0
– Strength Index Reading (3 Year Range):Bearish-ExtremeBullish-ExtremeBearish
NET POSITION MOVEMENT INDEX:
– 6-Week Change in Strength Index:-7.710.9-22.3


COFFEE Futures:

COFFEE Futures COT ChartThe COFFEE large speculator standing this week reached a net position of 46,070 contracts in the data reported through Tuesday. This was a weekly decrease of -3,271 contracts from the previous week which had a total of 49,341 net contracts.

This week’s current strength score (the trader positioning range over the past three years, measured from 0 to 100) shows the speculators are currently Bullish with a score of 70.5 percent. The commercials are Bearish with a score of 30.8 percent and the small traders (not shown in chart) are Bullish with a score of 57.1 percent.

Price Trend-Following Model: Uptrend

Our weekly trend-following model classifies the current market price position as: Uptrend.

COFFEE Futures StatisticsSPECULATORSCOMMERCIALSSMALL TRADERS
– Percent of Open Interest Longs:36.638.15.5
– Percent of Open Interest Shorts:6.869.44.0
– Net Position:46,070-48,3902,320
– Gross Longs:56,60358,8628,530
– Gross Shorts:10,533107,2526,210
– Long to Short Ratio:5.4 to 10.5 to 11.4 to 1
NET POSITION TREND:
– Strength Index Score (3 Year Range Pct):70.530.857.1
– Strength Index Reading (3 Year Range):BullishBearishBullish
NET POSITION MOVEMENT INDEX:
– 6-Week Change in Strength Index:-7.77.9-4.8


SOYBEANS Futures:

SOYBEANS Futures COT ChartThe SOYBEANS large speculator standing this week reached a net position of 65,178 contracts in the data reported through Tuesday. This was a weekly lift of 15,793 contracts from the previous week which had a total of 49,385 net contracts.

This week’s current strength score (the trader positioning range over the past three years, measured from 0 to 100) shows the speculators are currently Bullish with a score of 67.2 percent. The commercials are Bearish with a score of 30.0 percent and the small traders (not shown in chart) are Bullish with a score of 78.0 percent.

Price Trend-Following Model: Weak Downtrend

Our weekly trend-following model classifies the current market price position as: Weak Downtrend.

SOYBEANS Futures StatisticsSPECULATORSCOMMERCIALSSMALL TRADERS
– Percent of Open Interest Longs:23.048.05.8
– Percent of Open Interest Shorts:15.054.37.4
– Net Position:65,178-51,976-13,202
– Gross Longs:188,820394,90047,999
– Gross Shorts:123,642446,87661,201
– Long to Short Ratio:1.5 to 10.9 to 10.8 to 1
NET POSITION TREND:
– Strength Index Score (3 Year Range Pct):67.230.078.0
– Strength Index Reading (3 Year Range):BullishBearishBullish
NET POSITION MOVEMENT INDEX:
– 6-Week Change in Strength Index:17.6-20.923.1


SOYBEAN OIL Futures:

SOYBEAN OIL Futures COT ChartThe SOYBEAN OIL large speculator standing this week reached a net position of 74,199 contracts in the data reported through Tuesday. This was a weekly increase of 7,294 contracts from the previous week which had a total of 66,905 net contracts.

This week’s current strength score (the trader positioning range over the past three years, measured from 0 to 100) shows the speculators are currently Bullish-Extreme with a score of 82.8 percent. The commercials are Bearish-Extreme with a score of 18.9 percent and the small traders (not shown in chart) are Bullish with a score of 58.0 percent.

Price Trend-Following Model: Strong Uptrend

Our weekly trend-following model classifies the current market price position as: Strong Uptrend.

SOYBEAN OIL Futures StatisticsSPECULATORSCOMMERCIALSSMALL TRADERS
– Percent of Open Interest Longs:26.744.76.1
– Percent of Open Interest Shorts:14.059.04.5
– Net Position:74,199-83,8129,613
– Gross Longs:156,359261,55635,793
– Gross Shorts:82,160345,36826,180
– Long to Short Ratio:1.9 to 10.8 to 11.4 to 1
NET POSITION TREND:
– Strength Index Score (3 Year Range Pct):82.818.958.0
– Strength Index Reading (3 Year Range):Bullish-ExtremeBearish-ExtremeBullish
NET POSITION MOVEMENT INDEX:
– 6-Week Change in Strength Index:34.3-34.523.5


SOYBEAN MEAL Futures:

SOYBEAN MEAL Futures COT ChartThe SOYBEAN MEAL large speculator standing this week reached a net position of -50,928 contracts in the data reported through Tuesday. This was a weekly boost of 3,027 contracts from the previous week which had a total of -53,955 net contracts.

This week’s current strength score (the trader positioning range over the past three years, measured from 0 to 100) shows the speculators are currently Bearish-Extreme with a score of 6.5 percent. The commercials are Bullish-Extreme with a score of 90.7 percent and the small traders (not shown in chart) are Bearish with a score of 44.5 percent.

Price Trend-Following Model: Strong Downtrend

Our weekly trend-following model classifies the current market price position as: Strong Downtrend.

SOYBEAN MEAL Futures StatisticsSPECULATORSCOMMERCIALSSMALL TRADERS
– Percent of Open Interest Longs:21.348.98.8
– Percent of Open Interest Shorts:30.143.35.6
– Net Position:-50,92832,70718,221
– Gross Longs:124,466285,12951,140
– Gross Shorts:175,394252,42232,919
– Long to Short Ratio:0.7 to 11.1 to 11.6 to 1
NET POSITION TREND:
– Strength Index Score (3 Year Range Pct):6.590.744.5
– Strength Index Reading (3 Year Range):Bearish-ExtremeBullish-ExtremeBearish
NET POSITION MOVEMENT INDEX:
– 6-Week Change in Strength Index:1.4-0.7-9.1


LIVE CATTLE Futures:

LIVE CATTLE Futures COT ChartThe LIVE CATTLE large speculator standing this week reached a net position of 110,647 contracts in the data reported through Tuesday. This was a weekly gain of 2,016 contracts from the previous week which had a total of 108,631 net contracts.

This week’s current strength score (the trader positioning range over the past three years, measured from 0 to 100) shows the speculators are currently Bullish-Extreme with a score of 87.5 percent. The commercials are Bearish-Extreme with a score of 15.3 percent and the small traders (not shown in chart) are Bearish-Extreme with a score of 17.1 percent.

Price Trend-Following Model: Strong Uptrend

Our weekly trend-following model classifies the current market price position as: Strong Uptrend.

LIVE CATTLE Futures StatisticsSPECULATORSCOMMERCIALSSMALL TRADERS
– Percent of Open Interest Longs:51.125.88.0
– Percent of Open Interest Shorts:22.048.914.1
– Net Position:110,647-87,816-22,831
– Gross Longs:194,27597,81730,544
– Gross Shorts:83,628185,63353,375
– Long to Short Ratio:2.3 to 10.5 to 10.6 to 1
NET POSITION TREND:
– Strength Index Score (3 Year Range Pct):87.515.317.1
– Strength Index Reading (3 Year Range):Bullish-ExtremeBearish-ExtremeBearish-Extreme
NET POSITION MOVEMENT INDEX:
– 6-Week Change in Strength Index:-12.512.39.5


LEAN HOGS Futures:

LEAN HOGS Futures COT ChartThe LEAN HOGS large speculator standing this week reached a net position of 46,757 contracts in the data reported through Tuesday. This was a weekly lift of 9,256 contracts from the previous week which had a total of 37,501 net contracts.

This week’s current strength score (the trader positioning range over the past three years, measured from 0 to 100) shows the speculators are currently Bullish with a score of 64.0 percent. The commercials are Bearish with a score of 33.1 percent and the small traders (not shown in chart) are Bullish with a score of 61.7 percent.

Price Trend-Following Model: Weak Downtrend

Our weekly trend-following model classifies the current market price position as: Weak Downtrend.

LEAN HOGS Futures StatisticsSPECULATORSCOMMERCIALSSMALL TRADERS
– Percent of Open Interest Longs:38.533.37.4
– Percent of Open Interest Shorts:22.348.58.3
– Net Position:46,757-44,113-2,644
– Gross Longs:111,31496,24821,292
– Gross Shorts:64,557140,36123,936
– Long to Short Ratio:1.7 to 10.7 to 10.9 to 1
NET POSITION TREND:
– Strength Index Score (3 Year Range Pct):64.033.161.7
– Strength Index Reading (3 Year Range):BullishBearishBullish
NET POSITION MOVEMENT INDEX:
– 6-Week Change in Strength Index:12.6-14.22.6


COTTON Futures:

COTTON Futures COT ChartThe COTTON large speculator standing this week reached a net position of -17,543 contracts in the data reported through Tuesday. This was a weekly decline of -7,467 contracts from the previous week which had a total of -10,076 net contracts.

This week’s current strength score (the trader positioning range over the past three years, measured from 0 to 100) shows the speculators are currently Bearish with a score of 27.1 percent. The commercials are Bullish with a score of 76.0 percent and the small traders (not shown in chart) are Bearish-Extreme with a score of 6.2 percent.

Price Trend-Following Model: Strong Downtrend

Our weekly trend-following model classifies the current market price position as: Strong Downtrend.

COTTON Futures StatisticsSPECULATORSCOMMERCIALSSMALL TRADERS
– Percent of Open Interest Longs:28.747.75.0
– Percent of Open Interest Shorts:36.538.96.0
– Net Position:-17,54319,738-2,195
– Gross Longs:64,575107,15711,294
– Gross Shorts:82,11887,41913,489
– Long to Short Ratio:0.8 to 11.2 to 10.8 to 1
NET POSITION TREND:
– Strength Index Score (3 Year Range Pct):27.176.06.2
– Strength Index Reading (3 Year Range):BearishBullishBearish-Extreme
NET POSITION MOVEMENT INDEX:
– 6-Week Change in Strength Index:14.9-11.2-34.9


COCOA Futures:

COCOA Futures COT ChartThe COCOA large speculator standing this week reached a net position of 20,868 contracts in the data reported through Tuesday. This was a weekly gain of 3,957 contracts from the previous week which had a total of 16,911 net contracts.

This week’s current strength score (the trader positioning range over the past three years, measured from 0 to 100) shows the speculators are currently Bearish with a score of 31.2 percent. The commercials are Bullish with a score of 66.3 percent and the small traders (not shown in chart) are Bullish-Extreme with a score of 83.6 percent.

Price Trend-Following Model: Weak Downtrend

Our weekly trend-following model classifies the current market price position as: Weak Downtrend.

COCOA Futures StatisticsSPECULATORSCOMMERCIALSSMALL TRADERS
– Percent of Open Interest Longs:31.537.012.3
– Percent of Open Interest Shorts:10.064.95.9
– Net Position:20,868-27,0226,154
– Gross Longs:30,51835,85911,897
– Gross Shorts:9,65062,8815,743
– Long to Short Ratio:3.2 to 10.6 to 12.1 to 1
NET POSITION TREND:
– Strength Index Score (3 Year Range Pct):31.266.383.6
– Strength Index Reading (3 Year Range):BearishBullishBullish-Extreme
NET POSITION MOVEMENT INDEX:
– 6-Week Change in Strength Index:2.3-5.230.7


WHEAT Futures:

WHEAT Futures COT ChartThe WHEAT large speculator standing this week reached a net position of -118,100 contracts in the data reported through Tuesday. This was a weekly lowering of -10,563 contracts from the previous week which had a total of -107,537 net contracts.

This week’s current strength score (the trader positioning range over the past three years, measured from 0 to 100) shows the speculators are currently Bearish-Extreme with a score of 0.0 percent. The commercials are Bullish-Extreme with a score of 100.0 percent and the small traders (not shown in chart) are Bullish-Extreme with a score of 87.8 percent.

Price Trend-Following Model: Strong Downtrend

Our weekly trend-following model classifies the current market price position as: Strong Downtrend.

WHEAT Futures StatisticsSPECULATORSCOMMERCIALSSMALL TRADERS
– Percent of Open Interest Longs:26.238.78.2
– Percent of Open Interest Shorts:50.715.37.0
– Net Position:-118,100112,4765,624
– Gross Longs:126,006186,21139,311
– Gross Shorts:244,10673,73533,687
– Long to Short Ratio:0.5 to 12.5 to 11.2 to 1
NET POSITION TREND:
– Strength Index Score (3 Year Range Pct):0.0100.087.8
– Strength Index Reading (3 Year Range):Bearish-ExtremeBullish-ExtremeBullish-Extreme
NET POSITION MOVEMENT INDEX:
– 6-Week Change in Strength Index:-10.612.3-8.6


Article By InvestMacroReceive our weekly COT Newsletter

*COT Report: The COT data, released weekly to the public each Friday, is updated through the most recent Tuesday (data is 3 days old) and shows a quick view of how large speculators or non-commercials (for-profit traders) were positioned in the futures markets.

The CFTC categorizes trader positions according to commercial hedgers (traders who use futures contracts for hedging as part of the business), non-commercials (large traders who speculate to realize trading profits) and nonreportable traders (usually small traders/speculators) as well as their open interest (contracts open in the market at time of reporting). See CFTC criteria here.

COT Stock Market Charts: Weekly Speculator Bets led by MSCI EAFE-Mini

By InvestMacro

Speculators OI Stocks COT Chart

Here are the latest charts and statistics for the Commitment of Traders (COT) data published by the Commodities Futures Trading Commission (CFTC).

The latest COT data is updated through Tuesday May 13th and shows a quick view of how large traders (for-profit speculators and commercial entities) were positioned in the futures markets.

Weekly Speculator Changes led by MSCI EAFE-Mini

Speculators Nets Stocks COT Chart

The COT stock markets speculator bets were overall lower this week as three out of the seven stock markets we cover had higher positioning while the other four markets had lower speculator contracts.

Leading the gains for the stock markets was the MSCI EAFE-Mini (7,301 contracts) with the Nikkei 225 (2,025 contracts) and the DowJones-Mini (1,319 contracts) also showing positive weeks.

The markets with the declines in speculator bets this week were the S&P500-Mini (-45,789 contracts), the Nasdaq-Mini (-13,300 contracts), the Russell-Mini (-13,528 contracts) and with the VIX (-4,844 contracts) also registering lower bets on the week.


Stock Market Data:

Speculators Table Stocks COT Chart

Legend: Weekly Speculators Change | Speculators Current Net Position | Speculators Strength Score compared to last 3-Years (0-100 range)


Strength Scores led by Nikkei 225 & VIX

Speculators Strength Stocks COT Chart

COT Strength Scores (a normalized measure of Speculator positions over a 3-Year range, from 0 to 100 where above 80 is Extreme-Bullish and below 20 is Extreme-Bearish) showed that the Nikkei 225 (96 percent) and the VIX (96 percent) lead the stock markets this week. The MSCI EAFE-Mini (93 percent) and DowJones-Mini (72 percent) come in as the next highest in the weekly strength scores.

On the downside, the S&P500-Mini (57 percent) comes in at the lowest strength level currently but is still above the 50 percent midpoint for the past 3-years.

Strength Statistics:
VIX (95.9 percent) vs VIX previous week (100.0 percent)
S&P500-Mini (57.0 percent) vs S&P500-Mini previous week (65.3 percent)
DowJones-Mini (71.9 percent) vs DowJones-Mini previous week (69.7 percent)
Nasdaq-Mini (69.5 percent) vs Nasdaq-Mini previous week (90.1 percent)
Russell2000-Mini (62.6 percent) vs Russell2000-Mini previous week (71.9 percent)
Nikkei USD (96.4 percent) vs Nikkei USD previous week (79.1 percent)
EAFE-Mini (93.1 percent) vs EAFE-Mini previous week (83.0 percent)


Nikkei 225 & MSCI EAFE-Mini top the 6-Week Strength Trends

Speculators Trend Stocks COT Chart

COT Strength Score Trends (or move index, calculates the 6-week changes in strength scores) showed that the Nikkei 225 (35 percent) leads the past six weeks trends for the stock markets. The MSCI EAFE-Mini (17 percent), the DowJones-Mini (16 percent) and the VIX (14 percent) are the next highest positive movers in the latest trends data.

The S&P500-Mini (-19 percent) leads the downside trend scores currently with the Russell-Mini (-8 percent) coming in as the next market with lower trend scores.

Strength Trend Statistics:
VIX (14.0 percent) vs VIX previous week (17.0 percent)
S&P500-Mini (-18.8 percent) vs S&P500-Mini previous week (-4.2 percent)
DowJones-Mini (15.8 percent) vs DowJones-Mini previous week (16.3 percent)
Nasdaq-Mini (6.8 percent) vs Nasdaq-Mini previous week (37.4 percent)
Russell2000-Mini (-7.6 percent) vs Russell2000-Mini previous week (0.4 percent)
Nikkei USD (35.0 percent) vs Nikkei USD previous week (25.1 percent)
EAFE-Mini (17.2 percent) vs EAFE-Mini previous week (10.3 percent)


Individual Stock Market Charts:

VIX Volatility Futures:

VIX Volatility Futures COT ChartThe VIX Volatility large speculator standing this week totaled a net position of 6,099 contracts in the data reported through Tuesday. This was a weekly fall of -4,844 contracts from the previous week which had a total of 10,943 net contracts.

This week’s current strength score (the trader positioning range over the past three years, measured from 0 to 100) shows the speculators are currently Bullish-Extreme with a score of 95.9 percent. The commercials are Bearish-Extreme with a score of 2.8 percent and the small traders (not shown in chart) are Bullish-Extreme with a score of 88.7 percent.

Price Trend-Following Model: Weak Uptrend

Our weekly trend-following model classifies the current market price position as: Weak Uptrend.

VIX Volatility Futures StatisticsSPECULATORSCOMMERCIALSSMALL TRADERS
– Percent of Open Interest Longs:23.641.313.9
– Percent of Open Interest Shorts:21.444.912.4
– Net Position:6,099-10,1644,065
– Gross Longs:65,347114,11438,350
– Gross Shorts:59,248124,27834,285
– Long to Short Ratio:1.1 to 10.9 to 11.1 to 1
NET POSITION TREND:
– Strength Index Score (3 Year Range Pct):95.92.888.7
– Strength Index Reading (3 Year Range):Bullish-ExtremeBearish-ExtremeBullish-Extreme
NET POSITION MOVEMENT INDEX:
– 6-Week Change in Strength Index:14.0-15.09.5


S&P500 Mini Futures:

SP500 Mini Futures COT ChartThe S&P500 Mini large speculator standing this week totaled a net position of -122,194 contracts in the data reported through Tuesday. This was a weekly lowering of -45,789 contracts from the previous week which had a total of -76,405 net contracts.

This week’s current strength score (the trader positioning range over the past three years, measured from 0 to 100) shows the speculators are currently Bullish with a score of 57.0 percent. The commercials are Bearish with a score of 44.1 percent and the small traders (not shown in chart) are Bullish with a score of 61.3 percent.

Price Trend-Following Model: Weak Downtrend

Our weekly trend-following model classifies the current market price position as: Weak Downtrend.

S&P500 Mini Futures StatisticsSPECULATORSCOMMERCIALSSMALL TRADERS
– Percent of Open Interest Longs:11.474.011.8
– Percent of Open Interest Shorts:17.271.18.9
– Net Position:-122,19461,66960,525
– Gross Longs:243,2911,572,344250,278
– Gross Shorts:365,4851,510,675189,753
– Long to Short Ratio:0.7 to 11.0 to 11.3 to 1
NET POSITION TREND:
– Strength Index Score (3 Year Range Pct):57.044.161.3
– Strength Index Reading (3 Year Range):BullishBearishBullish
NET POSITION MOVEMENT INDEX:
– 6-Week Change in Strength Index:-18.817.6-5.8


Dow Jones Mini Futures:

Dow Jones Mini Futures COT ChartThe Dow Jones Mini large speculator standing this week totaled a net position of 7,114 contracts in the data reported through Tuesday. This was a weekly advance of 1,319 contracts from the previous week which had a total of 5,795 net contracts.

This week’s current strength score (the trader positioning range over the past three years, measured from 0 to 100) shows the speculators are currently Bullish with a score of 71.9 percent. The commercials are Bearish with a score of 32.0 percent and the small traders (not shown in chart) are Bearish with a score of 37.0 percent.

Price Trend-Following Model: Weak Downtrend

Our weekly trend-following model classifies the current market price position as: Weak Downtrend.

Dow Jones Mini Futures StatisticsSPECULATORSCOMMERCIALSSMALL TRADERS
– Percent of Open Interest Longs:17.161.912.4
– Percent of Open Interest Shorts:7.967.516.0
– Net Position:7,114-4,300-2,814
– Gross Longs:13,25947,9879,602
– Gross Shorts:6,14552,28712,416
– Long to Short Ratio:2.2 to 10.9 to 10.8 to 1
NET POSITION TREND:
– Strength Index Score (3 Year Range Pct):71.932.037.0
– Strength Index Reading (3 Year Range):BullishBearishBearish
NET POSITION MOVEMENT INDEX:
– 6-Week Change in Strength Index:15.8-11.5-10.7


Nasdaq Mini Futures:

Nasdaq Mini Futures COT ChartThe Nasdaq Mini large speculator standing this week totaled a net position of 19,547 contracts in the data reported through Tuesday. This was a weekly decline of -13,300 contracts from the previous week which had a total of 32,847 net contracts.

This week’s current strength score (the trader positioning range over the past three years, measured from 0 to 100) shows the speculators are currently Bullish with a score of 69.5 percent. The commercials are Bearish with a score of 42.6 percent and the small traders (not shown in chart) are Bearish with a score of 36.5 percent.

Price Trend-Following Model: Weak Downtrend

Our weekly trend-following model classifies the current market price position as: Weak Downtrend.

Nasdaq Mini Futures StatisticsSPECULATORSCOMMERCIALSSMALL TRADERS
– Percent of Open Interest Longs:30.255.412.1
– Percent of Open Interest Shorts:23.359.015.4
– Net Position:19,547-10,153-9,394
– Gross Longs:85,720157,12534,258
– Gross Shorts:66,173167,27843,652
– Long to Short Ratio:1.3 to 10.9 to 10.8 to 1
NET POSITION TREND:
– Strength Index Score (3 Year Range Pct):69.542.636.5
– Strength Index Reading (3 Year Range):BullishBearishBearish
NET POSITION MOVEMENT INDEX:
– 6-Week Change in Strength Index:6.819.7-43.2


Russell 2000 Mini Futures:

Russell 2000 Mini Futures COT ChartThe Russell 2000 Mini large speculator standing this week totaled a net position of -28,356 contracts in the data reported through Tuesday. This was a weekly fall of -13,528 contracts from the previous week which had a total of -14,828 net contracts.

This week’s current strength score (the trader positioning range over the past three years, measured from 0 to 100) shows the speculators are currently Bullish with a score of 62.6 percent. The commercials are Bearish with a score of 42.9 percent and the small traders (not shown in chart) are Bearish-Extreme with a score of 17.2 percent.

Price Trend-Following Model: Weak Downtrend

Our weekly trend-following model classifies the current market price position as: Weak Downtrend.

Russell 2000 Mini Futures StatisticsSPECULATORSCOMMERCIALSSMALL TRADERS
– Percent of Open Interest Longs:14.075.65.2
– Percent of Open Interest Shorts:20.468.65.8
– Net Position:-28,35630,861-2,505
– Gross Longs:62,021335,02223,084
– Gross Shorts:90,377304,16125,589
– Long to Short Ratio:0.7 to 11.1 to 10.9 to 1
NET POSITION TREND:
– Strength Index Score (3 Year Range Pct):62.642.917.2
– Strength Index Reading (3 Year Range):BullishBearishBearish-Extreme
NET POSITION MOVEMENT INDEX:
– 6-Week Change in Strength Index:-7.613.5-30.6


Nikkei Stock Average (USD) Futures:

Nikkei Stock Average (USD) Futures COT ChartThe Nikkei Stock Average (USD) large speculator standing this week totaled a net position of 1,904 contracts in the data reported through Tuesday. This was a weekly lift of 2,025 contracts from the previous week which had a total of -121 net contracts.

This week’s current strength score (the trader positioning range over the past three years, measured from 0 to 100) shows the speculators are currently Bullish-Extreme with a score of 96.4 percent. The commercials are Bearish-Extreme with a score of 15.4 percent and the small traders (not shown in chart) are Bearish with a score of 37.1 percent.

Price Trend-Following Model: Weak Uptrend

Our weekly trend-following model classifies the current market price position as: Weak Uptrend.

Nikkei Stock Average Futures StatisticsSPECULATORSCOMMERCIALSSMALL TRADERS
– Percent of Open Interest Longs:20.360.519.2
– Percent of Open Interest Shorts:2.575.422.1
– Net Position:1,904-1,590-314
– Gross Longs:2,1696,4802,056
– Gross Shorts:2658,0702,370
– Long to Short Ratio:8.2 to 10.8 to 10.9 to 1
NET POSITION TREND:
– Strength Index Score (3 Year Range Pct):96.415.437.1
– Strength Index Reading (3 Year Range):Bullish-ExtremeBearish-ExtremeBearish
NET POSITION MOVEMENT INDEX:
– 6-Week Change in Strength Index:35.0-26.7-5.5


MSCI EAFE Mini Futures:

MSCI EAFE Mini Futures COT ChartThe MSCI EAFE Mini large speculator standing this week totaled a net position of 2,709 contracts in the data reported through Tuesday. This was a weekly advance of 7,301 contracts from the previous week which had a total of -4,592 net contracts.

This week’s current strength score (the trader positioning range over the past three years, measured from 0 to 100) shows the speculators are currently Bullish-Extreme with a score of 93.1 percent. The commercials are Bearish-Extreme with a score of 15.9 percent and the small traders (not shown in chart) are Bearish with a score of 46.2 percent.

Price Trend-Following Model: Strong Uptrend

Our weekly trend-following model classifies the current market price position as: Strong Uptrend.

MSCI EAFE Mini Futures StatisticsSPECULATORSCOMMERCIALSSMALL TRADERS
– Percent of Open Interest Longs:9.088.42.4
– Percent of Open Interest Shorts:8.490.31.1
– Net Position:2,709-8,5685,859
– Gross Longs:41,277406,70710,913
– Gross Shorts:38,568415,2755,054
– Long to Short Ratio:1.1 to 11.0 to 12.2 to 1
NET POSITION TREND:
– Strength Index Score (3 Year Range Pct):93.115.946.2
– Strength Index Reading (3 Year Range):Bullish-ExtremeBearish-ExtremeBearish
NET POSITION MOVEMENT INDEX:
– 6-Week Change in Strength Index:17.2-11.2-15.1


Article By InvestMacroReceive our weekly COT Newsletter

*COT Report: The COT data, released weekly to the public each Friday, is updated through the most recent Tuesday (data is 3 days old) and shows a quick view of how large speculators or non-commercials (for-profit traders) were positioned in the futures markets.

The CFTC categorizes trader positions according to commercial hedgers (traders who use futures contracts for hedging as part of the business), non-commercials (large traders who speculate to realize trading profits) and nonreportable traders (usually small traders/speculators) as well as their open interest (contracts open in the market at time of reporting). See CFTC criteria here.

Banxico cut the rate by 0.50%. Natural gas prices fell to a 2-week low

By JustMarkets

The Dow Jones Index (US30) gained 0.21% on Thursday. The S&P 500 Index (US500) added 0.41%. The Nasdaq Technology Index (US100) closed lower by 0.18%. The GE stocks rose by 2.8% as Qatar placed Boeing’s most significant order for wide-body airplanes powered only by GE engines. Economic data showed retail sales slowed in April, and wholesale inflation unexpectedly fell, easing price concerns and lowering Treasury yields. Fed Chairman Powell warned of lingering economic uncertainty and potential supply-side shocks, keeping markets cautious despite recent optimism on US-China trade.

The Mexican peso slipped to 19.50 per US dollar from a seven-month peak of 19.38 as markets perceived a 50 bps cut in Banxico’s interest rate to 8.50% on May 15. With core and core inflation still at 3.9% and first-quarter GDP growth at just 0.2% after contraction, the Board decided that a modest rate cut would support the fragile economic recovery, keeping disinflation on track to meet the 3% target.

Equity markets in Europe were mostly down yesterday. Germany’s DAX (DE40) rose by 0.72%, France’s CAC 40 (FR40) closed higher by 0.21%, Spain’s IBEX35 (ES35) added 0.65%, and the UK’s FTSE 100 (UK100) closed 0.57%. Defense stocks rose amid fading prospects for peace talks to end Russia’s war in Ukraine. Shares of Hensoldt, Rheinmetall and Renk rose by 4-8%. Merck shares fell nearly 6% after the company cut its full-year forecast. Meanwhile, Siemens fell by 1.3% after disappointing second-quarter profit despite reiterating a positive outlook for fiscal 2025.

European Union officials said the bloc is pushing for a more comprehensive deal on tariff cuts with the US than those currently being negotiated with Britain and China. EU negotiators expressed confidence in the bloc’s economic clout and said they would not be pressured to reach unfavorable terms.

The US natural gas (XNG/USD) prices fell below $3.5/MMBtu, their lowest in two weeks, mainly due to weaker near-term demand expectations and lower LNG exports. Forecasts of warmer-than-normal weather through the end of May are expected to limit heating demand, while moderate temperatures are also expected to reduce cooling needs, reducing overall consumption.

Asian markets were mostly down yesterday. Japan’s Nikkei 225 (JP225) was down 0.98%, China’s FTSE China A50 (CHA50) lost 0.41%, Hong Kong’s Hang Seng (HK50) decreased by 0.79% and Australia’s ASX 200 (AU200) was positive 0.22% for yesterday.

The Reserve Bank of New Zealand’s (RBNZ) quarterly expectations survey showed that business executives now see inflation at 2.29% over the next two years as of Q2 2025, up from 2.06% in the previous quarter, the highest over a year. One-year inflation expectations also rose to 2.41% from 2.15%, the highest in the past four quarters.

S&P 500 (US500) 5,916.93 +24.35 (+0.41%)

Dow Jones (US30) 42,322.75 +271.69 (+0.65%)

DAX (DE40) 23,695.59 +168.58 (+0.72%)

FTSE 100 (UK100) 8,633.75 +48.74 (+0.57%)

USD index 100.81 -0.23 (-0.23%)

News feed for: 2025.05.16

  • Japan GDP (q/q) at 02:50 (GMT+3);
  • Japan Industrial Production (m/m) at 07:00 (GMT+3);
  • Switzerland Industrial Production (m/m) at 09:30 (GMT+3);
  • Eurozone Trade Balance (m/m) at 12:00 (GMT+3);
  • Switzerland SNB Chairman Schlegel Speaks at 14:00 (GMT+3);
  • US Building Permits (m/m) at 15:30 (GMT+3);
  • US Housing Starts (m/m) at 15:30 (GMT+3);
  • US Michigan Inflation Expectations (m/m) at 17:00 (GMT+3).

By JustMarkets


This article reflects a personal opinion and should not be interpreted as an investment advice, and/or offer, and/or a persistent request for carrying out financial transactions, and/or a guarantee, and/or a forecast of future events.

EUR/USD Unchanged Amid Mixed News and Lingering Risks

By RoboForex Analytical Department 

The EUR/USD pair remained steady near 1.1196 on Friday, closing the week with little movement.

Key drivers influencing EUR/USD

Earlier in the week, the US dollar strengthened as the US-China trade dispute showed signs of easing. However, this optimism was short-lived due to disappointing economic data.

The greenback initially rose by around 1% after Washington and Beijing agreed to reduce tariffs temporarily for 90 days, fuelling hopes of progress toward a broader trade deal. Yet, weak US economic indicators soon dampened sentiment:

  • The April producer price index (PPI) fell to 2.4% year-on-year, down from 3.4% and below the forecast of 2.5%
  • Month-on-month PPI dropped 0.5%, against expectations of no change
  • US retail sales growth slowed sharply to 0.1% in March, following February’s 1.7% surge
  • Industrial production stagnated in March after a 0.3% decline in February

These concerning figures have led traders to price in additional Fed rate cuts for 2025.

Technical analysis: EUR/USD

H4 Chart:

The EUR/USD continues to consolidate around 1.1173. A temporary rise to 1.1276 (testing resistance from below) remains possible, but this uptick is considered a corrective phase within the broader downtrend. Once complete, the pair may resume its decline toward 1.0950, this being the first key support level. The MACD indicator confirms this outlook, with its signal line below zero and pointing downward.

H1 Chart:

The pair has already met a local bullish target at 1.12653, followed by a pullback to 1.1170. Today, another test of 1.1276 is plausible, but the broader expectation remains bearish, with a potential drop towards 1.1100. This scenario is reinforced by the Stochastic oscillator, whose signal line is above 80, suggesting an imminent downward reversal towards 20.

Conclusion

The EUR/USD remains range-bound amid mixed fundamentals and technical signals. While a short-term rebound is possible, the dominant downtrend is expected to prevail, with key support levels at 1.0950 (H4) and 1.1100 (H1). Traders should monitor Fed policy expectations and upcoming economic data for further direction.


Disclaimer

Any forecasts contained herein are based on the author’s particular opinion. This analysis may not be treated as trading advice. RoboForex bears no responsibility for trading results based on trading recommendations and reviews contained herein.

Traders have lowered expectations of further easing from the RBA. Oversupply puts pressure on oil

By JustMarkets 

The US stocks ended Wednesday trading mixed as investors weighed changing trade policies and recent strength in the technology sector. The Dow Jones Index (US30) was down 0.21% at Wednesday’s close. The S&P500 Index (US500) added 0.10%. The Nasdaq Technology Index (US100) closed higher by 0.72%. Nvidia was up 3% after reports of artificial intelligence chip shipments to Saudi Arabia, while AMD jumped 4% after unveiling a $6 billion share repurchase plan. A broader rally in support of artificial intelligence contributed to a 17% rise in Super Micro Computer shares, helping to lift overall market sentiment. Meanwhile, President Trump’s visit to the Middle East led to several new business deals, including an agreement between Boeing and Qatar Airways and artificial intelligence initiatives in the Gulf.

The Canadian dollar weakened to 1.40 per dollar, retreating from a five-month high of 1.378, which reached May 6 amid dovish Bank of Canada (BoC) expectations and ongoing trade uncertainty. A marginal jobs increase of just 7,400 and a rise in the unemployment rate to 6.9% in April reinforced market bets on a possible rate cut by the Bank of Canada as early as June, weakening the loonie’s appeal.

Equity markets in Europe were mostly down yesterday. Germany’s DAX (DE40) was down 0.47%, France’s CAC 40 (FR40) closed down 0.47%, Spain’s IBEX35 (ES35) added 0.52%, and the UK’s FTSE 100 (UK100) closed down 0.21%. Meanwhile, President Trump’s visit to the Middle East led to several new business deals, including an agreement between Boeing and Qatar Airways and artificial intelligence initiatives in the Gulf. The consumer discretionary sector continued its volatile performance, recording record losses, with LVMH and Kering down 2 and 3% and L’Oreal down 3.3%. In turn, the healthcare sector continued to decline as US President Trump was expected to adopt a policy to cap drug prices, with Sanofi and Bayer losing 1% and 2%, respectively.

WTI crude oil prices fell more than 2% to $61 per barrel on Thursday, extending losses from the previous session amid renewed oversupply concerns following an unexpected increase in US crude inventories. EIA data showed a 3.454 million barrel increase in crude inventories last week after industry data reported a significant 4.3 million barrel increase. On the supply side, OPEC lowered its forecast for non-OPEC+ production growth in 2025 to 800,000 bpd from 900,000 bpd, citing softer expectations for producers such as the US.

Asian markets were predominantly up. Japan’s Nikkei 225 (JP225) was down 0.14%, China’s FTSE China A50 (CHA50) added 1.71%, Hong Kong’s Hang Seng (HK50) was up 2.30%, and Australia’s ASX 200 (AU200) was positive 0.13% for yesterday.

China lifted export restrictions on rare earth metals and military technology for 28 US companies just two days after a major agreement between the US and China to reduce tariffs temporarily. In a sign of further improvement in relations, China also announced the temporary lifting of trade and investment bans for 17 US companies, calling the latest developments a potential reset in bilateral relations.

The Australian dollar rose to $0.644 on Thursday, rebounding some of the previous session’s losses after stronger-than-expected employment data underpinned a more hawkish outlook for monetary policy. Official data showed the Australian economy added 89,000 new jobs in April, bringing total employment to a record 14.64 million, well above the forecast of 20,000. The unemployment rate remained unchanged at 4.1%, which aligns with expectations. Although the Reserve Bank of Australia (RBA) is expected to cut the money rate by 25 basis points to 3.85% at next week’s meeting, traders have lowered expectations of further easing. Markets now estimate a total rate cut to end the year at around 76 basis points, down from 100 basis points a few weeks earlier.

S&P 500 (US500) 5,892.58 +6.03 (+0.10%)

Dow Jones (US30) 42,051.06 −89.37 (−0.21%)

DAX (DE40) 23,527.01 −111.55 (−0.47%)

FTSE 100 (UK100) 8,585.01 −17.91 (−0.21%)

USD index 101.02 +0.01 (+0.01%)

News feed for: 2025.05.15

  • Australia Unemployment Rate (m/m) at 04:30 (GMT+3);
  • UK GDP (m/m) at 09:00 (GMT+3);
  • UK Industrial Production (m/m) at 09:00 (GMT+3);
  • Switzerland Producer Price Index (m/m) at 09:30 (GMT+3);
  • Eurozone GDP (q/q) at 12:00 (GMT+3);
  • Eurozone Industrial Production (m/m) at 12:00 (GMT+3);
  • US Retail Sales (m/m) at 15:30 (GMT+3);
  • US Producer Price Index (m/m) at 15:30 (GMT+3);
  • US Initial Jobless Claims (w/w) at 15:30 (GMT+3);
  • US Fed Chair Powell Speaks at 15:40 (GMT+3);
  • US Industrial Production (m/m) at 16:15 (GMT+3);
  • US Natural Gas Storage (w/w) at 17:30 (GMT+3);
  • Mexico Banxico Interest Rate Decision at 22:00 (GMT+3).

By JustMarkets


This article reflects a personal opinion and should not be interpreted as an investment advice, and/or offer, and/or a persistent request for carrying out financial transactions, and/or a guarantee, and/or a forecast of future events.

GBP/USD at a Crossroads: Momentum Needed for New Buying Opportunities

By RoboForex Analytical Department 

The GBP/USD pair has again lost direction, hovering around 1.3283 on Thursday after hitting a seven-day high mid-week.

Key drivers influencing GBP/USD movement

The US dollar weakened on Wednesday, allowing the pound to regain ground. This shift followed ongoing currency negotiations between the US and South Korea, where both parties agreed to continue discussions on exchange rate policies. The reduced demand for the greenback lent support to most major currencies, including sterling.

Domestically, the market focus shifted to the Bank of England (BoE) commentary. Deputy Governor Sarah Breeden emphasised the necessity of long-term reforms in the bond market. At the same time, Monetary Policy Committee (MPC) member Catherine Mann noted that further rate cuts would require more evident signs of easing price pressures – essentially, a sustained drop in inflation.

Meanwhile, the latest UK labour market data revealed an increase in the unemployment rate to 4.5%, the highest since 2021, accompanied by a slowdown in wage growth.

These factors have collectively reinforced expectations of further monetary policy easing by the BoE. Despite internal MPC dissent, last week’s 25bps rate cut caught markets off guard, as many expected a pause in the easing cycle.

Technical analysis: GBP/USD

H4 Chart:

The pair continues to trade within a broad consolidation range around 1.3260

The current range extends to 1.3360, with a technical pullback to 1.3260 (testing from above) now underway

A drop towards 1.3200 is anticipated. A break below this level could extend the downtrend to 1.3100, potentially stretching further to 1.3030

This bearish outlook is supported by the MACD indicator, whose signal line remains above zero but is trending sharply upward

H1 Chart:

The pair broke above 1.3260, reaching the local upside target of 1.3360

Today’s corrective decline is testing 1.3260 again

A renewed upward move towards 1.3380 is possible if support holds

The Stochastic oscillator aligns with this scenario, with its signal line above 50 and rising towards 80


Conclusion

The GBP/USD remains in a holding pattern, awaiting fresh catalysts for a decisive move. While technical indicators suggest near-term volatility, the broader trend hinges on BoE policy signals and global risk sentiment. Traders should watch for a breakout beyond 1.3360 or a drop below 1.3200 for clearer directional bias.


Disclaimer

Any forecasts contained herein are based on the author’s particular opinion. This analysis may not be treated as trading advice. RoboForex bears no responsibility for trading results based on trading recommendations and reviews contained herein.

The Trump administration has revised semiconductor export rules. German DAX breaks price records again

By JustMarkets 

The Dow Jones Index (US30) was down 0.64% at Tuesday’s close. The S&P 500 Index (US500) was up 0.72%. The Nasdaq Technology Index (US100) closed higher by 1.58%. Weakening inflationary pressures boosted stocks after Tuesday’s smaller-than-expected US consumer price report for April. The US Consumer Price Index for April rose 2.3% y/y, slightly weaker than expectations of 2.4% y/y and the lowest increase in 4 years. The Consumer Price Index excluding food and energy for April rose by 2.8% y/y, unchanged from March and in line with expectations.

Additionally, a rally by chip makers on Tuesday supported the overall market on news that Nvidia and Advanced Micro Devices will supply semiconductors to Saudi Arabian artificial intelligence company Humain for a data center project. On Tuesday, the Commerce Department said it was rescinding President Biden’s artificial intelligence proliferation rule, and the Trump administration plans to overhaul export rules for semiconductors used in artificial intelligence, which could move toward customized deals with countries.

The Mexican peso strengthened to 19.4 per US dollar, hitting a seven-month high, as a sharp pullback in the US dollar drove it higher. Meanwhile, the Bank of Mexico is expected to make its seventh consecutive 50 basis point rate cut on Thursday, bringing the policy differential into line, although much of this has already been factored into the price.

Equity markets in Europe were mostly up yesterday. Germany’s DAX (DE40) rose by 0.31%, France’s CAC 40 (FR40) closed 0.30% higher, Spain’s IBEX35 (ES35) Index gained 0.83%, and the UK’s FTSE 100 (UK100) closed negative 0.02%. Frankfurt’s DAX Index closed at a new record high of 23,620 on Tuesday, marking its fourth session of gains, helped by upbeat German sentiment data and a cooler-than-expected US inflation report. The ZEW Index of German economic sentiment rose to 25.2 in May, well above the expectation of 11.9, thanks to optimism about domestic stability and improved trade dynamics. European stocks rose in the previous session after the US and China eased the trade war for the next 90 days to renegotiate trade terms, which supported the macroeconomic backdrop for all sectors. The auto sector led the gains, with shares of Volkswagen, BMW, and Stellantis adding between 4.5% and 3%. Industrial companies also rose strongly, with Siemens, Airbus, and Schneider gaining 1.5%.

WTI crude prices rose to $63.8 a barrel on Tuesday, hitting their fourth consecutive high in more than a month, amid new sanctions threats against Iran and an improving outlook for global trade flows. Speaking to Saudi Arabian officials, US President Trump reiterated his threat to impose sanctions on Iranian oil unless they agree to a nuclear deal. In turn, fears of widespread economic pain eased after the US and China agreed to reduce tariffs against each other temporarily.

Silver prices rose nearly 2% to above $33 an ounce on Tuesday, recovering from losses in the previous session as initial enthusiasm over the US-China trade agreement began to wane, giving way to broader market caution.

Asian markets were predominantly up yesterday. Japan’s Nikkei 225 (JP225) rose by 1.43%, China’s FTSE China A50 (CHA50) gained 0.31%, Hong Kong’s Hang Seng (HK50) declined 1.87%, and Australia’s ASX 200 (AU200) was positive 0.43%.

The Australian dollar climbed above $0.648 on Wednesday, posting its second consecutive session of gains, amid dollar weakness following softer-than-expected US inflation data. Given the heavy reliance of Australian exports on China, especially commodity exports, the local currency remains highly sensitive to trade dynamics between the US and China. On the domestic front, data showed that Australia’s first-quarter wage growth exceeded expectations. The Reserve Bank of Australia (RBA) is expected to cut interest rates by 25 basis points at its meeting next week, continuing to support economic growth amid global uncertainty.

India’s annual inflation rate for April 2025 fell to 3.16%, the lowest since July 2019, from 3.34% in the previous month and well below market expectations of 3.3%. This brought the inflation rate even lower than the Reserve Bank of India’s average target of 4%, strengthening the case for additional rate cuts by the Central Bank.

S&P 500 (US500) 5,886.55 +42.36 (+0.72%)

Dow Jones (US30) 42,140.43 −269.67 (−0.64%)

DAX (DE40) 23,638.56 +72.02 (+0.31%)

FTSE 100 (UK100) 8,602.92 −2.06 (−0.024%)

USD Index 100.93 −0.86 (−0.85%)

News feed for: 2025.05.14

  • Japan Producer Price Index (m/m) at 02:50 (GMT+3);
  • Australia Wage Price Index (q/q) at 04:30 (GMT+3);
  • US Crude Oil Reserves (w/w) at 17:30 (GMT+3);
  • Canada Annual Budget Release (Tentative).

By JustMarkets


This article reflects a personal opinion and should not be interpreted as an investment advice, and/or offer, and/or a persistent request for carrying out financial transactions, and/or a guarantee, and/or a forecast of future events.