Archive for Financial News – Page 49

Precious Metals Miner Maintains Strong Gold-Silver Gains

Source: Ben Pirie (7/18/25)

While Andean Precious Metals Corp. (APM:TSX; ANPMF:OTCQX) has lower than expected second-quarter production results, the company is still a Buy, according to an Atrium Research note.

On July 18, 2025, Atrium Research analysts Ben Pirie and Nicholas Cortellucci maintained a Buy rating on Andean Precious Metals Corp. (APM:TSX; ANPMF:OTCQX) while raising the target price to CA$4.50 from CA$3.50, representing 29% upside from the current share price of CA$3.50.

The analysts cited rising gold and silver prices, multiple expansions across the sector, and strong operational momentum despite slightly weaker-than-expected second-quarter production results.

Andean Precious Metals Inc. reported second quarter 2025 operational results producing 24.3 thousand ounces of gold equivalent between its Golden Queen and San Bartolome assets, which was softer than analyst estimates primarily due to seasonality factors. The company sold 23.0 thousand ounces of gold equivalent during the quarter, declining year-over-year due to a shift production cadence.

Golden Queen production came in at 12.2 thousand ounces of gold equivalent, down 28% year-over-year, compared to Atrium’s estimate of 14.4 thousand ounces. This consisted of 11.2 thousand ounces of gold and 89 thousand ounces of silver, with 11.8 thousand ounces of gold equivalent sold, including 10.9 thousand ounces of gold and 87 thousand ounces of silver.

San Bartolome production totaled 12.1 thousand ounces of gold equivalent, declining 9% year-over-year compared to the analyst estimate of 12.2 thousand ounces. This comprised 0.7 thousand ounces of gold and 1.0 million ounces of silver, with 11.2 thousand ounces of gold equivalent sold, including 0.5 thousand ounces of gold and 1.0 million ounces of silver.

Seasonal Production Profile and Guidance

Management reiterated that 60% of annual production will be mined in the second half of the year and confirmed the company remains on track for the top end of guidance.

Pirie and Cortellucci noted they “have now adjusted our model to better reflect the seasonality at San Bart” following the variance between their estimates and reported results due to the 40% first half, 60% second half production split.

Updated Financial Projections and Commodity Assumptions

The analysts updated their commodity price assumptions to US$2,700 per ounce for gold and US$31 per ounce for silver, increased from previous assumptions of US$2,400 per ounce and US$30 per ounce, respectively, though remaining “conservatively below spot prices.”

The revised assumptions result in forecasted adjusted EBITDA of $98 million for 2025, with the company trading at 3.7x 2025 estimated EBITDA.

For second quarter financials scheduled for release on August 12, 2025, after market close, the analysts expect sales of US$64.7 million (down 7% year-over-year), adjusted EBITDA of US$17.0 million, representing a 26% margin, and operating cash flow of US$13.0 million or 20% of revenue.

Valuation Methodology and Target Price Increase

The analysts increased their target multiple from 6.0x to 6.5x for 2025 estimated operating cash flow due to “multiple expansion across gold and silver producers” and strong operational results. The CA$4.50 target price equates to 5x 2025 estimated EBITDA, 8x 2025 estimated earnings, and an 8% free cash flow yield.

Andean Precious Metals stock has risen 130% since the analysts’ initiation of coverage, driven by higher gold and silver prices and operational execution. The company exhibits a 1.3x beta to silver and a 2.4x beta to gold, “offering investors strong exposure to rising metal prices.”

Financial Position and Strategic Advantages

The company maintains a strong balance sheet with US$101 million in cash and US$70 million in debt, providing flexibility for growth through acquisitions and capital returns via share buybacks. Andean Precious Metals has demonstrated a track record of successful acquisitions, including Golden Queen and San Bartolome properties.

The company benefits from aligned management with CEO Alberto Morales bringing over 30 years of merger and acquisition and finance experience, while owning 53% of shares, and Eric Sprott holding 15%, creating strong alignment with shareholders.

Near-Term Catalysts and Outlook

Key catalysts include ongoing operational improvements, exploration results, new contracts, and debt paydown or refinancing expected in the fourth quarter 2025. The analysts emphasized that APM “remains set up to generate large cash flow in the quarter, growing into H2” based on the seasonal production profile and current commodity price environment.

The company’s conference call is scheduled for August 13, 2025, at 9:00 AM Eastern Time to discuss second quarter financial results and provide operational updates.


Important Disclosures:

  1. This article does not constitute investment advice and is not a solicitation for any investment. Streetwise Reports does not render general or specific investment advice and the information on Streetwise Reports should not be considered a recommendation to buy or sell any security. Each reader is encouraged to consult with his or her personal financial adviser and perform their own comprehensive investment research. By opening this page, each reader accepts and agrees to Streetwise Reports’ terms of use and full legal disclaimer. Streetwise Reports does not endorse or recommend the business, products, services or securities of any company.

For additional disclosures, please click here.

Disclosures for Atrium Research, Andean Precious Metals, July 18, 2025

Analyst Certification Each authoring analyst of Atrium Research on this report certifies that (i) the recommendations and opinions expressed in this research accurately reflect the authoring analyst’s personal, independent and objective views about any and all of the designated securities discussed (ii) no part of the authoring analyst’s compensation was, is, or will be, directly or indirectly, related to the specific recommendations or views expressed in the research, (iii) to the best of the authoring analyst’s knowledge, she/he is not in receipt of material non-public information about the issuer, (iv) the analyst does not own common shares, options, or warrants in the company under coverage, and (v) the analysts adhere to the CFA Institute guidelines for analyst independence. Atrium Research Ratings System BUY: The stock is expected to generate returns of over 20% over the next 24 months. HOLD: The stock is expected to generate returns of 0-20% over the next 24 months. SELL: The stock is expected to generate negative returns over the next 24 months. NOT RATED (N/R): Atrium does not provide research coverage on the respective company. RATING COVERED COMPANIES BUY 25 HOLD 0 SELL 0 About Atrium Research Atrium Research provides institutional quality issuer paid research on public equities in North America. Our investment philosophy takes a 3-5 year view on equities currently being overlooked by the market. Our research process emphasizes understanding the key performance metrics for each specific company, trustworthy management teams, unit economics, and an in-depth valuation analysis. For further information on our team, please visit https://www.atriumresearch.ca/team. General Information Atrium Research Corporation (ARC) has created and distributed this report. This report is based on information we considered reliable; we have not been provided with any material non-public information by the company (or companies) discussed in this report. We do not represent that this report is accurate or complete and it should not be relied upon as such; further any information in this report is subject to change without any formal or type of notice provided. Investors should consider this report as only one factor in their investment decisions; this report is not intended as a replacement for investor’s independent judgment. ARC is not an IIROC registered dealer and does not offer investment-banking services to its clients. ARC (and its employees) do not own, trade or have a beneficial interest in the securities of the companies we provide research services for and does not serve as an officer or Director of the companies discussed in this report. ARC does not make a market in any securities. This report is not disseminated in connection with any distribution of securities and is not an offer to sell or the solicitation of an offer to buy any security in any jurisdiction where such an offer or solicitation would be illegal. ARC does not make any warranties, expressed or implied, as to the results to be obtained from using this information and makes no express of implied warranties for particular use. Anyone using this report assumes full responsibility for whatever results they obtain. This does not constitute a personal recommendation or take into account any financial or investment objectives, financial situations or needs of individuals. This report has not been prepared for any particular individual or institution. Recipients should consider whether any information in this report is suitable for their particular circumstances and should seek professional advice. Past performance is not a guide for future results, future returns are not guaranteed, and loss of original capital may occur. Neither ARC nor any person employed by ARC accepts any liability whatsoever for any direct or indirect loss resulting from any use of its research or the information it contains. This report contains “forward looking” statements. Forward-looking statements regarding the Company and/or stock’s performance inherently involve risks and uncertainties that could cause actual results to differ from such forward-looking statements. Such statements involve a number of risks and uncertainties such as competition, technology shifts, market demand and the company’s (and management’s) ability to correctly forecast financial estimates; please see the company’s MD&A “Risk Factors” Section for a more complete discussion of company specific risks for the company discussed in this report. ARC is receiving a cash compensation from Andean Precious Metals Corp. for 12-months of research coverage. This report was disseminated on behalf of Andean Precious Metals Corp. ARC retains full editorial control over its research content. ARC does not have investment banking relationships and does not expect to receive any investment banking driven income. ARC reports are primarily disseminated electronically and, in some cases, printed form. Electronic reports are simultaneously available to all recipients in any form. Reprints of ARC reports are prohibited without permission. To receive future reports on covered companies please visit https://www.atriumresearch.ca/research or subscribe on our website. The information contained in this report is intended to be viewed only in jurisdictions where it may be legally viewed and is not intended for use by any person or entity in any jurisdiction where such use would be contrary to local regulations or which would require any registration requirement within such jurisdiction.

Inflationary pressure is increasing in New Zealand. The People’s Bank of China kept interest rates unchanged

By JustMarkets

At the end of Friday, the Dow Jones Index (US30) fell by 0.32% (-0.01% for the week). The S&P 500 (US500) Index fell by 0.01% (+0.67% for the week). The Nasdaq (US100) Technology Index closed down 0.07% (+1.25% for the week). The US stocks closed nearly flat on Friday as investors weighed President Trump’s demand for higher tariffs against the European Union amid strong economic data and corporate earnings. According to reports, Trump is demanding minimum tariffs of 15–20% in any deal with the EU, which is working to conclude an agreement by August 1. On the corporate front, Netflix shares fell by 5.1% despite exceeding revenue and profit estimates, while Charles Schwab shares rose 3% thanks to strong results.

The University of Michigan Consumer Sentiment Index in the US rose to 61.8 in July 2025, its highest level in five months. Meanwhile, inflation expectations for the year ahead fell for the second month in a row to 4.4% from 5% in June. Long-term inflation expectations fell for the third consecutive month, dropping to 3.6% from 4%. Both inflation indicators are the lowest since February, indicating that consumers believe inflation will continue to decline further.

European stock markets were mostly down on Friday. The German DAX (DE40) fell by 0.33% (+1.05% for the week), the French CAC 40 (FR40) closed up 0.01% (+0.63% for the week), the Spanish IBEX35 (ES35) fell by 0.04% (+0.67% for the week), and the British FTSE 100 (UK100) closed up 0.22% (+0.57% for the week). European stocks closed in the red on Friday as investors monitored corporate events and signs of progress in trade negotiations between the US and the European Union. Technology companies continued their volatile movement as tariffs and broader economic uncertainty continued to cloud their outlook, with ASML shares falling 2.6%. Heavyweight luxury brands and automakers also closed in the red: Hermes, LVMH, Mercedes-Benz, and Stellantis lost between 1% and 3%.

WTI oil price reached $67.3 per barrel on Friday, posting a weekly decline of 1%, as mixed economic data from the US offset concerns about new EU sanctions on Russian energy exports. Weak US housing data points to a decline in housing investment, but improved consumer sentiment and lower inflation have raised hopes for future rate cuts and increased demand for energy. Meanwhile, the EU approved an 18th package of sanctions targeting the Russian oil industry, including a new floating price cap and a ban on petroleum products made from Russian oil.

Asian markets were mostly up last week. Japan’s Nikkei 225 (JP225) rose by 1.02%, China’s FTSE China A50 (CHA50) fell by 0.12%, Hong Kong’s Hang Seng (HK50) jumped by 3.01%, and Australia’s ASX 200 (AU200) showed a positive result of 2.06%.

The offshore yuan exchange rate remained virtually unchanged on Monday at around 7.17 per dollar as markets digested the latest decision by the People’s Bank of China. As expected, the Central Bank kept its benchmark lending rates at historic lows during its July rate-setting meeting. The 1-year prime rate, which is a key benchmark for most corporate and household loans, was kept at 3%, while the 5-year LPR, which determines mortgage rates, remained at 3.5%. This comes amid continuing signs of weak consumer sentiment and uneven economic growth.

The New Zealand dollar fell to $0.594 on Monday, reversing the previous session’s gains and ending up near a four-week low as investors reacted to softer-than-expected inflation data. In the second quarter, the Consumer Price Index rose by 0.5%, below the expectations of 0.6% compared to 0.9% in the first quarter. On an annualized basis, inflation rose to 2.7% from 2.5%, but fell short of the expectations of 2.8%. Although inflation is approaching the upper end of the RBNZ’s target range of 1–3%, weak underlying pressures and a significant economic downturn have kept expectations of a rate cut in August intact.

S&P 500 (US500) 6,296.79 −0.57 (−0.01%)

Dow Jones (US30) 44,342.19 −142.30 (−0.32%)

DAX (DE40) 24,289.51 −81.42 (−0.33%)

FTSE 100 (UK100) 8,992.12 +19.48 (+0.22%)

USD Index 98.46 −0.27 (−0.27%)

News feed for: 2025.07.21

  • New Zealand Consumer Price Index (q/q) at 01:45 (GMT+3);
  • China PBoC Loan Prime Rate at 04:00 (GMT+3);
  • Canada BOC Business Outlook Survey (m/m) at 17:30 (GMT+3).

By JustMarkets


This article reflects a personal opinion and should not be interpreted as an investment advice, and/or offer, and/or a persistent request for carrying out financial transactions, and/or a guarantee, and/or a forecast of future events.

Gold Starts the Week on the Upside as Investors Weigh Trump’s Tariff Threat

By RoboForex Analytical Department

The price of gold climbed to $3,350 per troy ounce on Monday, marking its second consecutive session of gains amid growing investor unease over Donald Trump’s proposed tariff policies.

US Commerce Secretary Howard Lutnick stated that 1 August would serve as a strict deadline for implementing so-called ‘mirror duties’, though negotiations could extend beyond that date. He indicated that a base tariff of 10% might apply to smaller trading partners.

Earlier in July, Trump notified more than twenty trading partners of new tariff rates, with some items facing levies as high as 40%.

However, last week’s robust US economic data has tempered expectations of an imminent Federal Reserve rate cut, thereby capping gold’s upside potential for now.

Investors are now focused on upcoming speeches from Fed Chair Jerome Powell and Governor Michelle Bowman, seeking fresh signals on the future direction of monetary policy.

Technical Analysis: XAU/USD

H4 Chart:

On the H4 chart, XAU/USD is continuing its upward movement towards $3,384. Today, we anticipate the pair will reach this level before undergoing a corrective pullback to $3,333. The market is effectively forming a broad consolidation range around $3,344.

A breakout above this range could extend gains toward $3,494. Conversely, a downside breach may trigger a decline toward $3,235. This scenario is technically supported by the MACD indicator, with its signal line above zero and pointing firmly upwards.

H1 Chart:

On the H1 chart, XAU/USD is consolidating around $3,333, having briefly declined to $3,310. The current structure suggests a fresh upward wave towards at least $3,390, followed by a retest of $3,333 from above. The Stochastic oscillator supports this scenario, with its signal line above 50 and rising towards 80.

Conclusion

Gold remains bullish in the short term, driven by tariff-related uncertainty, though expectations regarding Fed policy may limit further gains. Traders should monitor key resistance at $3,384 and support at $3,333 for directional cues.

Disclaimer

Any forecasts contained herein are based on the author’s particular opinion. This analysis may not be treated as trading advice. RoboForex bears no responsibility for trading results based on trading recommendations and reviews contained herein.

COT Metals Charts: Gold leads strong Metals Markets Positions

By InvestMacro

Metals Open Interest COT Chart
Here are the latest charts and statistics for the Commitment of Traders (COT) data published by the Commodities Futures Trading Commission (CFTC).

The latest COT data is updated through Tuesday July 15th and shows a quick view of how large traders (for-profit speculators and commercial entities) were positioned in the futures markets.

Weekly Speculator Changes led by Gold

Metals Net Positions COT Chart
The COT metals markets speculator bets were overall higher this week as five out of the six metals markets we cover had higher positioning while the other one markets had lower speculator contracts.

Leading the gains for the metals was Gold (10,147 contracts), Palladium (1,153 contracts), Copper (1,120 contracts), Silver (927 contracts) and Steel (187 contracts) also showing positive weeks. The market with declines in speculator bets for the week was Platinum (-1,472 contracts) also registering lower bets on the week.

Gold leads strong Metals Markets Positions

Gold led the market this week in terms of rising speculator positions, with the Gold price continuing to trade near its all-time high levels. This week, it closed a little below $3,360 and is still in an uptrend.

On the downside, Platinum was the only market to see a decline on the week, with a modest -1,472 contract decline. Platinum has also been a strong mover in the markets and is trading exceptionally higher since May, with a rise of almost 45% in just the past few months as the price has taken off.

Overall, the only metals market that still has a negative speculator level is Palladium at -3,581 contracts. Despite this bearish position, Palladium prices have also been on the rise, not as quite as sharp as the other metals but has started an upward move and risen to levels not seen since 2023.


Metals Data:

Metals Table COT Chart
Legend: Weekly Speculators Change | Speculators Current Net Position | Speculators Strength Score compared to last 3-Years (0-100 range)


Strength Scores led by Silver & Palladium

Metals Strength Scores COT Chart
COT Strength Scores (a normalized measure of Speculator positions over a 3-Year range, from 0 to 100 where above 80 is Extreme-Bullish and below 20 is Extreme-Bearish) showed that Silver (90 percent) and Palladium (78 percent) lead the metals markets this week. Steel (73 percent) comes in as the next highest in the weekly strength scores.

Strength Statistics:
Gold (61.2 percent) vs Gold previous week (57.3 percent)
Silver (90.3 percent) vs Silver previous week (89.2 percent)
Copper (71.2 percent) vs Copper previous week (70.1 percent)
Platinum (61.6 percent) vs Platinum previous week (65.1 percent)
Palladium (77.6 percent) vs Palladium previous week (68.9 percent)
Steel (73.3 percent) vs Palladium previous week (72.3 percent)


Palladium & Copper top the 6-Week Strength Trends

Metals Trends COT Chart
COT Strength Score Trends (or move index, calculates the 6-week changes in strength scores) showed that Palladium (28 percent) and Copper (15 percent) lead the past six weeks trends for metals.

Platinum (-2 percent) leads the downside trend scores currently with Silver (-2 percent) joining as the next market with lower trend scores.

Move Statistics:
Gold (9.6 percent) vs Gold previous week (10.9 percent)
Silver (-1.7 percent) vs Silver previous week (6.9 percent)
Copper (15.5 percent) vs Copper previous week (15.9 percent)
Platinum (-1.8 percent) vs Platinum previous week (-10.8 percent)
Palladium (27.9 percent) vs Palladium previous week (21.0 percent)
Steel (11.4 percent) vs Steel previous week (3.0 percent)


Individual Markets:

Gold Comex Futures:

Gold Futures COT ChartThe Gold Comex Futures large speculator standing this week equaled a net position of 213,115 contracts in the data reported through Tuesday. This was a weekly lift of 10,147 contracts from the previous week which had a total of 202,968 net contracts.

This week’s current strength score (the trader positioning range over the past three years, measured from 0 to 100) shows the speculators are currently Bullish with a score of 61.2 percent. The commercials are Bearish with a score of 32.1 percent and the small traders (not shown in chart) are Bullish-Extreme with a score of 100.0 percent.

Price Trend-Following Model: Uptrend

Our weekly trend-following model classifies the current market price position as: Uptrend.

Gold Futures StatisticsSPECULATORSCOMMERCIALSSMALL TRADERS
– Percent of Open Interest Longs:60.216.912.7
– Percent of Open Interest Shorts:12.772.84.3
– Net Position:213,115-250,68837,573
– Gross Longs:270,22775,98956,976
– Gross Shorts:57,112326,67719,403
– Long to Short Ratio:4.7 to 10.2 to 12.9 to 1
NET POSITION TREND:
– Strength Index Score (3 Year Range Pct):61.232.1100.0
– Strength Index Reading (3 Year Range):BullishBearishBullish-Extreme
NET POSITION MOVEMENT INDEX:
– 6-Week Change in Strength Index:9.6-10.815.8


Silver Comex Futures:

Silver Futures COT ChartThe Silver Comex Futures large speculator standing this week equaled a net position of 59,448 contracts in the data reported through Tuesday. This was a weekly increase of 927 contracts from the previous week which had a total of 58,521 net contracts.

This week’s current strength score (the trader positioning range over the past three years, measured from 0 to 100) shows the speculators are currently Bullish-Extreme with a score of 90.3 percent. The commercials are Bearish-Extreme with a score of 6.9 percent and the small traders (not shown in chart) are Bullish with a score of 68.4 percent.

Price Trend-Following Model: Strong Uptrend

Our weekly trend-following model classifies the current market price position as: Strong Uptrend.

Silver Futures StatisticsSPECULATORSCOMMERCIALSSMALL TRADERS
– Percent of Open Interest Longs:49.620.718.9
– Percent of Open Interest Shorts:14.967.17.1
– Net Position:59,448-79,64820,200
– Gross Longs:85,02235,46632,421
– Gross Shorts:25,574115,11412,221
– Long to Short Ratio:3.3 to 10.3 to 12.7 to 1
NET POSITION TREND:
– Strength Index Score (3 Year Range Pct):90.36.968.4
– Strength Index Reading (3 Year Range):Bullish-ExtremeBearish-ExtremeBullish
NET POSITION MOVEMENT INDEX:
– 6-Week Change in Strength Index:-1.7-0.68.9


Copper Grade #1 Futures:

Copper Futures COT ChartThe Copper Grade #1 Futures large speculator standing this week equaled a net position of 40,724 contracts in the data reported through Tuesday. This was a weekly advance of 1,120 contracts from the previous week which had a total of 39,604 net contracts.

This week’s current strength score (the trader positioning range over the past three years, measured from 0 to 100) shows the speculators are currently Bullish with a score of 71.2 percent. The commercials are Bearish with a score of 34.2 percent and the small traders (not shown in chart) are Bearish with a score of 25.6 percent.

Price Trend-Following Model: Strong Uptrend

Our weekly trend-following model classifies the current market price position as: Strong Uptrend.

Copper Futures StatisticsSPECULATORSCOMMERCIALSSMALL TRADERS
– Percent of Open Interest Longs:33.628.27.0
– Percent of Open Interest Shorts:15.546.96.5
– Net Position:40,724-42,0251,301
– Gross Longs:75,42363,26215,789
– Gross Shorts:34,699105,28714,488
– Long to Short Ratio:2.2 to 10.6 to 11.1 to 1
NET POSITION TREND:
– Strength Index Score (3 Year Range Pct):71.234.225.6
– Strength Index Reading (3 Year Range):BullishBearishBearish
NET POSITION MOVEMENT INDEX:
– 6-Week Change in Strength Index:15.5-12.9-9.8


Platinum Futures:

Platinum Futures COT ChartThe Platinum Futures large speculator standing this week equaled a net position of 19,302 contracts in the data reported through Tuesday. This was a weekly lowering of -1,472 contracts from the previous week which had a total of 20,774 net contracts.

This week’s current strength score (the trader positioning range over the past three years, measured from 0 to 100) shows the speculators are currently Bullish with a score of 61.6 percent. The commercials are Bearish with a score of 41.7 percent and the small traders (not shown in chart) are Bearish with a score of 39.5 percent.

Price Trend-Following Model: Strong Uptrend

Our weekly trend-following model classifies the current market price position as: Strong Uptrend.

Platinum Futures StatisticsSPECULATORSCOMMERCIALSSMALL TRADERS
– Percent of Open Interest Longs:60.221.411.1
– Percent of Open Interest Shorts:39.146.37.2
– Net Position:19,302-22,8493,547
– Gross Longs:55,18619,61110,187
– Gross Shorts:35,88442,4606,640
– Long to Short Ratio:1.5 to 10.5 to 11.5 to 1
NET POSITION TREND:
– Strength Index Score (3 Year Range Pct):61.641.739.5
– Strength Index Reading (3 Year Range):BullishBearishBearish
NET POSITION MOVEMENT INDEX:
– 6-Week Change in Strength Index:-1.80.94.2


Palladium Futures:

Palladium Futures COT ChartThe Palladium Futures large speculator standing this week equaled a net position of -3,581 contracts in the data reported through Tuesday. This was a weekly advance of 1,153 contracts from the previous week which had a total of -4,734 net contracts.

This week’s current strength score (the trader positioning range over the past three years, measured from 0 to 100) shows the speculators are currently Bullish with a score of 77.6 percent. The commercials are Bearish-Extreme with a score of 15.6 percent and the small traders (not shown in chart) are Bullish-Extreme with a score of 81.4 percent.

Price Trend-Following Model: Strong Uptrend

Our weekly trend-following model classifies the current market price position as: Strong Uptrend.

Palladium Futures StatisticsSPECULATORSCOMMERCIALSSMALL TRADERS
– Percent of Open Interest Longs:42.035.015.3
– Percent of Open Interest Shorts:60.022.99.4
– Net Position:-3,5812,4021,179
– Gross Longs:8,3446,9453,042
– Gross Shorts:11,9254,5431,863
– Long to Short Ratio:0.7 to 11.5 to 11.6 to 1
NET POSITION TREND:
– Strength Index Score (3 Year Range Pct):77.615.681.4
– Strength Index Reading (3 Year Range):BullishBearish-ExtremeBullish-Extreme
NET POSITION MOVEMENT INDEX:
– 6-Week Change in Strength Index:27.9-31.317.8


Steel Futures Futures:

Steel Futures COT ChartThe Steel Futures large speculator standing this week equaled a net position of 438 contracts in the data reported through Tuesday. This was a weekly advance of 187 contracts from the previous week which had a total of 251 net contracts.

This week’s current strength score (the trader positioning range over the past three years, measured from 0 to 100) shows the speculators are currently Bullish with a score of 73.3 percent. The commercials are Bearish with a score of 26.8 percent and the small traders (not shown in chart) are Bullish with a score of 65.5 percent.

Price Trend-Following Model: Downtrend

Our weekly trend-following model classifies the current market price position as: Downtrend.

Steel Futures StatisticsSPECULATORSCOMMERCIALSSMALL TRADERS
– Percent of Open Interest Longs:25.268.91.6
– Percent of Open Interest Shorts:23.671.40.7
– Net Position:438-670232
– Gross Longs:6,70018,299427
– Gross Shorts:6,26218,969195
– Long to Short Ratio:1.1 to 11.0 to 12.2 to 1
NET POSITION TREND:
– Strength Index Score (3 Year Range Pct):73.326.865.5
– Strength Index Reading (3 Year Range):BullishBearishBullish
NET POSITION MOVEMENT INDEX:
– 6-Week Change in Strength Index:11.4-12.115.1


Article By InvestMacroReceive our weekly COT Newsletter

*COT Report: The COT data, released weekly to the public each Friday, is updated through the most recent Tuesday (data is 3 days old) and shows a quick view of how large speculators or non-commercials (for-profit traders) were positioned in the futures markets.

The CFTC categorizes trader positions according to commercial hedgers (traders who use futures contracts for hedging as part of the business), non-commercials (large traders who speculate to realize trading profits) and nonreportable traders (usually small traders/speculators) as well as their open interest (contracts open in the market at time of reporting). See CFTC criteria here.

COT Bonds Charts: Speculator Bets led by SOFR 3-Months & 10-Year Bonds

By InvestMacro

Bonds Market Open Interest Comparison
Here are the latest charts and statistics for the Commitment of Traders (COT) reports data published by the Commodities Futures Trading Commission (CFTC).

The latest COT data is updated through Tuesday July 15th and shows a quick view of how large traders (for-profit speculators and commercial hedgers) were positioned in the futures markets.

Weekly Speculator Changes led by SOFR 3-Months & 10-Year Bonds

Bonds Market Net Speculators Positions
The COT bond market speculator bets were slightly higher this week as five out of the nine bond markets we cover had higher positioning while the other four markets had lower speculator contracts.

Leading the gains for the bond markets was the SOFR 3-Months (156,120 contracts), the 10-Year Bonds (68,202 contracts), the Ultra 10-Year Bonds (29,162 contracts), the Fed Funds (20,490 contracts) also showing positive weeks.

The bond markets with declines in speculator bets for the week were the 2-Year Bonds (-33,727 contracts), the US Treasury Bonds (-21,386 contracts), the 5-Year Bonds (11,259 contracts), the Ultra Treasury Bonds (-5,794 contracts),  and the SOFR 1-Month (-1,100 contracts) also registering lower bets on the week.

The 3-month Secured Overnight Financing Rate (SOFR) contracts were the leaders in the bond market for positive changes this week, gaining by over 150,000 positions. This market represents a short-term bond utilized by banks, broker-dealers and other entities and consistently has the highest open interest on a weekly basis.

On the other hand, the 2-year bond experienced the most significant decline this week, with a decrease of over -30,000 contracts.

Overall, most of the bond contract prices, ranging from the 2-year to the long treasury bonds, are trading within the same range that they have been for the past couple of years. While they are down from their 2020 levels, they continue to be in a holding pattern for the recent price history.


Bonds Data:

Bonds Market Speculators Data Table
Legend: Open Interest | Speculators Current Net Position | Weekly Specs Change | Specs Strength Score compared to last 3-Years (0-100 range)


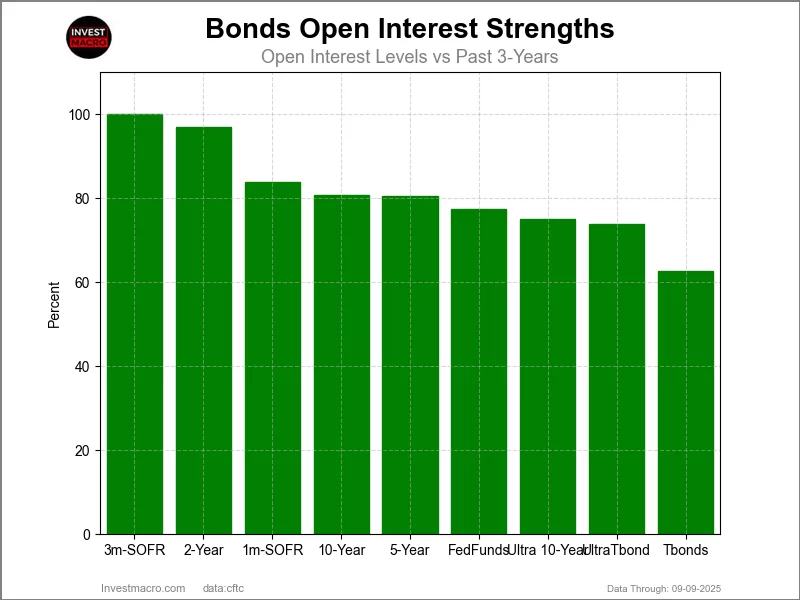
Strength Scores led by Ultra Treasury Bonds & Fed Funds

Bonds Market Strength Index Comparison
COT Strength Scores (a normalized measure of Speculator positions over a 3-Year range, from 0 to 100 where above 80 is Extreme-Bullish and below 20 is Extreme-Bearish) showed that the Ultra Treasury Bonds (85 percent) and the Fed Funds (65 percent) lead the bond markets this week.

On the downside, the 5-Year Bond (1 percent), the Ultra 10-Year Bonds (7 percent) and the 2-Year Bonds (13 percent) come in at the lowest strength level currently and are in Extreme-Bearish territory (below 20 percent).

Strength Statistics:
Fed Funds (64.7 percent) vs Fed Funds previous week (60.9 percent)
2-Year Bond (13.4 percent) vs 2-Year Bond previous week (15.8 percent)
5-Year Bond (0.5 percent) vs 5-Year Bond previous week (0.0 percent)
10-Year Bond (39.4 percent) vs 10-Year Bond previous week (32.1 percent)
Ultra 10-Year Bond (7.3 percent) vs Ultra 10-Year Bond previous week (0.0 percent)
US Treasury Bond (38.1 percent) vs US Treasury Bond previous week (45.5 percent)
Ultra US Treasury Bond (85.4 percent) vs Ultra US Treasury Bond previous week (87.6 percent)
SOFR 1-Month (31.8 percent) vs SOFR 1-Month previous week (32.1 percent)
SOFR 3-Months (35.1 percent) vs SOFR 3-Months previous week (27.0 percent)


Fed Funds & SOFR 3-Months top the 6-Week Strength Trends

Bonds Market Trend Index Comparison
COT Strength Score Trends (or move index, calculates the 6-week changes in strength scores) showed that the Fed Funds (37 percent) and the SOFR 3-Months (23 percent) lead the past six weeks trends for bonds.

The SOFR 1-Month (-32 percent), the 2-Year Bonds (-11 percent), the US Treasury Bonds (-10 percent) and the 10-Year Bonds (-7 percent) lead the downside trend scores currently.

Strength Trend Statistics:
Fed Funds (36.8 percent) vs Fed Funds previous week (55.1 percent)
2-Year Bond (-11.2 percent) vs 2-Year Bond previous week (-10.5 percent)
5-Year Bond (-5.0 percent) vs 5-Year Bond previous week (-8.3 percent)
10-Year Bond (-7.1 percent) vs 10-Year Bond previous week (-7.5 percent)
Ultra 10-Year Bond (-1.9 percent) vs Ultra 10-Year Bond previous week (-27.4 percent)
US Treasury Bond (-9.7 percent) vs US Treasury Bond previous week (-19.1 percent)
Ultra US Treasury Bond (-0.1 percent) vs Ultra US Treasury Bond previous week (4.0 percent)
SOFR 1-Month (-31.6 percent) vs SOFR 1-Month previous week (-48.3 percent)
SOFR 3-Months (22.9 percent) vs SOFR 3-Months previous week (21.3 percent)


30-Day Federal Funds Futures:

Federal Funds 30-Day Bonds Futures COT ChartThe 30-Day Federal Funds large speculator standing this week resulted in a net position of 54,744 contracts in the data reported through Tuesday. This was a weekly boost of 20,490 contracts from the previous week which had a total of 34,254 net contracts.

This week’s current strength score (the trader positioning range over the past three years, measured from 0 to 100) shows the speculators are currently Bullish with a score of 64.7 percent. The commercials are Bearish with a score of 31.1 percent and the small traders (not shown in chart) are Bullish with a score of 69.1 percent.

Price Trend-Following Model: Downtrend

Our weekly trend-following model classifies the current market price position as: Downtrend.

30-Day Federal Funds StatisticsSPECULATORSCOMMERCIALSSMALL TRADERS
– Percent of Open Interest Longs:20.561.72.4
– Percent of Open Interest Shorts:17.964.52.2
– Net Position:54,744-60,1935,449
– Gross Longs:437,9191,318,06251,540
– Gross Shorts:383,1751,378,25546,091
– Long to Short Ratio:1.1 to 11.0 to 11.1 to 1
NET POSITION TREND:
– Strength Index Score (3 Year Range Pct):64.731.169.1
– Strength Index Reading (3 Year Range):BullishBearishBullish
NET POSITION MOVEMENT INDEX:
– 6-Week Change in Strength Index:36.8-35.2-8.2


Secured Overnight Financing Rate (3-Month) Futures:

SOFR 3-Months Bonds Futures COT ChartThe Secured Overnight Financing Rate (3-Month) large speculator standing this week resulted in a net position of -487,148 contracts in the data reported through Tuesday. This was a weekly advance of 156,120 contracts from the previous week which had a total of -643,268 net contracts.

This week’s current strength score (the trader positioning range over the past three years, measured from 0 to 100) shows the speculators are currently Bearish with a score of 35.1 percent. The commercials are Bullish with a score of 62.5 percent and the small traders (not shown in chart) are Bullish-Extreme with a score of 100.0 percent.

Price Trend-Following Model: Weak Uptrend

Our weekly trend-following model classifies the current market price position as: Weak Uptrend.

SOFR 3-Months StatisticsSPECULATORSCOMMERCIALSSMALL TRADERS
– Percent of Open Interest Longs:12.260.00.8
– Percent of Open Interest Shorts:16.556.10.4
– Net Position:-487,148442,64244,506
– Gross Longs:1,394,5546,835,06590,452
– Gross Shorts:1,881,7026,392,42345,946
– Long to Short Ratio:0.7 to 11.1 to 12.0 to 1
NET POSITION TREND:
– Strength Index Score (3 Year Range Pct):35.162.5100.0
– Strength Index Reading (3 Year Range):BearishBullishBullish-Extreme
NET POSITION MOVEMENT INDEX:
– 6-Week Change in Strength Index:22.9-24.212.1


Individual Bond Markets:

Secured Overnight Financing Rate (1-Month) Futures:

SOFR 1-Month Bonds Futures COT ChartThe Secured Overnight Financing Rate (1-Month) large speculator standing this week resulted in a net position of -149,007 contracts in the data reported through Tuesday. This was a weekly decline of -1,100 contracts from the previous week which had a total of -147,907 net contracts.

This week’s current strength score (the trader positioning range over the past three years, measured from 0 to 100) shows the speculators are currently Bearish with a score of 31.8 percent. The commercials are Bullish with a score of 67.3 percent and the small traders (not shown in chart) are Bullish with a score of 74.1 percent.

Price Trend-Following Model: Weak Uptrend

Our weekly trend-following model classifies the current market price position as: Weak Uptrend.

SOFR 1-Month StatisticsSPECULATORSCOMMERCIALSSMALL TRADERS
– Percent of Open Interest Longs:10.669.70.4
– Percent of Open Interest Shorts:21.159.50.2
– Net Position:-149,007145,5003,507
– Gross Longs:151,257991,7155,958
– Gross Shorts:300,264846,2152,451
– Long to Short Ratio:0.5 to 11.2 to 12.4 to 1
NET POSITION TREND:
– Strength Index Score (3 Year Range Pct):31.867.374.1
– Strength Index Reading (3 Year Range):BearishBullishBullish
NET POSITION MOVEMENT INDEX:
– 6-Week Change in Strength Index:-31.629.715.4


2-Year Treasury Note Futures:

2-Year Treasury Bonds Futures COT ChartThe 2-Year Treasury Note large speculator standing this week resulted in a net position of -1,299,860 contracts in the data reported through Tuesday. This was a weekly reduction of -33,727 contracts from the previous week which had a total of -1,266,133 net contracts.

This week’s current strength score (the trader positioning range over the past three years, measured from 0 to 100) shows the speculators are currently Bearish-Extreme with a score of 13.4 percent. The commercials are Bullish-Extreme with a score of 86.4 percent and the small traders (not shown in chart) are Bullish with a score of 69.1 percent.

Price Trend-Following Model: Weak Uptrend

Our weekly trend-following model classifies the current market price position as: Weak Uptrend.

2-Year Treasury Note StatisticsSPECULATORSCOMMERCIALSSMALL TRADERS
– Percent of Open Interest Longs:13.877.75.7
– Percent of Open Interest Shorts:43.650.82.8
– Net Position:-1,299,8601,174,486125,374
– Gross Longs:600,0843,389,554247,372
– Gross Shorts:1,899,9442,215,068121,998
– Long to Short Ratio:0.3 to 11.5 to 12.0 to 1
NET POSITION TREND:
– Strength Index Score (3 Year Range Pct):13.486.469.1
– Strength Index Reading (3 Year Range):Bearish-ExtremeBullish-ExtremeBullish
NET POSITION MOVEMENT INDEX:
– 6-Week Change in Strength Index:-11.212.81.8


5-Year Treasury Note Futures:

5-Year Treasury Bonds Futures COT ChartThe 5-Year Treasury Note large speculator standing this week resulted in a net position of -2,505,528 contracts in the data reported through Tuesday. This was a weekly advance of 11,259 contracts from the previous week which had a total of -2,516,787 net contracts.

This week’s current strength score (the trader positioning range over the past three years, measured from 0 to 100) shows the speculators are currently Bearish-Extreme with a score of 0.5 percent. The commercials are Bullish-Extreme with a score of 100.0 percent and the small traders (not shown in chart) are Bullish with a score of 77.9 percent.

Price Trend-Following Model: Strong Uptrend

Our weekly trend-following model classifies the current market price position as: Strong Uptrend.

5-Year Treasury Note StatisticsSPECULATORSCOMMERCIALSSMALL TRADERS
– Percent of Open Interest Longs:6.984.46.1
– Percent of Open Interest Shorts:42.651.03.8
– Net Position:-2,505,5282,344,691160,837
– Gross Longs:487,0085,932,240430,351
– Gross Shorts:2,992,5363,587,549269,514
– Long to Short Ratio:0.2 to 11.7 to 11.6 to 1
NET POSITION TREND:
– Strength Index Score (3 Year Range Pct):0.5100.077.9
– Strength Index Reading (3 Year Range):Bearish-ExtremeBullish-ExtremeBullish
NET POSITION MOVEMENT INDEX:
– 6-Week Change in Strength Index:-5.06.3-2.9


10-Year Treasury Note Futures:

10-Year Treasury Notes Bonds Futures COT ChartThe 10-Year Treasury Note large speculator standing this week resulted in a net position of -772,377 contracts in the data reported through Tuesday. This was a weekly boost of 68,202 contracts from the previous week which had a total of -840,579 net contracts.

This week’s current strength score (the trader positioning range over the past three years, measured from 0 to 100) shows the speculators are currently Bearish with a score of 39.4 percent. The commercials are Bullish with a score of 57.9 percent and the small traders (not shown in chart) are Bullish with a score of 68.9 percent.

Price Trend-Following Model: Weak Uptrend

Our weekly trend-following model classifies the current market price position as: Weak Uptrend.

10-Year Treasury Note StatisticsSPECULATORSCOMMERCIALSSMALL TRADERS
– Percent of Open Interest Longs:11.777.68.9
– Percent of Open Interest Shorts:27.563.57.1
– Net Position:-772,377686,01986,358
– Gross Longs:572,0713,797,640435,018
– Gross Shorts:1,344,4483,111,621348,660
– Long to Short Ratio:0.4 to 11.2 to 11.2 to 1
NET POSITION TREND:
– Strength Index Score (3 Year Range Pct):39.457.968.9
– Strength Index Reading (3 Year Range):BearishBullishBullish
NET POSITION MOVEMENT INDEX:
– 6-Week Change in Strength Index:-7.17.34.8


Ultra 10-Year Notes Futures:

Ultra 10-Year Treasury Notes Bonds Futures COT ChartThe Ultra 10-Year Notes large speculator standing this week resulted in a net position of -379,116 contracts in the data reported through Tuesday. This was a weekly gain of 29,162 contracts from the previous week which had a total of -408,278 net contracts.

This week’s current strength score (the trader positioning range over the past three years, measured from 0 to 100) shows the speculators are currently Bearish-Extreme with a score of 7.3 percent. The commercials are Bullish-Extreme with a score of 93.1 percent and the small traders (not shown in chart) are Bullish with a score of 53.2 percent.

Price Trend-Following Model: Weak Uptrend

Our weekly trend-following model classifies the current market price position as: Weak Uptrend.

Ultra 10-Year Notes StatisticsSPECULATORSCOMMERCIALSSMALL TRADERS
– Percent of Open Interest Longs:10.679.19.3
– Percent of Open Interest Shorts:26.360.811.9
– Net Position:-379,116443,999-64,883
– Gross Longs:255,6301,913,429223,664
– Gross Shorts:634,7461,469,430288,547
– Long to Short Ratio:0.4 to 11.3 to 10.8 to 1
NET POSITION TREND:
– Strength Index Score (3 Year Range Pct):7.393.153.2
– Strength Index Reading (3 Year Range):Bearish-ExtremeBullish-ExtremeBullish
NET POSITION MOVEMENT INDEX:
– 6-Week Change in Strength Index:-1.9-0.16.5


US Treasury Bonds Futures:

US Year Treasury Notes Long Bonds Futures COT ChartThe US Treasury Bonds large speculator standing this week resulted in a net position of -130,144 contracts in the data reported through Tuesday. This was a weekly lowering of -21,386 contracts from the previous week which had a total of -108,758 net contracts.

This week’s current strength score (the trader positioning range over the past three years, measured from 0 to 100) shows the speculators are currently Bearish with a score of 38.1 percent. The commercials are Bullish with a score of 54.6 percent and the small traders (not shown in chart) are Bullish with a score of 60.0 percent.

Price Trend-Following Model: Downtrend

Our weekly trend-following model classifies the current market price position as: Downtrend.

US Treasury Bonds StatisticsSPECULATORSCOMMERCIALSSMALL TRADERS
– Percent of Open Interest Longs:8.077.912.5
– Percent of Open Interest Shorts:15.274.98.3
– Net Position:-130,14453,90876,236
– Gross Longs:145,1151,405,838226,498
– Gross Shorts:275,2591,351,930150,262
– Long to Short Ratio:0.5 to 11.0 to 11.5 to 1
NET POSITION TREND:
– Strength Index Score (3 Year Range Pct):38.154.660.0
– Strength Index Reading (3 Year Range):BearishBullishBullish
NET POSITION MOVEMENT INDEX:
– 6-Week Change in Strength Index:-9.711.4-10.8


Ultra US Treasury Bonds Futures:

Ultra US Year Treasury Notes Long Bonds Futures COT ChartThe Ultra US Treasury Bonds large speculator standing this week resulted in a net position of -228,618 contracts in the data reported through Tuesday. This was a weekly reduction of -5,794 contracts from the previous week which had a total of -222,824 net contracts.

This week’s current strength score (the trader positioning range over the past three years, measured from 0 to 100) shows the speculators are currently Bullish-Extreme with a score of 85.4 percent. The commercials are Bearish with a score of 33.5 percent and the small traders (not shown in chart) are Bearish-Extreme with a score of 4.7 percent.

Price Trend-Following Model: Downtrend

Our weekly trend-following model classifies the current market price position as: Downtrend.

Ultra US Treasury Bonds StatisticsSPECULATORSCOMMERCIALSSMALL TRADERS
– Percent of Open Interest Longs:7.582.09.1
– Percent of Open Interest Shorts:19.269.99.6
– Net Position:-228,618238,681-10,063
– Gross Longs:147,3881,610,288179,361
– Gross Shorts:376,0061,371,607189,424
– Long to Short Ratio:0.4 to 11.2 to 10.9 to 1
NET POSITION TREND:
– Strength Index Score (3 Year Range Pct):85.433.54.7
– Strength Index Reading (3 Year Range):Bullish-ExtremeBearishBearish-Extreme
NET POSITION MOVEMENT INDEX:
– 6-Week Change in Strength Index:-0.13.2-8.4


Article By InvestMacroReceive our weekly COT Newsletter

*COT Report: The COT data, released weekly to the public each Friday, is updated through the most recent Tuesday (data is 3 days old) and shows a quick view of how large speculators or non-commercials (for-profit traders) were positioned in the futures markets.

The CFTC categorizes trader positions according to commercial hedgers (traders who use futures contracts for hedging as part of the business), non-commercials (large traders who speculate to realize trading profits) and nonreportable traders (usually small traders/speculators) as well as their open interest (contracts open in the market at time of reporting). See CFTC criteria here.

COT Soft Commodities Charts: Weekly Speculator Bets led by Corn & Sugar

By InvestMacro

Speculators OI Softs
Here are the latest charts and statistics for the Commitment of Traders (COT) reports data published by the Commodities Futures Trading Commission (CFTC).

The latest COT data is updated through Tuesday July 15th and shows a quick view of how large traders (for-profit speculators and commercial entities) were positioned in the futures markets.

Weekly Speculator Changes led by Corn & Sugar

Speculators Nets Softs
The COT soft commodities markets speculator bets were overall higher this week as seven out of the eleven softs markets we cover had higher positioning while the other four markets had lower speculator contracts.

Leading the gains for the softs markets was Corn (12,305 contracts) with Sugar (8,352 contracts), Soybean Meal (5,859 contracts), Soybean Oil (4,963 contracts), Cotton (4,662 contracts), Live Cattle (3,123 contracts) and Coffee (2,212 contracts) also showing positive weeks.

The markets with the declines in speculator bets this week were Soybeans (-22,774 contracts), Lean Hogs (-8,097 contracts), Wheat (-3,681 contracts) and with Cocoa (-761 contracts) also seeing lower bets on the week.

The biggest positive mover this week was Corn, with a gain of over 12,000 contracts. Although Corn saw higher bets this week, overall the position has been in an extreme bearish level compared to the last three years. The corn price in the markets has been on the decline and has been touching the lowest levels in a year.

On the downside, Soybeans saw the biggest retreat this week, with a decrease of over 20,000 contracts. Soybean prices have also been lower over the last couple of years, and in fact, are almost 40% off the highs from 2022.


Soft Commodities Data:

Speculators Table Softs
Legend: Weekly Speculators Change | Speculators Current Net Position | Speculators Strength Score compared to last 3-Years (0-100 range)


Strength Scores led by Lean Hogs & Live Cattle

Speculators Strength Softs
COT Strength Scores (a normalized measure of Speculator positions over a 3-Year range, from 0 to 100 where above 80 is Extreme-Bullish and below 20 is Extreme-Bearish) showed that Lean Hogs (90 percent) and Live Cattle (81 percent) lead the softs markets this week. Soybean Oil (77 percent), Coffee (56 percent) and Soybeans (54 percent) come in as the next highest in the weekly strength scores.

On the downside, Soybean Meal (3 percent), Sugar (4 percent) and Corn (19 percent) come in at the lowest strength levels currently and are in Extreme-Bearish territory (below 20 percent).

Strength Statistics:
Corn (18.6 percent) vs Corn previous week (16.9 percent)
Sugar (4.3 percent) vs Sugar previous week (1.9 percent)
Coffee (56.0 percent) vs Coffee previous week (53.9 percent)
Soybeans (54.4 percent) vs Soybeans previous week (60.3 percent)
Soybean Oil (77.3 percent) vs Soybean Oil previous week (74.5 percent)
Soybean Meal (2.7 percent) vs Soybean Meal previous week (0.5 percent)
Live Cattle (81.0 percent) vs Live Cattle previous week (77.9 percent)
Lean Hogs (89.8 percent) vs Lean Hogs previous week (95.9 percent)
Cotton (22.5 percent) vs Cotton previous week (19.7 percent)
Cocoa (22.0 percent) vs Cocoa previous week (22.8 percent)
Wheat (42.5 percent) vs Wheat previous week (45.5 percent)


Wheat & Soybean Oil top the 6-Week Strength Trends

Speculators Trend Softs
COT Strength Score Trends (or move index, calculates the 6-week changes in strength scores) showed that Wheat (26 percent) and Soybean Oil (12 percent) lead the past six weeks trends for soft commodities. Lean Hogs (12 percent) and Cotton (4 percent) are the next highest positive movers in the latest trends data.

Sugar (-14 percent) leads the downside trend scores currently with Soybeans (-11 percent), Soybean Meal (-10 percent) and Cocoa (-8 percent) following next with lower trend scores.

Strength Trend Statistics:
Corn (-6.6 percent) vs Corn previous week (-16.5 percent)
Sugar (-13.9 percent) vs Sugar previous week (-23.1 percent)
Coffee (-3.8 percent) vs Coffee previous week (-11.2 percent)
Soybeans (-11.4 percent) vs Soybeans previous week (-8.8 percent)
Soybean Oil (12.3 percent) vs Soybean Oil previous week (-1.1 percent)
Soybean Meal (-9.6 percent) vs Soybean Meal previous week (-13.8 percent)
Live Cattle (1.2 percent) vs Live Cattle previous week (0.7 percent)
Lean Hogs (12.3 percent) vs Lean Hogs previous week (24.3 percent)
Cotton (4.4 percent) vs Cotton previous week (-0.2 percent)
Cocoa (-7.8 percent) vs Cocoa previous week (-8.7 percent)
Wheat (25.5 percent) vs Wheat previous week (29.8 percent)


Individual Soft Commodities Markets:

CORN Futures:

CORN Futures COT ChartThe CORN large speculator standing this week recorded a net position of -129,457 contracts in the data reported through Tuesday. This was a weekly rise of 12,305 contracts from the previous week which had a total of -141,762 net contracts.

This week’s current strength score (the trader positioning range over the past three years, measured from 0 to 100) shows the speculators are currently Bearish-Extreme with a score of 18.6 percent. The commercials are Bullish-Extreme with a score of 81.0 percent and the small traders (not shown in chart) are Bullish with a score of 74.2 percent.

Price Trend-Following Model: Strong Downtrend

Our weekly trend-following model classifies the current market price position as: Strong Downtrend.

CORN Futures StatisticsSPECULATORSCOMMERCIALSSMALL TRADERS
– Percent of Open Interest Longs:20.044.29.6
– Percent of Open Interest Shorts:28.833.511.5
– Net Position:-129,457157,267-27,810
– Gross Longs:293,548649,577141,147
– Gross Shorts:423,005492,310168,957
– Long to Short Ratio:0.7 to 11.3 to 10.8 to 1
NET POSITION TREND:
– Strength Index Score (3 Year Range Pct):18.681.074.2
– Strength Index Reading (3 Year Range):Bearish-ExtremeBullish-ExtremeBullish
NET POSITION MOVEMENT INDEX:
– 6-Week Change in Strength Index:-6.68.0-4.8


SUGAR Futures:

SUGAR Futures COT ChartThe SUGAR large speculator standing this week recorded a net position of -52,099 contracts in the data reported through Tuesday. This was a weekly lift of 8,352 contracts from the previous week which had a total of -60,451 net contracts.

This week’s current strength score (the trader positioning range over the past three years, measured from 0 to 100) shows the speculators are currently Bearish-Extreme with a score of 4.3 percent. The commercials are Bullish-Extreme with a score of 97.4 percent and the small traders (not shown in chart) are Bearish-Extreme with a score of 2.4 percent.

Price Trend-Following Model: Downtrend

Our weekly trend-following model classifies the current market price position as: Downtrend.

SUGAR Futures StatisticsSPECULATORSCOMMERCIALSSMALL TRADERS
– Percent of Open Interest Longs:23.651.87.2
– Percent of Open Interest Shorts:29.644.28.7
– Net Position:-52,09965,399-13,300
– Gross Longs:204,179448,59062,405
– Gross Shorts:256,278383,19175,705
– Long to Short Ratio:0.8 to 11.2 to 10.8 to 1
NET POSITION TREND:
– Strength Index Score (3 Year Range Pct):4.397.42.4
– Strength Index Reading (3 Year Range):Bearish-ExtremeBullish-ExtremeBearish-Extreme
NET POSITION MOVEMENT INDEX:
– 6-Week Change in Strength Index:-13.913.3-8.9


COFFEE Futures:

COFFEE Futures COT ChartThe COFFEE large speculator standing this week recorded a net position of 31,133 contracts in the data reported through Tuesday. This was a weekly lift of 2,212 contracts from the previous week which had a total of 28,921 net contracts.

This week’s current strength score (the trader positioning range over the past three years, measured from 0 to 100) shows the speculators are currently Bullish with a score of 56.0 percent. The commercials are Bearish with a score of 46.4 percent and the small traders (not shown in chart) are Bearish with a score of 31.9 percent.

Price Trend-Following Model: Strong Downtrend

Our weekly trend-following model classifies the current market price position as: Strong Downtrend.

COFFEE Futures StatisticsSPECULATORSCOMMERCIALSSMALL TRADERS
– Percent of Open Interest Longs:32.541.54.6
– Percent of Open Interest Shorts:11.862.74.0
– Net Position:31,133-31,971838
– Gross Longs:48,94062,4726,921
– Gross Shorts:17,80794,4436,083
– Long to Short Ratio:2.7 to 10.7 to 11.1 to 1
NET POSITION TREND:
– Strength Index Score (3 Year Range Pct):56.046.431.9
– Strength Index Reading (3 Year Range):BullishBearishBearish
NET POSITION MOVEMENT INDEX:
– 6-Week Change in Strength Index:-3.84.9-20.5


SOYBEANS Futures:

SOYBEANS Futures COT ChartThe SOYBEANS large speculator standing this week recorded a net position of 15,294 contracts in the data reported through Tuesday. This was a weekly decrease of -22,774 contracts from the previous week which had a total of 38,068 net contracts.

This week’s current strength score (the trader positioning range over the past three years, measured from 0 to 100) shows the speculators are currently Bullish with a score of 54.4 percent. The commercials are Bearish with a score of 44.0 percent and the small traders (not shown in chart) are Bullish with a score of 72.7 percent.

Price Trend-Following Model: Uptrend

Our weekly trend-following model classifies the current market price position as: Uptrend.

SOYBEANS Futures StatisticsSPECULATORSCOMMERCIALSSMALL TRADERS
– Percent of Open Interest Longs:21.251.75.4
– Percent of Open Interest Shorts:19.551.77.1
– Net Position:15,294-82-15,212
– Gross Longs:186,780455,50747,563
– Gross Shorts:171,486455,58962,775
– Long to Short Ratio:1.1 to 11.0 to 10.8 to 1
NET POSITION TREND:
– Strength Index Score (3 Year Range Pct):54.444.072.7
– Strength Index Reading (3 Year Range):BullishBearishBullish
NET POSITION MOVEMENT INDEX:
– 6-Week Change in Strength Index:-11.412.00.9


SOYBEAN OIL Futures:

SOYBEAN OIL Futures COT ChartThe SOYBEAN OIL large speculator standing this week recorded a net position of 64,125 contracts in the data reported through Tuesday. This was a weekly lift of 4,963 contracts from the previous week which had a total of 59,162 net contracts.

This week’s current strength score (the trader positioning range over the past three years, measured from 0 to 100) shows the speculators are currently Bullish with a score of 77.3 percent. The commercials are Bearish with a score of 22.6 percent and the small traders (not shown in chart) are Bullish-Extreme with a score of 83.6 percent.

Price Trend-Following Model: Strong Uptrend

Our weekly trend-following model classifies the current market price position as: Strong Uptrend.

SOYBEAN OIL Futures StatisticsSPECULATORSCOMMERCIALSSMALL TRADERS
– Percent of Open Interest Longs:22.045.36.4
– Percent of Open Interest Shorts:11.657.74.4
– Net Position:64,125-76,48112,356
– Gross Longs:135,739279,00139,591
– Gross Shorts:71,614355,48227,235
– Long to Short Ratio:1.9 to 10.8 to 11.5 to 1
NET POSITION TREND:
– Strength Index Score (3 Year Range Pct):77.322.683.6
– Strength Index Reading (3 Year Range):BullishBearishBullish-Extreme
NET POSITION MOVEMENT INDEX:
– 6-Week Change in Strength Index:12.3-14.634.0


SOYBEAN MEAL Futures:

SOYBEAN MEAL Futures COT ChartThe SOYBEAN MEAL large speculator standing this week recorded a net position of -79,742 contracts in the data reported through Tuesday. This was a weekly advance of 5,859 contracts from the previous week which had a total of -85,601 net contracts.

This week’s current strength score (the trader positioning range over the past three years, measured from 0 to 100) shows the speculators are currently Bearish-Extreme with a score of 2.7 percent. The commercials are Bullish-Extreme with a score of 97.5 percent and the small traders (not shown in chart) are Bullish with a score of 77.8 percent.

Price Trend-Following Model: Strong Downtrend

Our weekly trend-following model classifies the current market price position as: Strong Downtrend.

SOYBEAN MEAL Futures StatisticsSPECULATORSCOMMERCIALSSMALL TRADERS
– Percent of Open Interest Longs:18.950.48.8
– Percent of Open Interest Shorts:30.742.15.3
– Net Position:-79,74255,78723,955
– Gross Longs:128,060340,58959,734
– Gross Shorts:207,802284,80235,779
– Long to Short Ratio:0.6 to 11.2 to 11.7 to 1
NET POSITION TREND:
– Strength Index Score (3 Year Range Pct):2.797.577.8
– Strength Index Reading (3 Year Range):Bearish-ExtremeBullish-ExtremeBullish
NET POSITION MOVEMENT INDEX:
– 6-Week Change in Strength Index:-9.69.8-0.6


LIVE CATTLE Futures:

LIVE CATTLE Futures COT ChartThe LIVE CATTLE large speculator standing this week recorded a net position of 104,445 contracts in the data reported through Tuesday. This was a weekly increase of 3,123 contracts from the previous week which had a total of 101,322 net contracts.

This week’s current strength score (the trader positioning range over the past three years, measured from 0 to 100) shows the speculators are currently Bullish-Extreme with a score of 81.0 percent. The commercials are Bearish with a score of 22.6 percent and the small traders (not shown in chart) are Bearish-Extreme with a score of 17.9 percent.

Price Trend-Following Model: Strong Uptrend

Our weekly trend-following model classifies the current market price position as: Strong Uptrend.

LIVE CATTLE Futures StatisticsSPECULATORSCOMMERCIALSSMALL TRADERS
– Percent of Open Interest Longs:49.328.97.7
– Percent of Open Interest Shorts:22.949.613.4
– Net Position:104,445-81,860-22,585
– Gross Longs:194,938114,27330,461
– Gross Shorts:90,493196,13353,046
– Long to Short Ratio:2.2 to 10.6 to 10.6 to 1
NET POSITION TREND:
– Strength Index Score (3 Year Range Pct):81.022.617.9
– Strength Index Reading (3 Year Range):Bullish-ExtremeBearishBearish-Extreme
NET POSITION MOVEMENT INDEX:
– 6-Week Change in Strength Index:1.21.6-8.3


LEAN HOGS Futures:

LEAN HOGS Futures COT ChartThe LEAN HOGS large speculator standing this week recorded a net position of 82,803 contracts in the data reported through Tuesday. This was a weekly decrease of -8,097 contracts from the previous week which had a total of 90,900 net contracts.

This week’s current strength score (the trader positioning range over the past three years, measured from 0 to 100) shows the speculators are currently Bullish-Extreme with a score of 89.8 percent. The commercials are Bearish-Extreme with a score of 9.9 percent and the small traders (not shown in chart) are Bearish with a score of 42.7 percent.

Price Trend-Following Model: Uptrend

Our weekly trend-following model classifies the current market price position as: Uptrend.

LEAN HOGS Futures StatisticsSPECULATORSCOMMERCIALSSMALL TRADERS
– Percent of Open Interest Longs:44.928.16.0
– Percent of Open Interest Shorts:21.350.07.6
– Net Position:82,803-77,017-5,786
– Gross Longs:157,62398,66921,044
– Gross Shorts:74,820175,68626,830
– Long to Short Ratio:2.1 to 10.6 to 10.8 to 1
NET POSITION TREND:
– Strength Index Score (3 Year Range Pct):89.89.942.7
– Strength Index Reading (3 Year Range):Bullish-ExtremeBearish-ExtremeBearish
NET POSITION MOVEMENT INDEX:
– 6-Week Change in Strength Index:12.3-11.8-9.7


COTTON Futures:

COTTON Futures COT ChartThe COTTON large speculator standing this week recorded a net position of -25,083 contracts in the data reported through Tuesday. This was a weekly lift of 4,662 contracts from the previous week which had a total of -29,745 net contracts.

This week’s current strength score (the trader positioning range over the past three years, measured from 0 to 100) shows the speculators are currently Bearish with a score of 22.5 percent. The commercials are Bullish with a score of 78.9 percent and the small traders (not shown in chart) are Bearish with a score of 24.0 percent.

Price Trend-Following Model: Weak Downtrend

Our weekly trend-following model classifies the current market price position as: Weak Downtrend.

COTTON Futures StatisticsSPECULATORSCOMMERCIALSSMALL TRADERS
– Percent of Open Interest Longs:30.247.55.0
– Percent of Open Interest Shorts:42.035.74.9
– Net Position:-25,08324,866217
– Gross Longs:63,934100,51510,668
– Gross Shorts:89,01775,64910,451
– Long to Short Ratio:0.7 to 11.3 to 11.0 to 1
NET POSITION TREND:
– Strength Index Score (3 Year Range Pct):22.578.924.0
– Strength Index Reading (3 Year Range):BearishBullishBearish
NET POSITION MOVEMENT INDEX:
– 6-Week Change in Strength Index:4.4-4.910.7


COCOA Futures:

COCOA Futures COT ChartThe COCOA large speculator standing this week recorded a net position of 11,823 contracts in the data reported through Tuesday. This was a weekly fall of -761 contracts from the previous week which had a total of 12,584 net contracts.

This week’s current strength score (the trader positioning range over the past three years, measured from 0 to 100) shows the speculators are currently Bearish with a score of 22.0 percent. The commercials are Bullish with a score of 77.6 percent and the small traders (not shown in chart) are Bullish with a score of 62.1 percent.

Price Trend-Following Model: Strong Uptrend

Our weekly trend-following model classifies the current market price position as: Strong Uptrend.

COCOA Futures StatisticsSPECULATORSCOMMERCIALSSMALL TRADERS
– Percent of Open Interest Longs:27.541.211.5
– Percent of Open Interest Shorts:15.157.97.1
– Net Position:11,823-16,0214,198
– Gross Longs:26,36039,58711,035
– Gross Shorts:14,53755,6086,837
– Long to Short Ratio:1.8 to 10.7 to 11.6 to 1
NET POSITION TREND:
– Strength Index Score (3 Year Range Pct):22.077.662.1
– Strength Index Reading (3 Year Range):BearishBullishBullish
NET POSITION MOVEMENT INDEX:
– 6-Week Change in Strength Index:-7.89.8-21.2


WHEAT Futures:

WHEAT Futures COT ChartThe WHEAT large speculator standing this week recorded a net position of -65,521 contracts in the data reported through Tuesday. This was a weekly decrease of -3,681 contracts from the previous week which had a total of -61,840 net contracts.

This week’s current strength score (the trader positioning range over the past three years, measured from 0 to 100) shows the speculators are currently Bearish with a score of 42.5 percent. The commercials are Bullish with a score of 62.6 percent and the small traders (not shown in chart) are Bearish with a score of 25.5 percent.

Price Trend-Following Model: Downtrend

Our weekly trend-following model classifies the current market price position as: Downtrend.

WHEAT Futures StatisticsSPECULATORSCOMMERCIALSSMALL TRADERS
– Percent of Open Interest Longs:28.537.57.4
– Percent of Open Interest Shorts:44.320.28.7
– Net Position:-65,52171,099-5,578
– Gross Longs:117,724154,77330,534
– Gross Shorts:183,24583,67436,112
– Long to Short Ratio:0.6 to 11.8 to 10.8 to 1
NET POSITION TREND:
– Strength Index Score (3 Year Range Pct):42.562.625.5
– Strength Index Reading (3 Year Range):BearishBullishBearish
NET POSITION MOVEMENT INDEX:
– 6-Week Change in Strength Index:25.5-22.3-38.2


Article By InvestMacroReceive our weekly COT Newsletter

*COT Report: The COT data, released weekly to the public each Friday, is updated through the most recent Tuesday (data is 3 days old) and shows a quick view of how large speculators or non-commercials (for-profit traders) were positioned in the futures markets.

The CFTC categorizes trader positions according to commercial hedgers (traders who use futures contracts for hedging as part of the business), non-commercials (large traders who speculate to realize trading profits) and nonreportable traders (usually small traders/speculators) as well as their open interest (contracts open in the market at time of reporting). See CFTC criteria here.

The US has passed a law on stablecoins. Escalating tensions in the Middle East are once again supporting oil prices

By JustMarkets 

At the end of Thursday, the Dow Jones (US30) Index rose by 0.52%. The S&P 500 (US500) Index rose by 0.54%. The Nasdaq (US100) Technology Index closed higher by 0.75%. The US stocks rose on Thursday as strong earnings and economic data helped major indices reach new record highs. The US retail sales rose by 0.6% in June, exceeding expectations and underscoring the resilience of consumer spending despite ongoing tariff issues. Initial jobless claims fell to 221,000, the lowest level in three months, bolstering confidence in the strength of the labor market. Shares of United Airlines and PepsiCo rose by 3.1% and 7.4%, respectively. TSMC shares added 3.9% on record profits, boosting chipmakers including Nvidia (+0.9%) and Marvell (+1.6%) and lifting sentiment across the chip sector ahead of Netflix’s quarterly results, due to be released after the close.

The Canadian dollar weakened to 1.37 per US dollar, its lowest level since early June. The broad-based recovery of the US dollar, driven by rising US retail sales, unexpectedly low weekly jobless claims, and renewed expectations that the Federal Reserve will hold rates longer, put pressure on the CAD.

On Friday, Bitcoin rose above $120,000, just shy of the record high reached earlier in the week, as markets reacted to the passage of the first major digital assets law in the US. The House of Representatives approved the bill on Thursday after the Senate voted in favor of it earlier, and President Donald Trump is expected to sign it later in the day. The legislation establishes a regulatory framework for stablecoins — digital tokens backed by assets such as the US dollar — marking a key milestone after years of lobbying by the industry. Over the past year, Bitcoin has risen nearly 30% thanks to optimism about regulatory progress and growing institutional demand through ETFs.

European stock markets were mostly higher yesterday. Germany’s DAX (DE40) rose by 1.51%, France’s CAC 40 (FR40) closed up 1.29%, the Spanish IBEX35 (ES35) added 0.78%, and the British FTSE 100 (UK100) closed positive 0.52%.

European stocks closed sharply higher on Thursday, erasing the losses of the last three sessions, as markets assessed a number of key corporate indicators and revised their outlook for European trade. Consumer price inflation in the Eurozone in June 2025 was confirmed at 2% year-on-year, up from May’s eight-month low of 1.9% and in line with the European Central Bank’s official target. Inflation in the services sector accelerated to 3.3% from May’s three-year low of 3.2%. Meanwhile, core inflation, which excludes energy, food, alcohol, and tobacco prices, remained at 2.3%, the lowest since January 2022.

WTI oil prices rose by 1.7% to $67.5 per barrel on Thursday, ending a three-day losing streak as low inventories and renewed tensions in the Middle East supported the market. According to the latest data, US crude oil inventories fell by 3.9 million barrels last week, significantly exceeding previous expectations and signaling a reduction in supply. Meanwhile, drone attacks on oil fields in Iraqi Kurdistan led to a shutdown and reduction in production of 150,000 barrels per day. Ongoing instability in the region, including recent Israeli strikes in Syria, also heightened market concerns.

Natural gas prices (XNG/USD) in the US are holding at $3.56/MMBtu, the highest in three weeks, due to increased demand for cooling in hotter-than-usual weather. Power generators are burning more gas to meet air conditioning needs. In addition, projections show that high temperatures will continue in the lower 48 states until early August, with the peak of the summer heat expected next week.

Asian markets were mostly up on Thursday. Japan’s Nikkei 225 (JP225) rose by 0.60%, China’s FTSE China A50 (CHA50) added 0.04%, Hong Kong’s Hang Seng (HK50) lost 0.08%, and Australia’s ASX 200 (AU200) showed a positive result of 0.90%.

Malaysia’s economy grew by 4.5% year-on-year in the second quarter of 2025, slightly higher than the 4.4% growth in the previous period. The growth was driven by an acceleration in agricultural activity, which grew by 2% compared to 0.6% growth. Growth in the services sector also accelerated to 5.3% from 5%, supported by positive performance across all subsectors.

S&P 500 (US500) 6,297.36 +33.66 (+0.54%)

Dow Jones (US30) 44,484.49 +229.71 (+0.52%)

DAX (DE40) 24,370.93 +361.55 (+1.51%)

FTSE 100 (UK100) 8,972.64 +46.09 (+0.52%)

USD Index 98.65 +0.26 (+0.26%)

News feed for: 2025.07.18

  • Japan National Core Consumer Price Index at 02:30 (GMT+3);
  • German Producer Price Index (m/m) at 09:00 (GMT+3);
  • US Building Permits (m/m) at 15:30 (GMT+3);
  • US Michigan Inflation Expectations (m/m) at 17:00 (GMT+3).

By JustMarkets


This article reflects a personal opinion and should not be interpreted as an investment advice, and/or offer, and/or a persistent request for carrying out financial transactions, and/or a guarantee, and/or a forecast of future events.

Gold Ends the Week in Decline

By RoboForex Analytical Department

Gold remained below $3,340 per ounce this week, on track to close in negative territory for the first time in three weeks. The downward pressure followed stronger-than-expected US economic data, which reduced expectations of an imminent interest rate cut by the Federal Reserve.

June’s retail sales significantly outperformed forecasts, while initial jobless claims dropped to a three-month low – further evidence of the US economy’s resilience despite ongoing trade tensions.

In response, Adriana Kugler, a member of the Federal Reserve’s Board of Governors, suggested that maintaining the current interest rate in the near term would be prudent. Meanwhile, Mary Daly, President of the Federal Reserve Bank of San Francisco, still anticipates two rate cuts before year-end.

Gold continues to benefit from demand for defensive assets amid escalating trade and geopolitical risks. Former US President Donald Trump has announced plans to notify more than 150 trading partners of impending tariffs, heightening uncertainty in global trade.

Additionally, rising geopolitical tensions worldwide reinforce gold’s appeal as a hedge against instability, thereby ensuring its role as a key tool for wealth preservation.

Technical Analysis: XAU/USD

H4 Chart:

The XAU/USD pair is consolidating around $3,344 on the H4 chart, with the current range extending downward to $3,312. Today, prices have retested $3,344, and we anticipate further consolidation near this level.

  • Bullish scenario: a breakout above $3,344 could trigger an upward wave towards $3,384
  • Bearish scenario: a downward breakout may lead to a decline towards $3,235

The MACD indicator supports this outlook, with its signal line above zero and pointing firmly upward.

H1 Chart:

On the H1 chart, the market completed a decline wave to $3,310 before rebounding to $3,344, effectively returning to the consolidation range’s midpoint. Currently, trading lacks a clear directional bias, with equal potential for further gains or losses.

  • Upside potential: a breakout above $3,344 may extend gains towards $3,384
  • Downside risk: a drop below the range could see a downward wave towards $3,235

The Stochastic oscillator aligns with this view, as its signal line has risen from 20 and is now trending upward towards 80.

Conclusion

Gold faces short-term bearish pressure from robust US economic data, but long-term support persists due to trade uncertainties and geopolitical risks. Traders should monitor key technical levels for breakout opportunities in either direction.


Disclaimer

Any forecasts contained herein are based on the author’s particular opinion. This analysis may not be treated as trading advice. RoboForex bears no responsibility for trading results based on trading recommendations and reviews contained herein.

EUR/USD Under Pressure Amid Strong US Dollar Sentiment

By RoboForex Analytical Department

The EUR/USD pair has dipped back into negative territory, trading at 1.1615 as the US dollar regains ground following yesterday’s losses.

Market sentiment was initially rattled by reports suggesting Federal Reserve Chair Jerome Powell could be dismissed. Although Donald Trump later described these rumours as “unlikely”, the speculation reignited concerns over the central bank’s independence.

On the macroeconomic front, weaker-than-expected US producer inflation data added to the case for potential Fed rate cuts later this year. June’s price index remained flat, contrary to forecasts of a modest rise.

Traders now await retail sales figures, which could provide further insight into the strength of US domestic demand.

Meanwhile, trade tensions persist as Trump reaffirmed plans to maintain 25% tariffs on Japanese imports while hinting at a potential new trade deal with India. Earlier in the week, he also signalled progress in negotiations with Indonesia. These developments suggest the White House is balancing its hardline trade stance with efforts to engage Asian partners.

Technical Analysis: EUR/USD

H4 Chart:

On the H4 chart, the EUR/USD pair has formed a consolidation range following the breakdown from the growth channel at 1.1675 and has subsequently completed a downward move towards the local target of 1.1562. A correction back to the 1.1720 level has also taken place. At present, a new wave of decline is developing towards 1.1520. Technically, this scenario is confirmed by the MACD indicator, as its signal line is below zero and pointing firmly downward.

H1 Chart:

On the H1 chart, the EUR/USD pair has executed a downward impulse to 1.1610, followed by a correction to 1.1658. Today, a tight consolidation range is expected to form around 1.1620. If the pair breaks lower from this range, a move towards 1.1585 becomes likely, with the potential for further downside continuation to 1.1520. Technically, this scenario is confirmed by the Stochastic oscillator: its signal line lies below 50 and is heading sharply lower towards 20.

Conclusion

The EUR/USD remains under pressure amid dollar strength, with technical indicators supporting further downside potential. Market focus now shifts to upcoming US retail sales data and evolving trade dynamics.


Disclaimer

Any forecasts contained herein are based on the author’s particular opinion. This analysis may not be treated as trading advice. RoboForex bears no responsibility for trading results based on trading recommendations and reviews contained herein.

Trump wants to fire Jerome Powell again. The RBA is likely to cut rates at its next meeting

By JustMarkets 

At the end of Wednesday, the Dow Jones (US30) Index rose by 0.53%. The S&P 500 (US500) Index rose by 0.32%. The Nasdaq (US100) Technology Index closed higher by 0.25%. The US stocks rebounded from session lows and closed higher on Wednesday after President Trump said he had no plans to fire Fed Chairman Jerome Powell, easing concerns sparked by earlier reports that he was considering taking action. Markets initially fell on reports that Trump was considering Powell’s resignation, exacerbating investor concerns about persistent inflation and ongoing trade tensions. The June Producer Price Index, which remained unchanged, brought some relief after Tuesday’s Consumer Price Index came in higher than expected and showed the fastest annual inflation since February. On the corporate front, Bank of America fell by 0.3% after earnings came in below expectations, while Morgan Stanley declined by 1.3% despite solid profits. Meanwhile, Goldman Sachs added 1% after beating earnings expectations, and Johnson & Johnson jumped 6.2% after strong results and an upgrade to its full-year expectations.

On Thursday, Bitcoin hovered around $118,000, moving sideways after retreating from record highs earlier in the week as investors assessed developments on key digital assets regulation bills. The House of Representatives approved rules for debating cryptocurrency legislation late Wednesday, the result of intense negotiations and direct intervention by President Trump. While the procedural breakthrough signaled progress, new opposition from moderate Republicans and key committee members over the changes raised doubts about the bill’s ultimate passage. The continuing uncertainty affected sentiment as markets await a clearer direction for regulation.

European stock markets were mostly lower yesterday. The German DAX (DE40) fell by 0.21%, the French CAC 40 (FR40) closed down 0.57%, the Spanish IBEX35 (ES35) rose by 0.08%, and the British FTSE 100 (UK100) closed down 0.13%. The Frankfurt DAX Index has been falling for five consecutive trading sessions. The index is affected by ongoing trade uncertainty and weak corporate earnings of European companies. While investors were hoping for a more favorable tariff agreement than previously planned, President Trump again threatened to extend tariffs to pharmaceutical products and semiconductors, possibly as early as August 1, when his “retaliatory” tax policy expires. Volkswagen fell by 3.7%, Porsche AG lost 3%, and Mercedes-Benz Group fell by 1.9%.

WTI crude oil prices fell to $66.3 per barrel on Wednesday, marking the third consecutive day of decline. The decline was driven by renewed concerns about potential oversupply and the impact of US trade tariffs on global economic growth and fuel demand. The EIA’s weekly report showed a decline in total US crude oil inventories of 3.86 million barrels, but inventories at the Cushing, Oklahoma hub rose to their highest level since June. Traders remain concerned about the risk of oversupply as OPEC+ accelerates the return of previously cut production volumes and production in North and South America continues to grow.

On Wednesday, silver prices rose to $38 per ounce, recovering from a two-day decline as the US dollar and Treasury yields retreated from recent highs. The pullback came as investors reassessed the outlook for Federal Reserve policy and monitored changes in trade dynamics. On Tuesday, silver came under pressure after US consumer inflation data caused traders to abandon expectations of an imminent Fed rate cut.

Asian markets were mostly down on Wednesday. Japan’s Nikkei 225 (JP225) fell by 0.04%, China’s FTSE China A50 (CHA50) lost 0.31%, Hong Kong’s Hang Seng (HK50) decreased by 0.29%, and Australia’s ASX 200 (AU200) showed a negative result of 0.79%.

The Bank of Indonesia lowered its base interest rate by 25 basis points to 5.25% at its July 2025 policy meeting, in line with market expectations. This move reflects the inflation projections for 2025–2026, which remains within the target range of 2.5±1%. Annual inflation rose to 1.87% in June from 1.60% in May, slightly above expectations but still within the target range. Meanwhile, the rupiah exchange rate against the US dollar rose by 0.34% in June and remains stable in mid-July, mainly due to stabilization measures by the Bank of Indonesia. Economic growth in 2025 is expected at between 4.6% and 5.4%.

The Australian dollar weakened to below $0.650 on Thursday, reversing the previous session’s gains, as weaker-than-expected employment data reinforced expectations of an RBA rate cut in August. The Australian Bureau of Statistics reported that the unemployment rate rose to a more than three-year high of 4.3% in June, ending a five-month hold and exceeding projections of 4.1%, while employment increased by only 2,000 people, significantly below the expected increase of 20,000. Weak labor market data added to evidence of an economic slowdown, strengthening the case for policy easing. Markets now see an 89% chance of a 25 basis point rate cut at the Central Bank’s August meeting.

S&P 500 (US500) 6,263.70 +19.94 (+0.32%)

Dow Jones (US30) 44,254.78 +231.49 (+0.53%)

DAX (DE40) 24,009.38 −50.91 (−0.21%)

FTSE 100 (UK100) 8,926.55 −11.77 (−0.13%)

USD Index 98.28 −0.33 (−0.34%)

News feed for: 2025.07.17

  • Japan Trade Balance (m/m) at 02:50 (GMT+3);
  • Australia Unemployment Rate (m/m) at 04:30 (GMT+3);
  • UK Average Earnings Index (m/m) at 09:00 (GMT+3);
  • UK Claimant Count Change (m/m) at 09:00 (GMT+3);
  • UK Unemployment Rate (m/m) at 09:00 (GMT+3);
  • Eurozone Consumer Price Index (m/m) at 12:00 (GMT+3);
  • US Retail Sales (m/m) at 15:30 (GMT+3);
  • US Initial Jobless Claims (w/w) at 15:30 (GMT+3);
  • US Natural Gas Storage (w/w) at 17:30 (GMT+3).

By JustMarkets


This article reflects a personal opinion and should not be interpreted as an investment advice, and/or offer, and/or a persistent request for carrying out financial transactions, and/or a guarantee, and/or a forecast of future events.