
By RoboForex Analytical Department
Gold remained below $3,340 per ounce this week, on track to close in negative territory for the first time in three weeks. The downward pressure followed stronger-than-expected US economic data, which reduced expectations of an imminent interest rate cut by the Federal Reserve.
June’s retail sales significantly outperformed forecasts, while initial jobless claims dropped to a three-month low – further evidence of the US economy’s resilience despite ongoing trade tensions.
In response, Adriana Kugler, a member of the Federal Reserve’s Board of Governors, suggested that maintaining the current interest rate in the near term would be prudent. Meanwhile, Mary Daly, President of the Federal Reserve Bank of San Francisco, still anticipates two rate cuts before year-end.
Gold continues to benefit from demand for defensive assets amid escalating trade and geopolitical risks. Former US President Donald Trump has announced plans to notify more than 150 trading partners of impending tariffs, heightening uncertainty in global trade.
Additionally, rising geopolitical tensions worldwide reinforce gold’s appeal as a hedge against instability, thereby ensuring its role as a key tool for wealth preservation.
Free Reports:
 Get our Weekly Commitment of Traders Reports - See where the biggest traders (Hedge Funds and Commercial Hedgers) are positioned in the futures markets on a weekly basis.
 Sign Up for Our Stock Market Newsletter – Get updated on News, Charts & Rankings of Public Companies when you join our Stocks Newsletter
Technical Analysis: XAU/USD
H4 Chart:
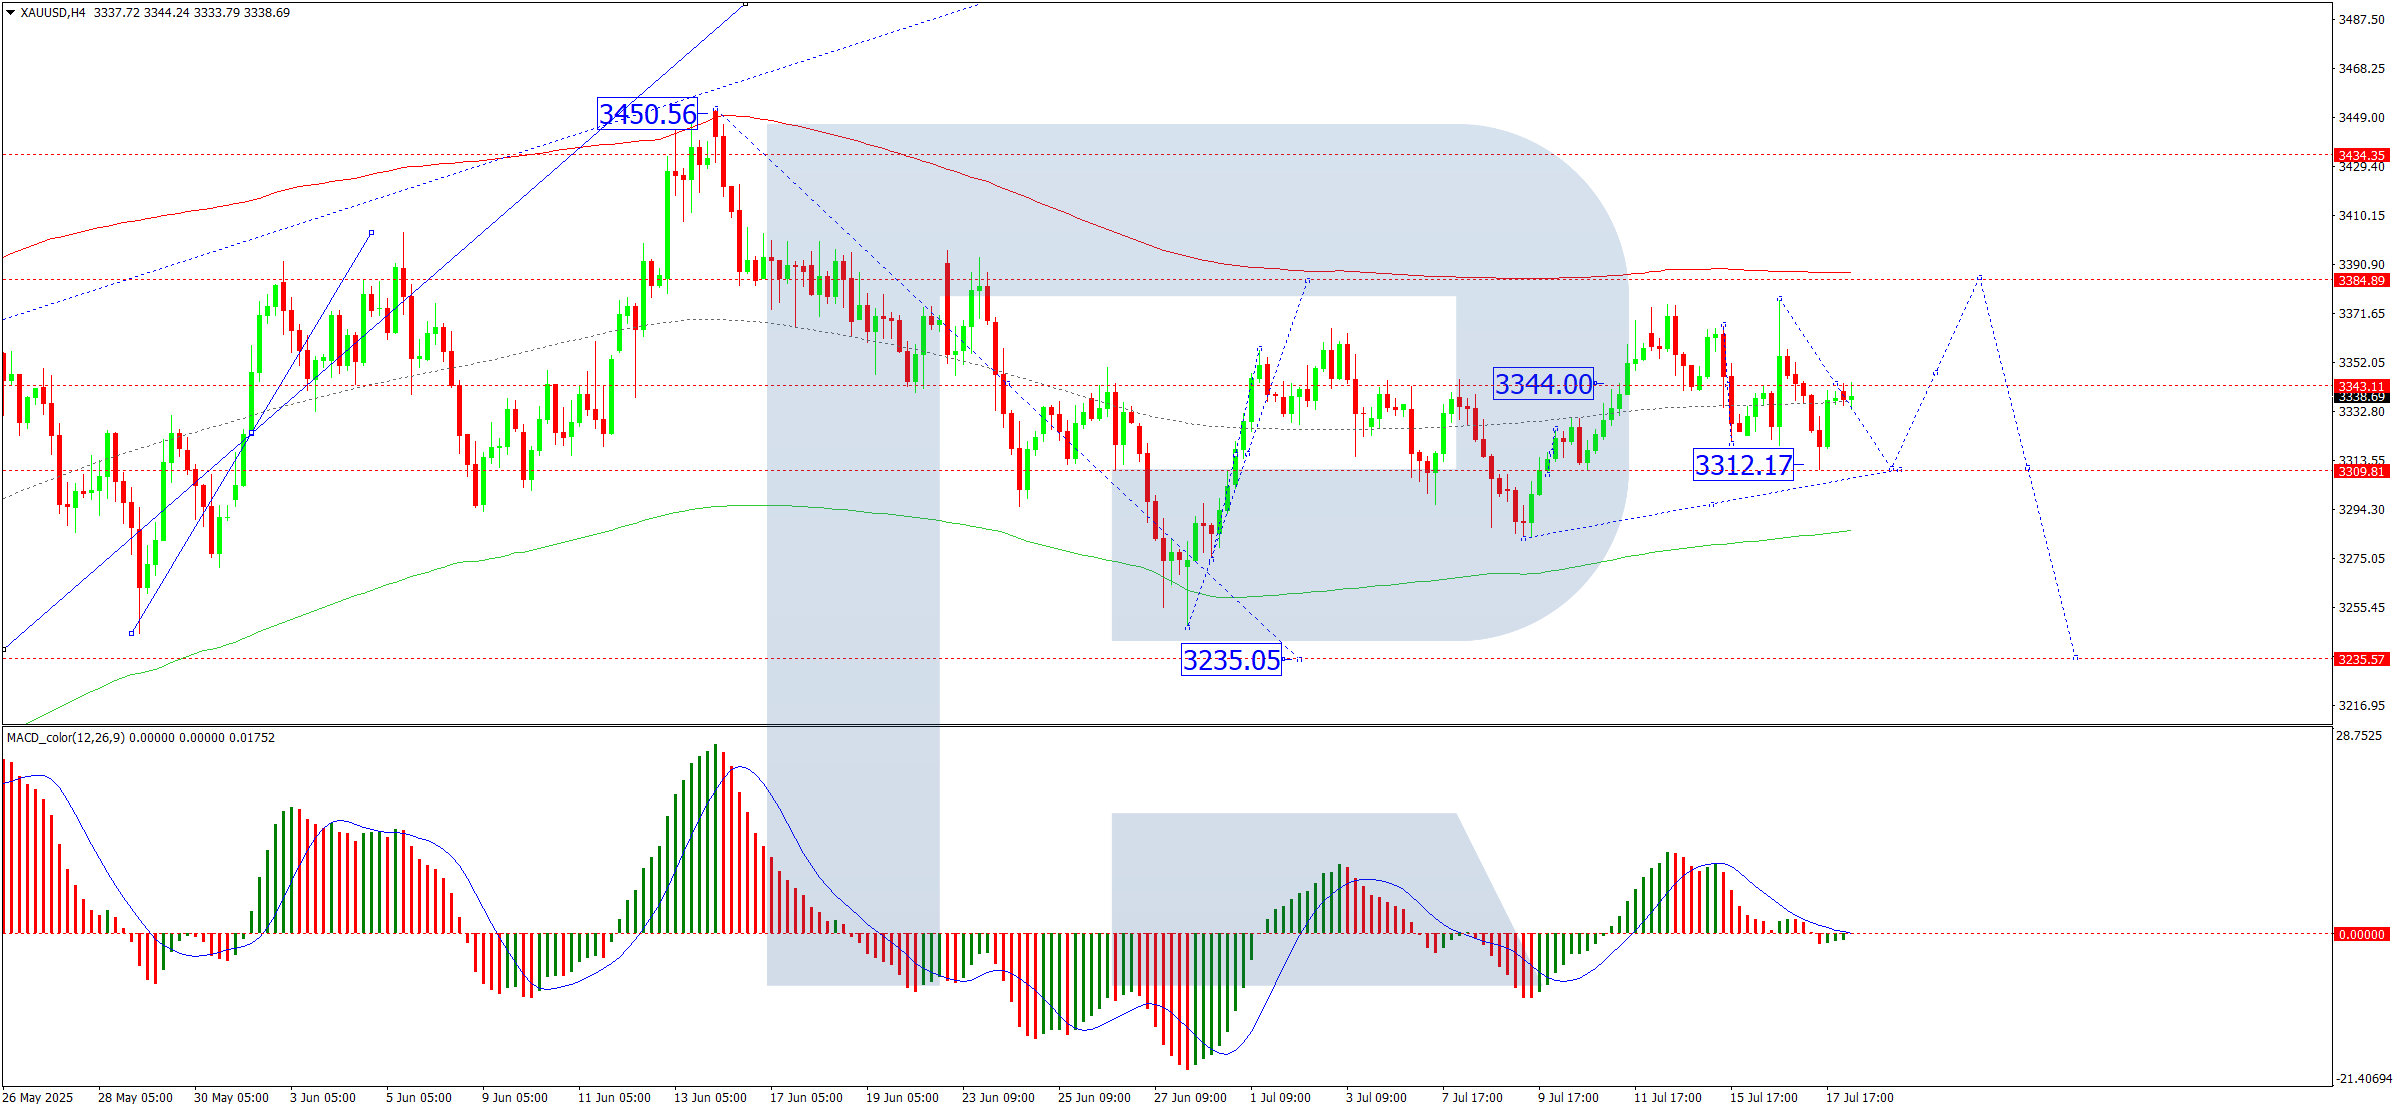
The XAU/USD pair is consolidating around $3,344 on the H4 chart, with the current range extending downward to $3,312. Today, prices have retested $3,344, and we anticipate further consolidation near this level.
- Bullish scenario: a breakout above $3,344 could trigger an upward wave towards $3,384
- Bearish scenario: a downward breakout may lead to a decline towards $3,235
The MACD indicator supports this outlook, with its signal line above zero and pointing firmly upward.
H1 Chart:

On the H1 chart, the market completed a decline wave to $3,310 before rebounding to $3,344, effectively returning to the consolidation range’s midpoint. Currently, trading lacks a clear directional bias, with equal potential for further gains or losses.
- Upside potential: a breakout above $3,344 may extend gains towards $3,384
- Downside risk: a drop below the range could see a downward wave towards $3,235
The Stochastic oscillator aligns with this view, as its signal line has risen from 20 and is now trending upward towards 80.
Conclusion
Gold faces short-term bearish pressure from robust US economic data, but long-term support persists due to trade uncertainties and geopolitical risks. Traders should monitor key technical levels for breakout opportunities in either direction.
Disclaimer
Any forecasts contained herein are based on the author’s particular opinion. This analysis may not be treated as trading advice. RoboForex bears no responsibility for trading results based on trading recommendations and reviews contained herein.

- This week will be one of the most crowded for central‑bank meetings Jul 27, 2026
- EUR/USD Ahead of a Key Week: Holding Near Lows Jul 27, 2026
- COT Metals Charts: Weekly Speculator Changes led by Copper Jul 26, 2026
- COT Bonds Charts: Speculator Bets led by SOFR 3-Months & 5-Year Bonds Jul 26, 2026
- COT Energy Charts: Weekly Speculator Bets led by WTI Crude & Natural Gas Jul 26, 2026
- COT Soft Commodities Charts: Weekly Speculator Bets led by Corn & Soybeans Jul 26, 2026
- The US introduces new import tariffs for 60 countries. Brent crude surpasses $100 per barrel Jul 24, 2026
- USD/JPY Breaks Records: Nothing Slows the Yen’s Decline Jul 24, 2026
- Oil prices reached a 6‑week high. The AUD strengthened on the back of a strong labor‑market report Jul 23, 2026
- EUR/USD Recovers as Dollar Weakens Jul 23, 2026