By InvestMacro
Here are the latest charts and statistics for the Commitment of Traders (COT) reports data published by the Commodities Futures Trading Commission (CFTC).
The latest COT data is updated through Tuesday February 17th and shows a quick view of how large traders (for-profit speculators and commercial entities) were positioned in the futures markets.
Weekly Speculator Changes led by Soybeans & Wheat
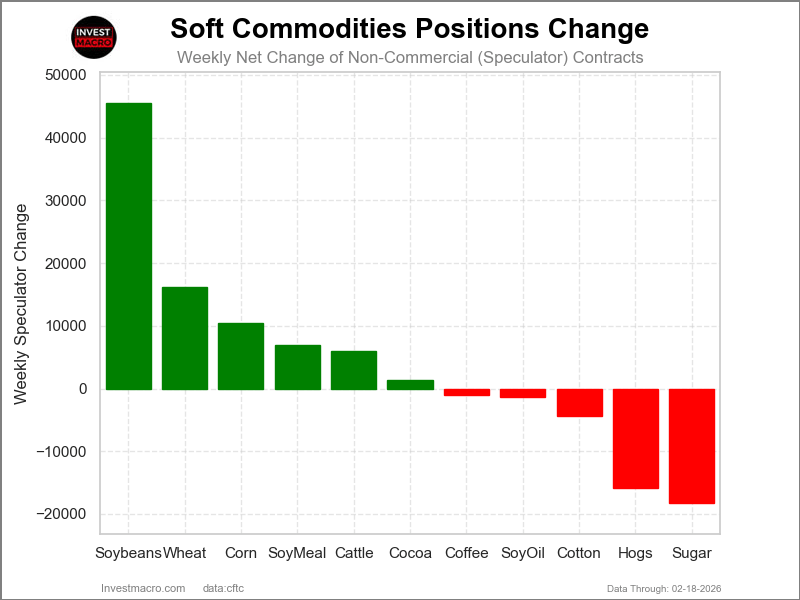
The COT soft commodities markets speculator bets were overall higher this week as six out of the eleven softs markets we cover had higher positioning while the other five markets had lower speculator contracts.
Leading the gains for the softs markets was Soybeans (45,457 contracts) with Wheat (16,200 contracts), Corn (10,495 contracts), Soybean Meal (6,974 contracts), Live Cattle (5,979 contracts) and Cocoa (1,328 contracts) also showing positive weeks.
The markets with the declines in speculator bets this week were Sugar (-18,191 contracts), Lean Hogs (-15,873 contracts), Cotton (-4,407 contracts), Soybean Oil (-1,306 contracts) and with Coffee (-1,071 contracts) also registering lower bets on the week.
Wheat leads Price Price Performance Leaders
Price performance leaders were Wheat and Soybean Oil this week. Wheat was the highest riser in the past five days with a 3.89% gain and Soybean Oil was higher by 3.25% in the same period.
Lean Hogs rose by 2.58%, Cotton was higher by 2.35%, and Sugar also got a boost by over 2% on the week. Live Cattle rose by approximately 1% and Soybean Meal saw a gain of 0.62%. Soybeans and Corn were virtually unchanged on the week.
Leading the declines on the week was Cocoa, which dropped sharply by approximately -15% and followed by Coffee which was also lower by -4.87%.
Soft Commodities Data:
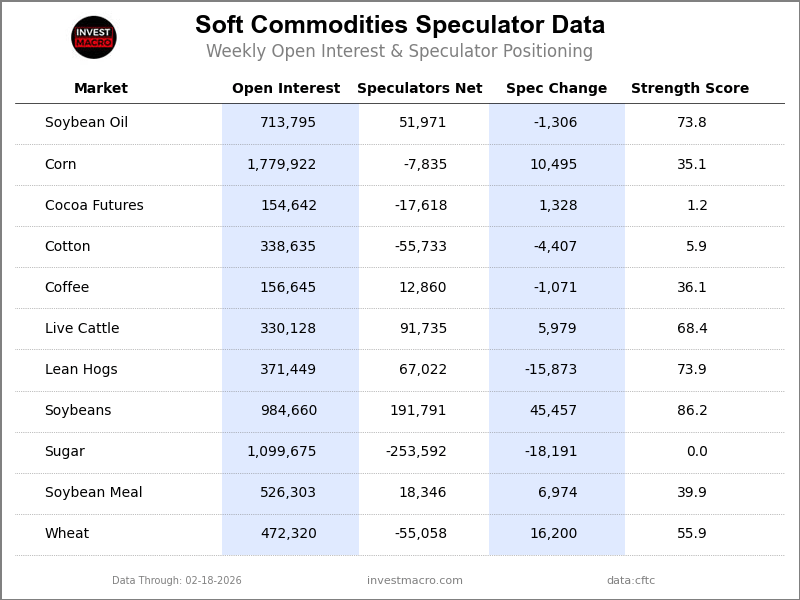
Legend: Weekly Speculators Change | Speculators Current Net Position | Speculators Strength Score compared to last 3-Years (0-100 range)
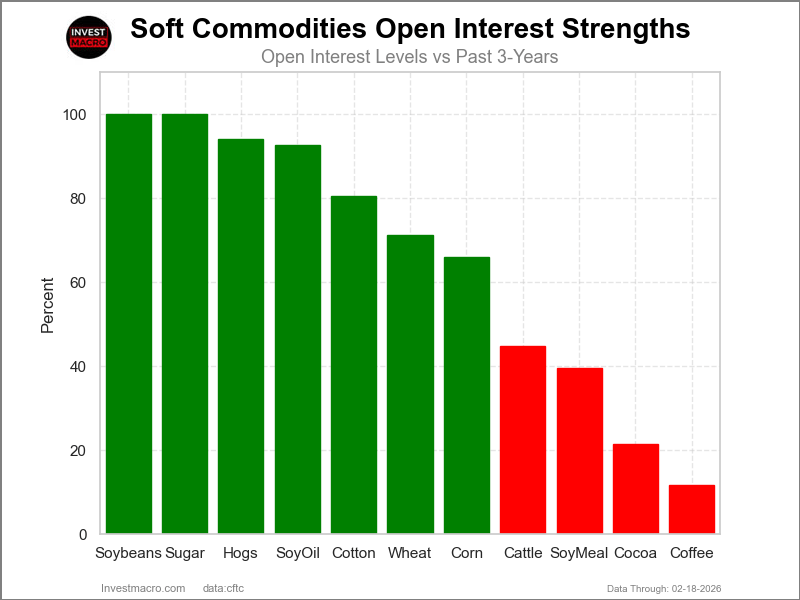
Strength Scores led by Soybeans, Lean Hogs & Soybean Oil
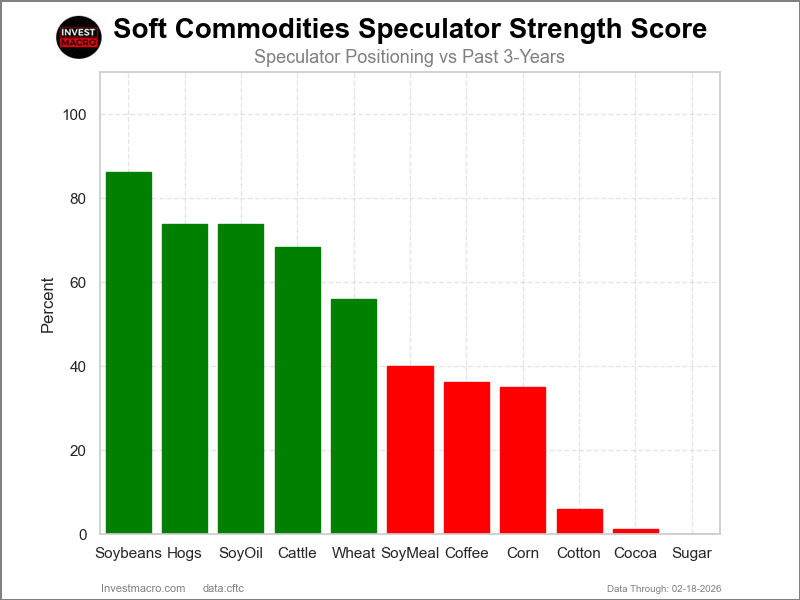
COT Strength Scores (a normalized measure of Speculator positions over a 3-Year range, from 0 to 100 where above 80 is Extreme-Bullish and below 20 is Extreme-Bearish) showed that Soybeans (86 percent), Lean Hogs (74 percent) and Soybean Oil (74 percent) lead the softs markets this week. Live Cattle (68 percent) and Wheat (56 percent) come in as the next highest in the weekly strength scores.
On the downside, Sugar (0 percent), Cocoa (1 percent) and Cotton (6 percent) come in at the lowest strength levels currently and are in Extreme-Bearish territory (below 20 percent).
Strength Statistics:
Corn (35.1 percent) vs Corn previous week (33.7 percent)
Sugar (0.0 percent) vs Sugar previous week (3.4 percent)
Coffee (36.1 percent) vs Coffee previous week (37.2 percent)
Soybeans (86.2 percent) vs Soybeans previous week (76.1 percent)
Soybean Oil (73.8 percent) vs Soybean Oil previous week (74.6 percent)
Soybean Meal (39.9 percent) vs Soybean Meal previous week (37.2 percent)
Live Cattle (68.4 percent) vs Live Cattle previous week (62.4 percent)
Lean Hogs (73.9 percent) vs Lean Hogs previous week (85.3 percent)
Cotton (5.9 percent) vs Cotton previous week (8.5 percent)
Cocoa (1.2 percent) vs Cocoa previous week (0.0 percent)
Wheat (55.9 percent) vs Wheat previous week (41.6 percent)
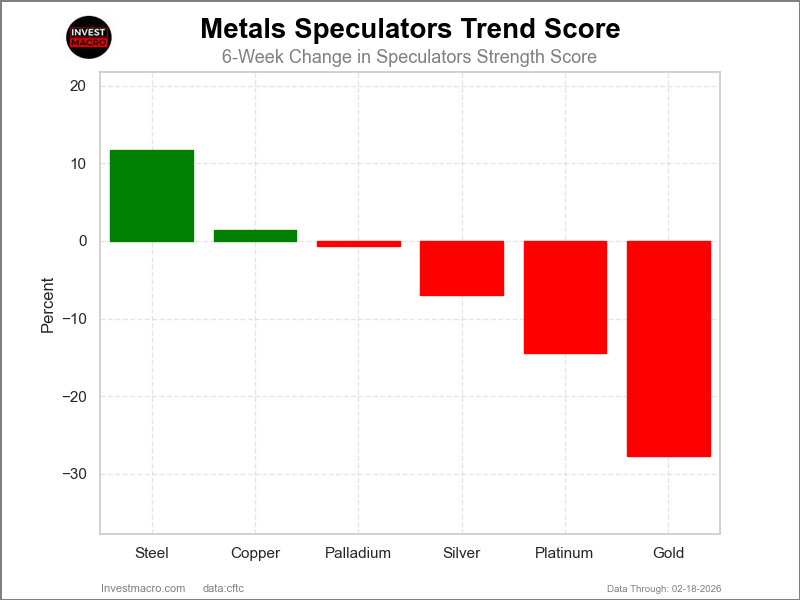
Soybean Oil & Wheat top the 6-Week Strength Trends
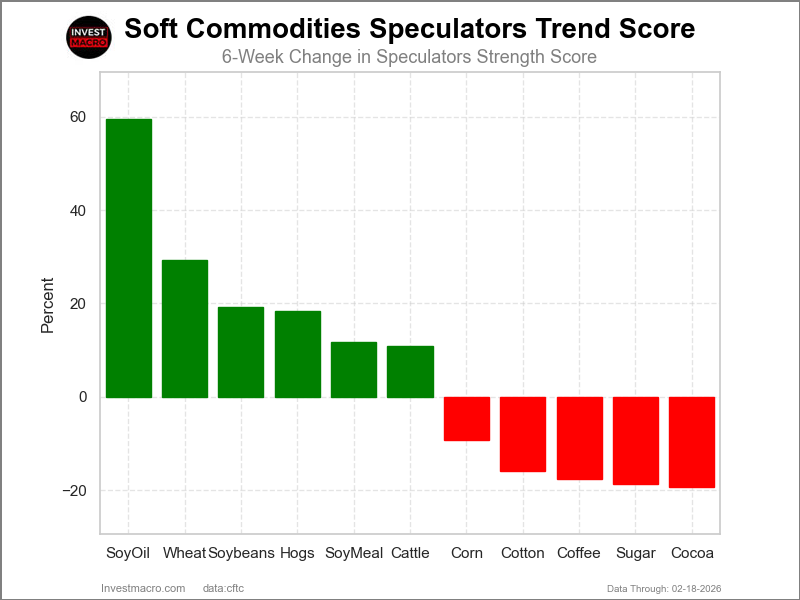
COT Strength Score Trends (or move index, calculates the 6-week changes in strength scores) showed that Soybean Oil (60 percent) and Wheat (29 percent) lead the past six weeks trends for soft commodities. Soybeans (19 percent), Lean Hogs (18 percent) and Soybean Meal (12 percent) are the next highest positive movers in the latest trends data.
Cocoa (-19 percent) leads the downside trend scores currently with Sugar (-19 percent), Coffee (-18 percent) and Cotton (-16 percent) following next with lower trend scores.
Strength Trend Statistics:
Corn (-9.2 percent) vs Corn previous week (-9.7 percent)
Sugar (-18.7 percent) vs Sugar previous week (-18.3 percent)
Coffee (-17.7 percent) vs Coffee previous week (-10.7 percent)
Soybeans (19.3 percent) vs Soybeans previous week (5.4 percent)
Soybean Oil (59.6 percent) vs Soybean Oil previous week (65.7 percent)
Soybean Meal (11.7 percent) vs Soybean Meal previous week (5.2 percent)
Live Cattle (10.9 percent) vs Live Cattle previous week (7.5 percent)
Lean Hogs (18.4 percent) vs Lean Hogs previous week (29.8 percent)
Cotton (-16.0 percent) vs Cotton previous week (-12.1 percent)
Cocoa (-19.4 percent) vs Cocoa previous week (-20.6 percent)
Wheat (29.3 percent) vs Wheat previous week (-0.2 percent)
Individual Soft Commodities Markets:
CORN Futures:
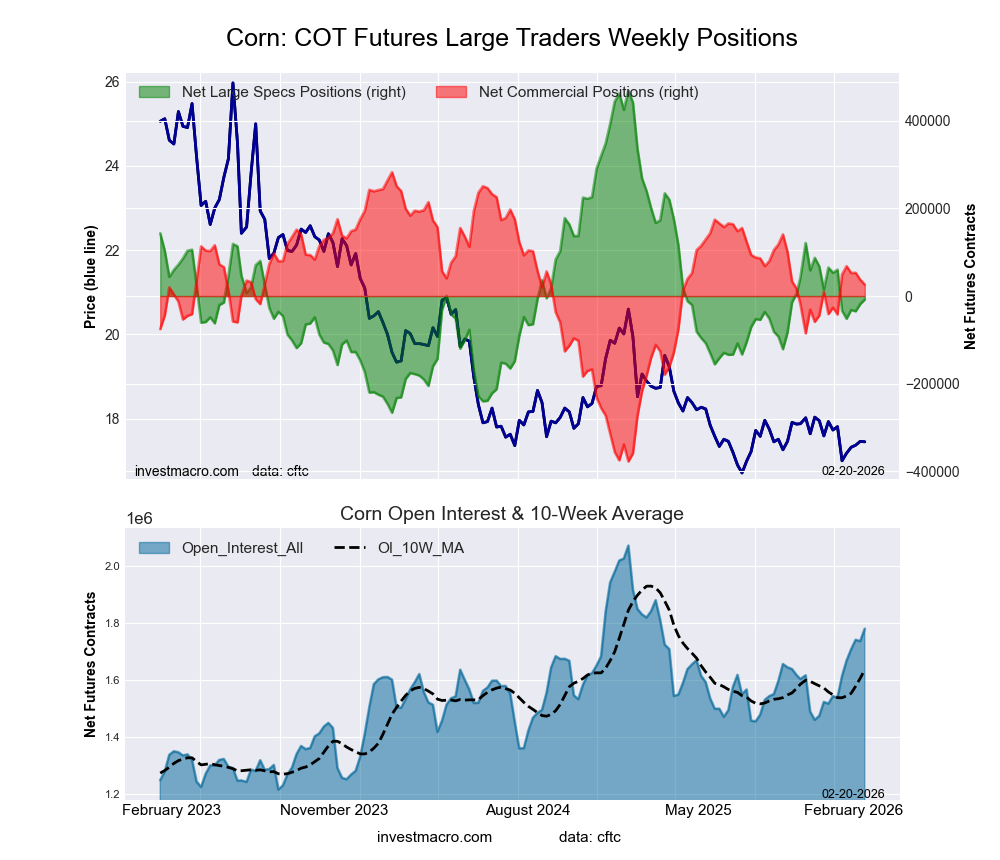 The CORN large speculator standing this week equaled a net position of -7,835 contracts in the data reported through Tuesday. This was a weekly boost of 10,495 contracts from the previous week which had a total of -18,330 net contracts.
This week’s current strength score (the trader positioning range over the past three years, measured from 0 to 100) shows the speculators are currently Bearish with a score of 35.1 percent. The commercials are Bullish with a score of 61.1 percent and the small traders (not shown in chart) are Bullish-Extreme with a score of 85.5 percent.
Price Trend-Following Model: Strong Downtrend
Our weekly trend-following model classifies the current market price position as: Strong Downtrend.
| CORN Futures Statistics | SPECULATORS | COMMERCIALS | SMALL TRADERS |
| – Percent of Open Interest Longs: | 18.9 | 46.7 | 8.2 |
| – Percent of Open Interest Shorts: | 19.4 | 45.3 | 9.3 |
| – Net Position: | -7,835 | 25,990 | -18,155 |
| – Gross Longs: | 336,717 | 831,608 | 146,498 |
| – Gross Shorts: | 344,552 | 805,618 | 164,653 |
| – Long to Short Ratio: | 1.0 to 1 | 1.0 to 1 | 0.9 to 1 |
| NET POSITION TREND: | | | |
| – Strength Index Score (3 Year Range Pct): | 35.1 | 61.1 | 85.5 |
| – Strength Index Reading (3 Year Range): | Bearish | Bullish | Bullish-Extreme |
| NET POSITION MOVEMENT INDEX: | | | |
| – 6-Week Change in Strength Index: | -9.2 | 10.3 | 0.1 |
SUGAR Futures:
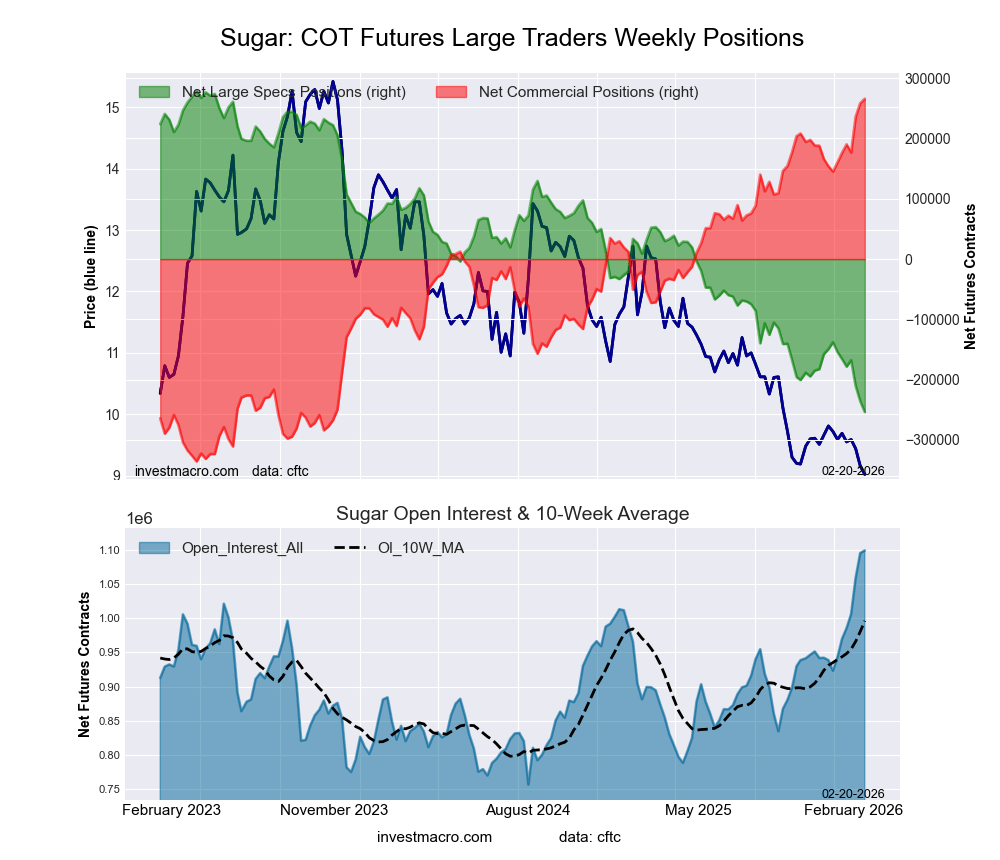 The SUGAR large speculator standing this week equaled a net position of -253,592 contracts in the data reported through Tuesday. This was a weekly reduction of -18,191 contracts from the previous week which had a total of -235,401 net contracts.
This week’s current strength score (the trader positioning range over the past three years, measured from 0 to 100) shows the speculators are currently Bearish-Extreme with a score of 0.0 percent. The commercials are Bullish-Extreme with a score of 100.0 percent and the small traders (not shown in chart) are Bearish-Extreme with a score of 16.2 percent.
Price Trend-Following Model: Strong Downtrend
Our weekly trend-following model classifies the current market price position as: Strong Downtrend.
| SUGAR Futures Statistics | SPECULATORS | COMMERCIALS | SMALL TRADERS |
| – Percent of Open Interest Longs: | 15.6 | 56.9 | 7.5 |
| – Percent of Open Interest Shorts: | 38.7 | 32.7 | 8.6 |
| – Net Position: | -253,592 | 265,824 | -12,232 |
| – Gross Longs: | 171,981 | 625,812 | 82,477 |
| – Gross Shorts: | 425,573 | 359,988 | 94,709 |
| – Long to Short Ratio: | 0.4 to 1 | 1.7 to 1 | 0.9 to 1 |
| NET POSITION TREND: | | | |
| – Strength Index Score (3 Year Range Pct): | 0.0 | 100.0 | 16.2 |
| – Strength Index Reading (3 Year Range): | Bearish-Extreme | Bullish-Extreme | Bearish-Extreme |
| NET POSITION MOVEMENT INDEX: | | | |
| – 6-Week Change in Strength Index: | -18.7 | 17.6 | -7.3 |
COFFEE Futures:
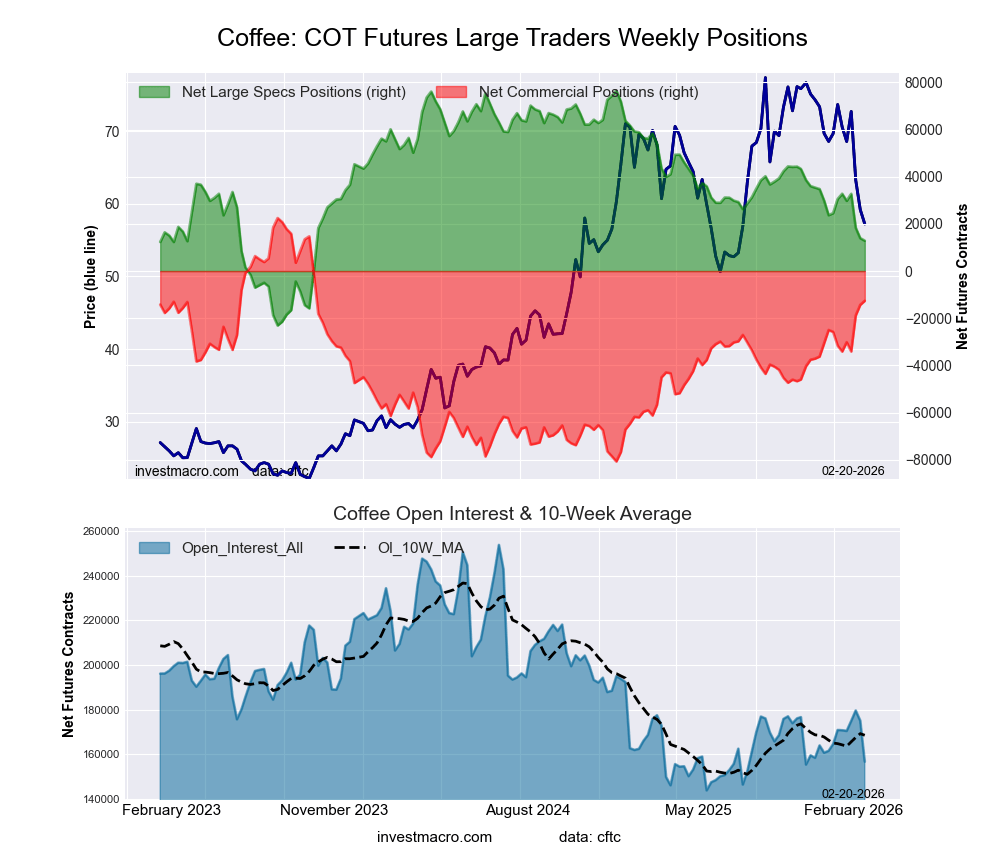 The COFFEE large speculator standing this week equaled a net position of 12,860 contracts in the data reported through Tuesday. This was a weekly reduction of -1,071 contracts from the previous week which had a total of 13,931 net contracts.
This week’s current strength score (the trader positioning range over the past three years, measured from 0 to 100) shows the speculators are currently Bearish with a score of 36.1 percent. The commercials are Bullish with a score of 66.0 percent and the small traders (not shown in chart) are Bearish-Extreme with a score of 13.5 percent.
Price Trend-Following Model: Strong Downtrend
Our weekly trend-following model classifies the current market price position as: Strong Downtrend.
| COFFEE Futures Statistics | SPECULATORS | COMMERCIALS | SMALL TRADERS |
| – Percent of Open Interest Longs: | 30.3 | 42.0 | 4.8 |
| – Percent of Open Interest Shorts: | 22.1 | 50.0 | 5.0 |
| – Net Position: | 12,860 | -12,616 | -244 |
| – Gross Longs: | 47,502 | 65,722 | 7,517 |
| – Gross Shorts: | 34,642 | 78,338 | 7,761 |
| – Long to Short Ratio: | 1.4 to 1 | 0.8 to 1 | 1.0 to 1 |
| NET POSITION TREND: | | | |
| – Strength Index Score (3 Year Range Pct): | 36.1 | 66.0 | 13.5 |
| – Strength Index Reading (3 Year Range): | Bearish | Bullish | Bearish-Extreme |
| NET POSITION MOVEMENT INDEX: | | | |
| – 6-Week Change in Strength Index: | -17.7 | 18.4 | -22.6 |
SOYBEANS Futures:
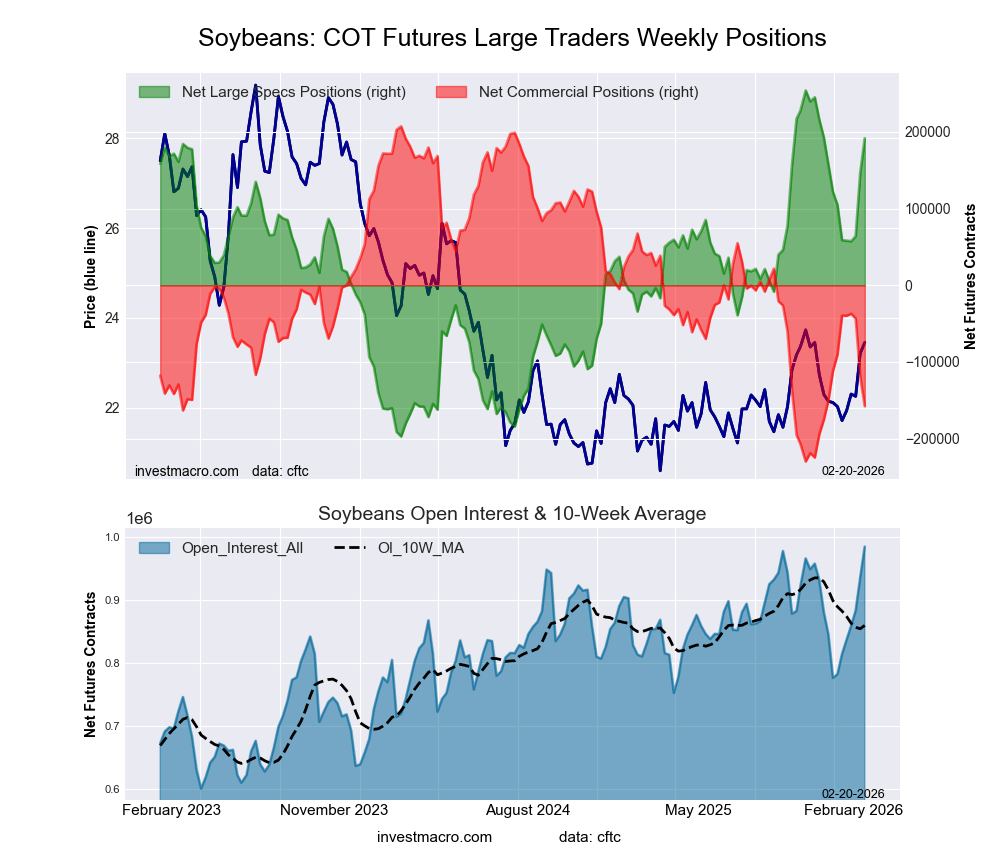 The SOYBEANS large speculator standing this week equaled a net position of 191,791 contracts in the data reported through Tuesday. This was a weekly gain of 45,457 contracts from the previous week which had a total of 146,334 net contracts.
This week’s current strength score (the trader positioning range over the past three years, measured from 0 to 100) shows the speculators are currently Bullish-Extreme with a score of 86.2 percent. The commercials are Bearish-Extreme with a score of 16.5 percent and the small traders (not shown in chart) are Bearish-Extreme with a score of 18.2 percent.
Price Trend-Following Model: Strong Uptrend
Our weekly trend-following model classifies the current market price position as: Strong Uptrend.
| SOYBEANS Futures Statistics | SPECULATORS | COMMERCIALS | SMALL TRADERS |
| – Percent of Open Interest Longs: | 27.9 | 47.1 | 5.0 |
| – Percent of Open Interest Shorts: | 8.4 | 63.1 | 8.5 |
| – Net Position: | 191,791 | -157,771 | -34,020 |
| – Gross Longs: | 274,388 | 463,652 | 49,618 |
| – Gross Shorts: | 82,597 | 621,423 | 83,638 |
| – Long to Short Ratio: | 3.3 to 1 | 0.7 to 1 | 0.6 to 1 |
| NET POSITION TREND: | | | |
| – Strength Index Score (3 Year Range Pct): | 86.2 | 16.5 | 18.2 |
| – Strength Index Reading (3 Year Range): | Bullish-Extreme | Bearish-Extreme | Bearish-Extreme |
| NET POSITION MOVEMENT INDEX: | | | |
| – 6-Week Change in Strength Index: | 19.3 | -15.4 | -54.7 |
SOYBEAN OIL Futures:
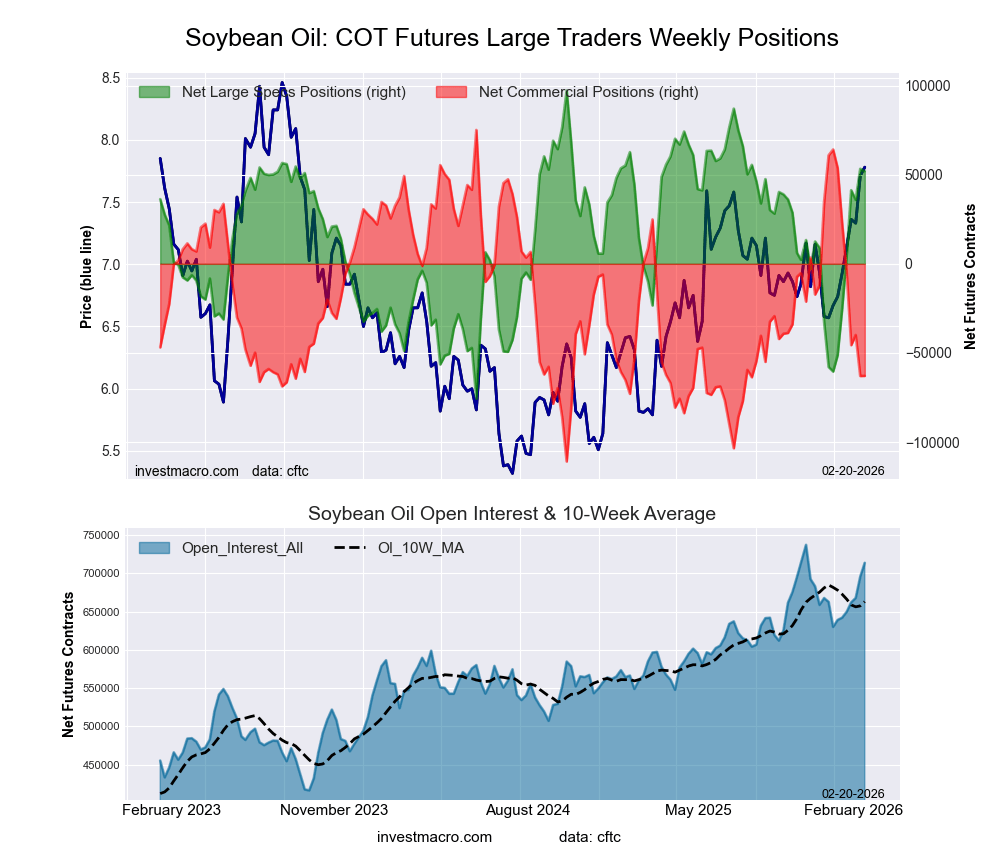 The SOYBEAN OIL large speculator standing this week equaled a net position of 51,971 contracts in the data reported through Tuesday. This was a weekly reduction of -1,306 contracts from the previous week which had a total of 53,277 net contracts.
This week’s current strength score (the trader positioning range over the past three years, measured from 0 to 100) shows the speculators are currently Bullish with a score of 73.8 percent. The commercials are Bearish with a score of 25.8 percent and the small traders (not shown in chart) are Bullish with a score of 72.7 percent.
Price Trend-Following Model: Strong Uptrend
Our weekly trend-following model classifies the current market price position as: Strong Uptrend.
| SOYBEAN OIL Futures Statistics | SPECULATORS | COMMERCIALS | SMALL TRADERS |
| – Percent of Open Interest Longs: | 21.7 | 47.0 | 5.2 |
| – Percent of Open Interest Shorts: | 14.4 | 55.8 | 3.7 |
| – Net Position: | 51,971 | -62,880 | 10,909 |
| – Gross Longs: | 155,039 | 335,704 | 37,409 |
| – Gross Shorts: | 103,068 | 398,584 | 26,500 |
| – Long to Short Ratio: | 1.5 to 1 | 0.8 to 1 | 1.4 to 1 |
| NET POSITION TREND: | | | |
| – Strength Index Score (3 Year Range Pct): | 73.8 | 25.8 | 72.7 |
| – Strength Index Reading (3 Year Range): | Bullish | Bearish | Bullish |
| NET POSITION MOVEMENT INDEX: | | | |
| – 6-Week Change in Strength Index: | 59.6 | -62.7 | 67.3 |
SOYBEAN MEAL Futures:
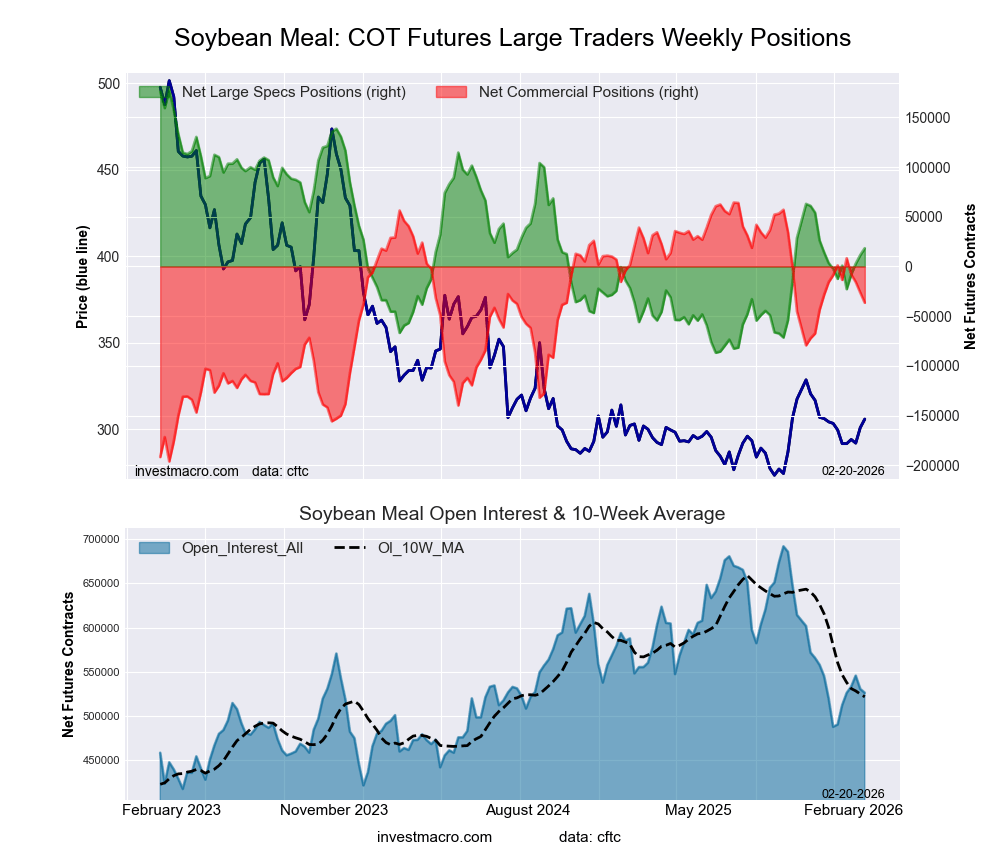 The SOYBEAN MEAL large speculator standing this week equaled a net position of 18,346 contracts in the data reported through Tuesday. This was a weekly increase of 6,974 contracts from the previous week which had a total of 11,372 net contracts.
This week’s current strength score (the trader positioning range over the past three years, measured from 0 to 100) shows the speculators are currently Bearish with a score of 39.9 percent. The commercials are Bullish with a score of 61.3 percent and the small traders (not shown in chart) are Bearish with a score of 45.6 percent.
Price Trend-Following Model: Strong Uptrend
Our weekly trend-following model classifies the current market price position as: Strong Uptrend.
| SOYBEAN MEAL Futures Statistics | SPECULATORS | COMMERCIALS | SMALL TRADERS |
| – Percent of Open Interest Longs: | 20.8 | 53.8 | 9.0 |
| – Percent of Open Interest Shorts: | 17.3 | 60.7 | 5.5 |
| – Net Position: | 18,346 | -36,473 | 18,127 |
| – Gross Longs: | 109,382 | 283,091 | 47,273 |
| – Gross Shorts: | 91,036 | 319,564 | 29,146 |
| – Long to Short Ratio: | 1.2 to 1 | 0.9 to 1 | 1.6 to 1 |
| NET POSITION TREND: | | | |
| – Strength Index Score (3 Year Range Pct): | 39.9 | 61.3 | 45.6 |
| – Strength Index Reading (3 Year Range): | Bearish | Bullish | Bearish |
| NET POSITION MOVEMENT INDEX: | | | |
| – 6-Week Change in Strength Index: | 11.7 | -14.4 | 37.1 |
LIVE CATTLE Futures:
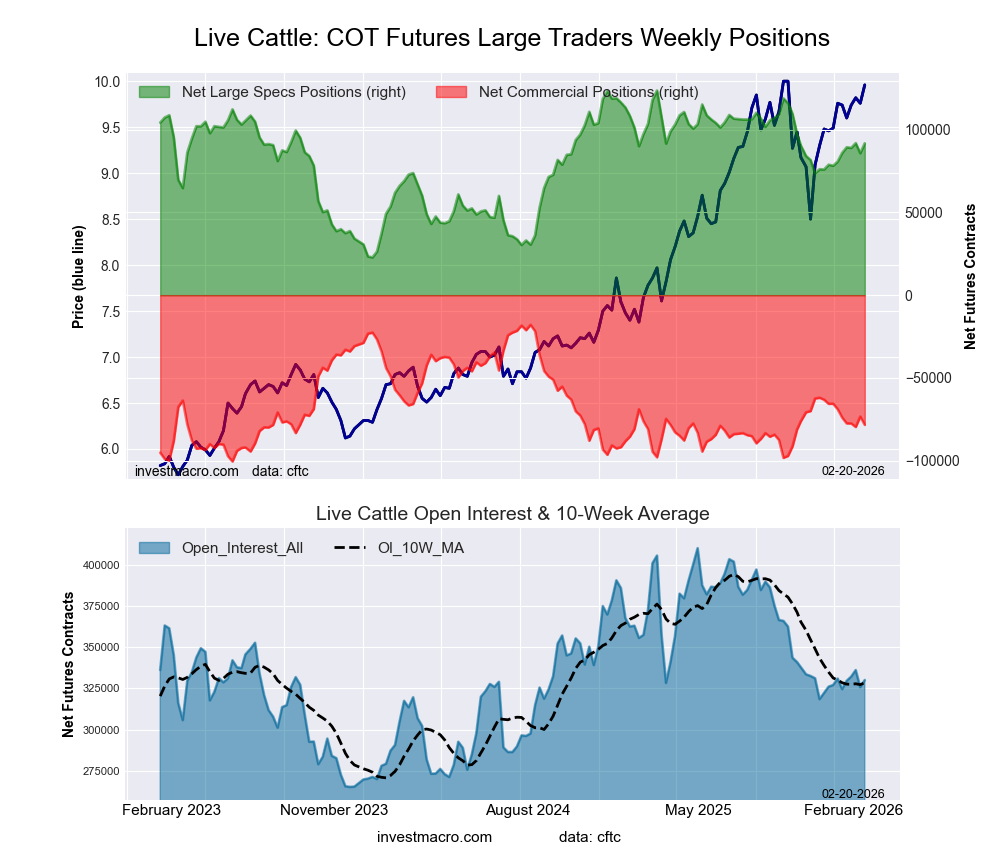 The LIVE CATTLE large speculator standing this week equaled a net position of 91,735 contracts in the data reported through Tuesday. This was a weekly gain of 5,979 contracts from the previous week which had a total of 85,756 net contracts.
This week’s current strength score (the trader positioning range over the past three years, measured from 0 to 100) shows the speculators are currently Bullish with a score of 68.4 percent. The commercials are Bearish with a score of 26.8 percent and the small traders (not shown in chart) are Bullish with a score of 51.3 percent.
Price Trend-Following Model: Strong Uptrend
Our weekly trend-following model classifies the current market price position as: Strong Uptrend.
| LIVE CATTLE Futures Statistics | SPECULATORS | COMMERCIALS | SMALL TRADERS |
| – Percent of Open Interest Longs: | 45.6 | 31.0 | 8.3 |
| – Percent of Open Interest Shorts: | 17.8 | 54.7 | 12.3 |
| – Net Position: | 91,735 | -78,353 | -13,382 |
| – Gross Longs: | 150,433 | 102,308 | 27,276 |
| – Gross Shorts: | 58,698 | 180,661 | 40,658 |
| – Long to Short Ratio: | 2.6 to 1 | 0.6 to 1 | 0.7 to 1 |
| NET POSITION TREND: | | | |
| – Strength Index Score (3 Year Range Pct): | 68.4 | 26.8 | 51.3 |
| – Strength Index Reading (3 Year Range): | Bullish | Bearish | Bullish |
| NET POSITION MOVEMENT INDEX: | | | |
| – 6-Week Change in Strength Index: | 10.9 | -11.5 | -5.5 |
LEAN HOGS Futures:
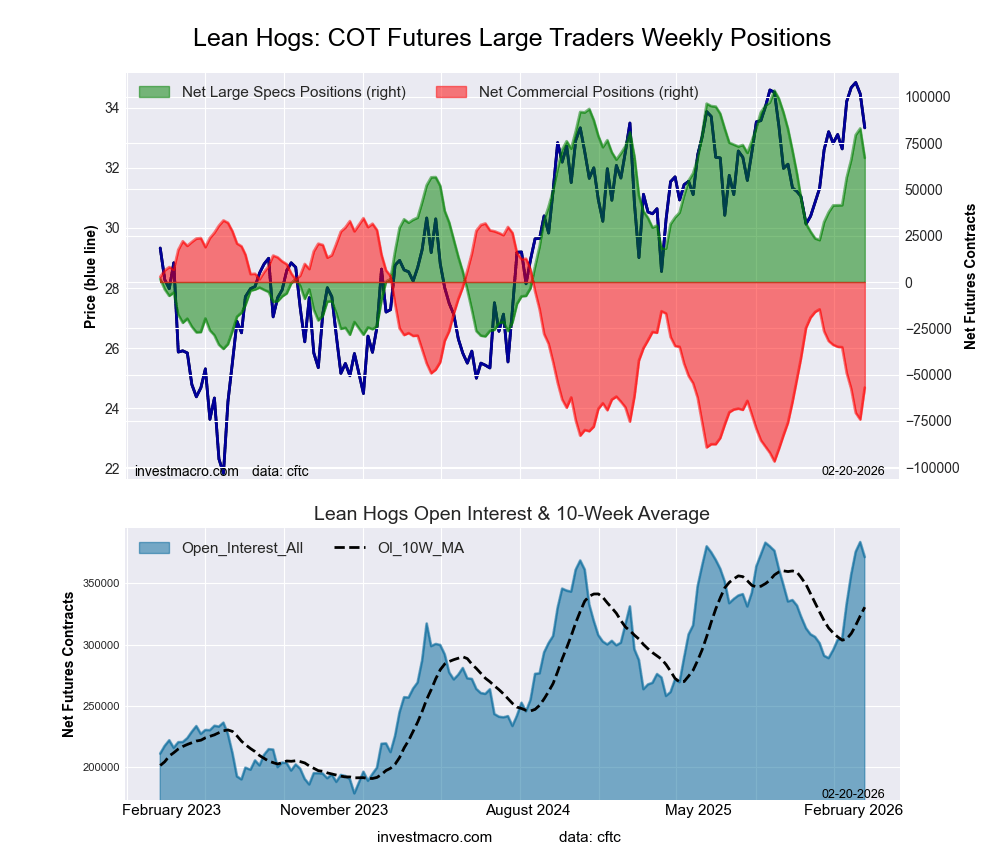 The LEAN HOGS large speculator standing this week equaled a net position of 67,022 contracts in the data reported through Tuesday. This was a weekly reduction of -15,873 contracts from the previous week which had a total of 82,895 net contracts.
This week’s current strength score (the trader positioning range over the past three years, measured from 0 to 100) shows the speculators are currently Bullish with a score of 73.9 percent. The commercials are Bearish with a score of 30.3 percent and the small traders (not shown in chart) are Bearish-Extreme with a score of 17.3 percent.
Price Trend-Following Model: Uptrend
Our weekly trend-following model classifies the current market price position as: Uptrend.
| LEAN HOGS Futures Statistics | SPECULATORS | COMMERCIALS | SMALL TRADERS |
| – Percent of Open Interest Longs: | 39.8 | 32.3 | 5.6 |
| – Percent of Open Interest Shorts: | 21.8 | 47.6 | 8.3 |
| – Net Position: | 67,022 | -57,027 | -9,995 |
| – Gross Longs: | 147,998 | 119,956 | 20,920 |
| – Gross Shorts: | 80,976 | 176,983 | 30,915 |
| – Long to Short Ratio: | 1.8 to 1 | 0.7 to 1 | 0.7 to 1 |
| NET POSITION TREND: | | | |
| – Strength Index Score (3 Year Range Pct): | 73.9 | 30.3 | 17.3 |
| – Strength Index Reading (3 Year Range): | Bullish | Bearish | Bearish-Extreme |
| NET POSITION MOVEMENT INDEX: | | | |
| – 6-Week Change in Strength Index: | 18.4 | -16.8 | -21.6 |
COTTON Futures:
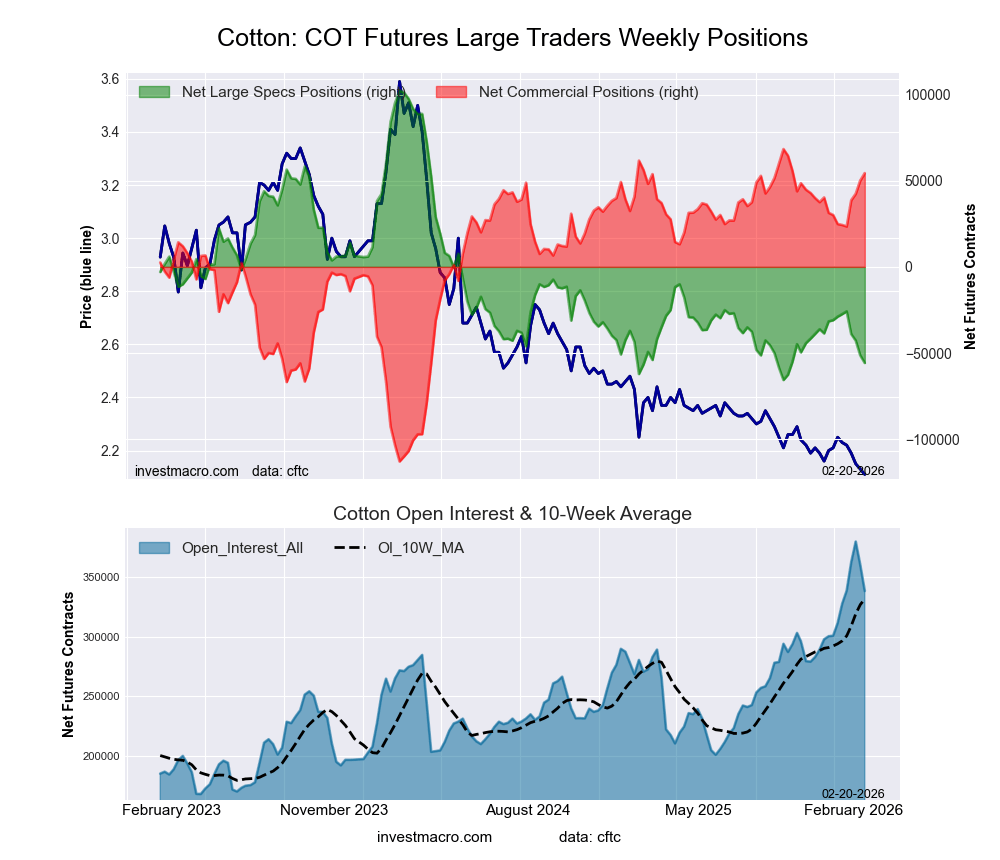 The COTTON large speculator standing this week equaled a net position of -55,733 contracts in the data reported through Tuesday. This was a weekly reduction of -4,407 contracts from the previous week which had a total of -51,326 net contracts.
This week’s current strength score (the trader positioning range over the past three years, measured from 0 to 100) shows the speculators are currently Bearish-Extreme with a score of 5.9 percent. The commercials are Bullish-Extreme with a score of 92.3 percent and the small traders (not shown in chart) are Bearish with a score of 32.3 percent.
Price Trend-Following Model: Downtrend
Our weekly trend-following model classifies the current market price position as: Downtrend.
| COTTON Futures Statistics | SPECULATORS | COMMERCIALS | SMALL TRADERS |
| – Percent of Open Interest Longs: | 29.4 | 46.2 | 4.6 |
| – Percent of Open Interest Shorts: | 45.9 | 30.1 | 4.2 |
| – Net Position: | -55,733 | 54,389 | 1,344 |
| – Gross Longs: | 99,583 | 156,452 | 15,630 |
| – Gross Shorts: | 155,316 | 102,063 | 14,286 |
| – Long to Short Ratio: | 0.6 to 1 | 1.5 to 1 | 1.1 to 1 |
| NET POSITION TREND: | | | |
| – Strength Index Score (3 Year Range Pct): | 5.9 | 92.3 | 32.3 |
| – Strength Index Reading (3 Year Range): | Bearish-Extreme | Bullish-Extreme | Bearish |
| NET POSITION MOVEMENT INDEX: | | | |
| – 6-Week Change in Strength Index: | -16.0 | 16.3 | -19.9 |
COCOA Futures:
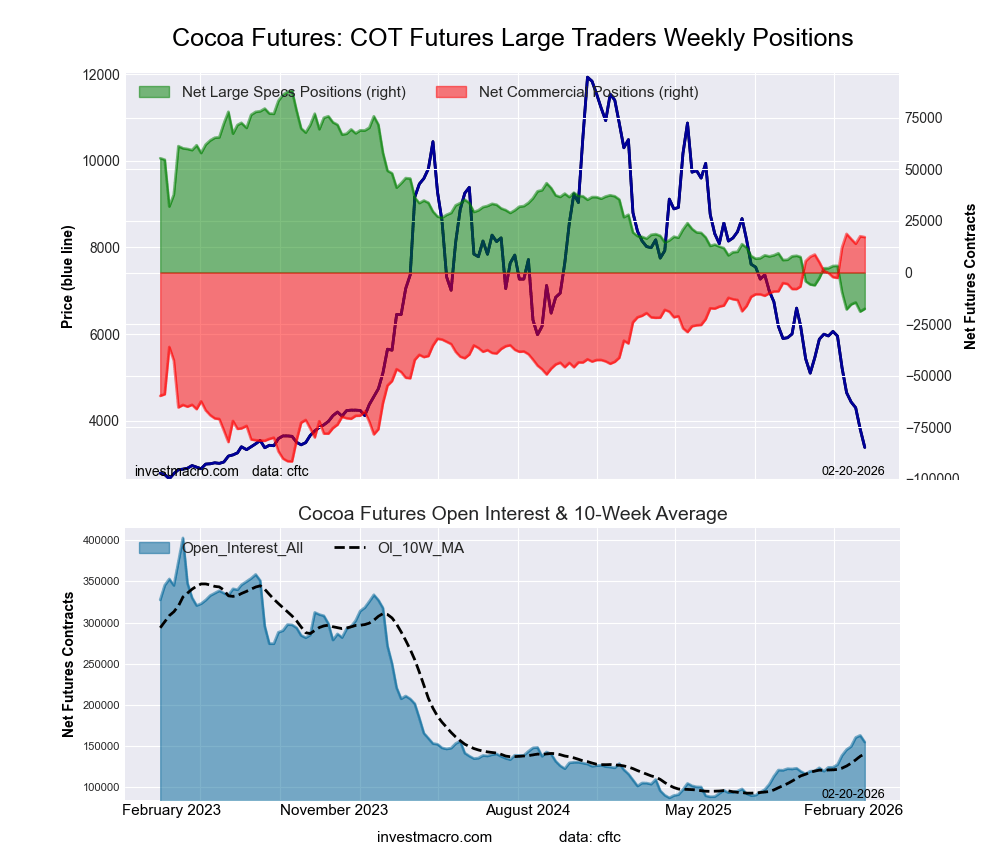 The COCOA large speculator standing this week equaled a net position of -17,618 contracts in the data reported through Tuesday. This was a weekly advance of 1,328 contracts from the previous week which had a total of -18,946 net contracts.
This week’s current strength score (the trader positioning range over the past three years, measured from 0 to 100) shows the speculators are currently Bearish-Extreme with a score of 1.2 percent. The commercials are Bullish-Extreme with a score of 98.6 percent and the small traders (not shown in chart) are Bearish with a score of 31.6 percent.
Price Trend-Following Model: Strong Downtrend
Our weekly trend-following model classifies the current market price position as: Strong Downtrend.
| COCOA Futures Statistics | SPECULATORS | COMMERCIALS | SMALL TRADERS |
| – Percent of Open Interest Longs: | 19.0 | 48.3 | 7.4 |
| – Percent of Open Interest Shorts: | 30.3 | 37.2 | 7.1 |
| – Net Position: | -17,618 | 17,159 | 459 |
| – Gross Longs: | 29,310 | 74,716 | 11,431 |
| – Gross Shorts: | 46,928 | 57,557 | 10,972 |
| – Long to Short Ratio: | 0.6 to 1 | 1.3 to 1 | 1.0 to 1 |
| NET POSITION TREND: | | | |
| – Strength Index Score (3 Year Range Pct): | 1.2 | 98.6 | 31.6 |
| – Strength Index Reading (3 Year Range): | Bearish-Extreme | Bullish-Extreme | Bearish |
| NET POSITION MOVEMENT INDEX: | | | |
| – 6-Week Change in Strength Index: | -19.4 | 17.9 | 10.2 |
WHEAT Futures:
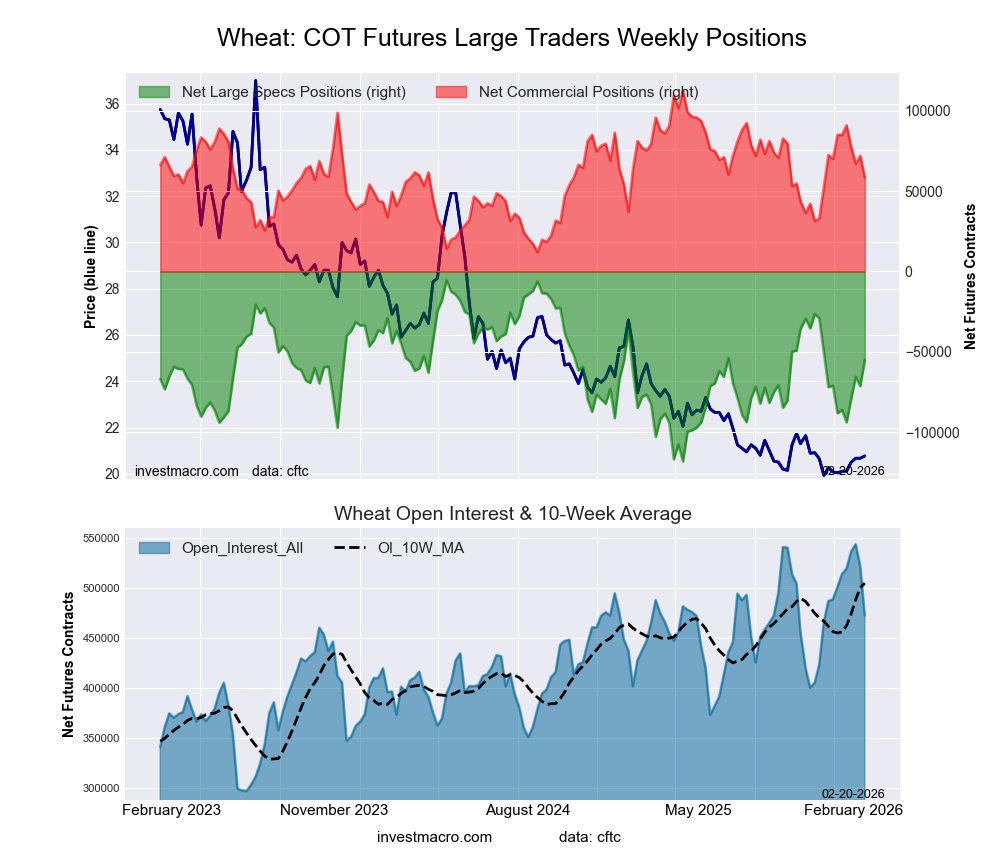 The WHEAT large speculator standing this week equaled a net position of -55,058 contracts in the data reported through Tuesday. This was a weekly increase of 16,200 contracts from the previous week which had a total of -71,258 net contracts.
This week’s current strength score (the trader positioning range over the past three years, measured from 0 to 100) shows the speculators are currently Bullish with a score of 55.9 percent. The commercials are Bearish with a score of 46.2 percent and the small traders (not shown in chart) are Bearish with a score of 34.6 percent.
Price Trend-Following Model: Uptrend
Our weekly trend-following model classifies the current market price position as: Uptrend.
| WHEAT Futures Statistics | SPECULATORS | COMMERCIALS | SMALL TRADERS |
| – Percent of Open Interest Longs: | 25.8 | 35.5 | 6.8 |
| – Percent of Open Interest Shorts: | 37.5 | 23.1 | 7.5 |
| – Net Position: | -55,058 | 58,384 | -3,326 |
| – Gross Longs: | 122,049 | 167,707 | 32,177 |
| – Gross Shorts: | 177,107 | 109,323 | 35,503 |
| – Long to Short Ratio: | 0.7 to 1 | 1.5 to 1 | 0.9 to 1 |
| NET POSITION TREND: | | | |
| – Strength Index Score (3 Year Range Pct): | 55.9 | 46.2 | 34.6 |
| – Strength Index Reading (3 Year Range): | Bullish | Bearish | Bearish |
| NET POSITION MOVEMENT INDEX: | | | |
| – 6-Week Change in Strength Index: | 29.3 | -26.4 | -37.8 |
Article By InvestMacro – Receive our weekly COT Newsletter
*COT Report: The COT data, released weekly to the public each Friday, is updated through the most recent Tuesday (data is 3 days old) and shows a quick view of how large speculators or non-commercials (for-profit traders) were positioned in the futures markets.
The CFTC categorizes trader positions according to commercial hedgers (traders who use futures contracts for hedging as part of the business), non-commercials (large traders who speculate to realize trading profits) and nonreportable traders (usually small traders/speculators) as well as their open interest (contracts open in the market at time of reporting). See CFTC criteria here.