By RoboForex Analytical Department
GBP/USD fell for the fifth consecutive day, reaching 1.3445. The slowdown in headline price growth has boosted expectations of an imminent rate cut by the Bank of England, although underlying price pressures remain robust.
Annual inflation in January slowed to 3.0% from 3.4% in December, in line with forecasts. However, inflation in the services sector, which reflects domestic price pressures, only fell to 4.4% from 4.5%, above the expected 4.3%. This partly supported the pound. Earlier, sterling had fallen after weak labour data raised expectations of a rate cut.
According to Chris Turner, Head of Global Research at ING, the market had been counting on a more pronounced slowdown in inflation, but the data were not unambiguously weak. A better-than-expected figure for services gave sterling “only limited respite.”
Investors now price the chance of a 25bp rate cut by the Bank of England next month at around 85%. By the end of the year, the market fully prices in two 25bp reductions.
The political situation remains an additional factor of uncertainty. The upcoming parliamentary by-election in Greater Manchester could reignite discussions about Prime Minister Keir Starmer’s leadership in the event of a Labour defeat. According to ING, a major loss for the party could increase pressure on the pound and the government bond market.
Technical Analysis
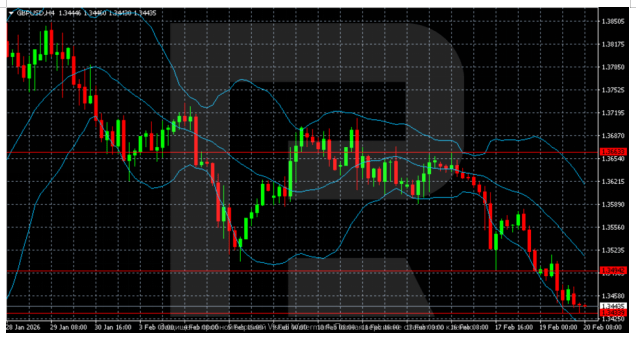
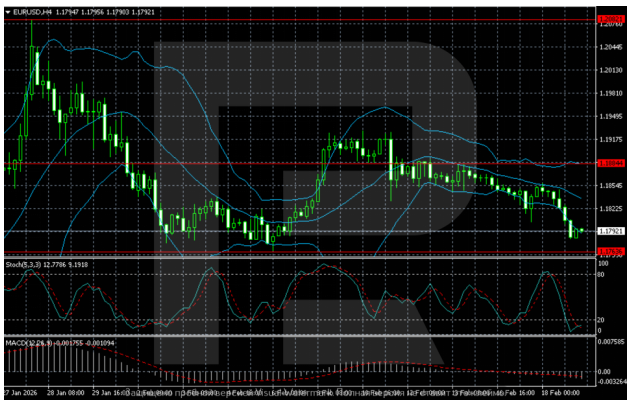
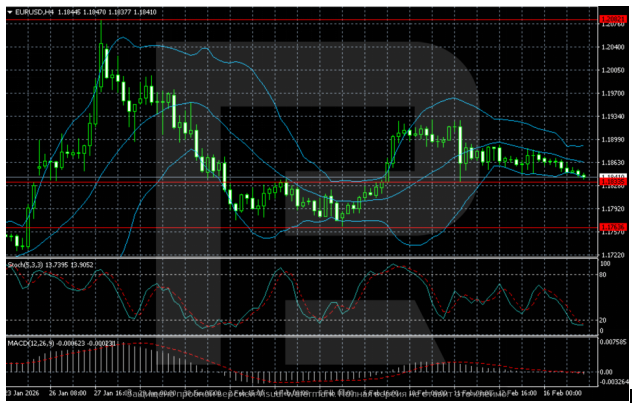
The H4 chart maintains a pronounced downtrend. After a series of lower highs, the pair broke through the 1.3490–1.3500 zone and accelerated its decline to 1.3430–1.3440. The price moves along the lower band of the Bollinger Bands, confirming the dominance of sellers.
Local rebound attempts remain weak and are quickly sold into. The nearest resistance stands at 1.3490–1.3520, followed by 1.3660. Support is at 1.3430; a break below would open the path to further losses.
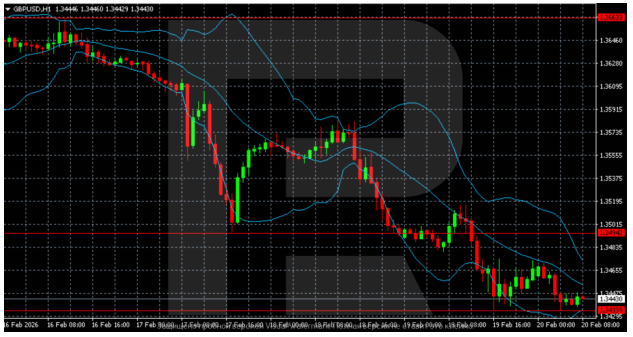
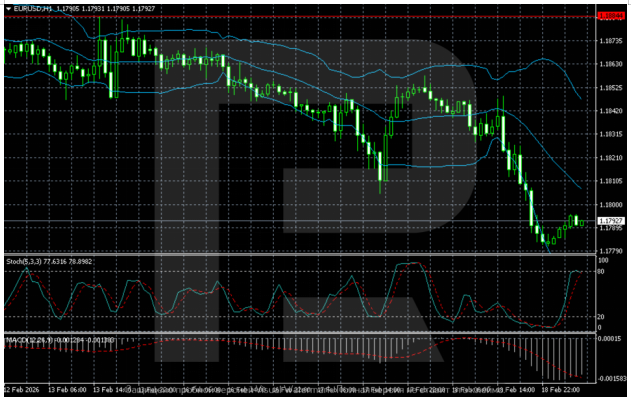
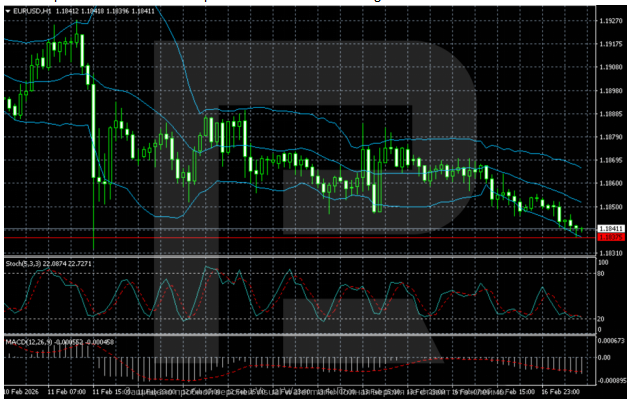
The H1 time frame shows a sharp sell-off on 19 February, followed by narrow consolidation at the lows. The Bollinger Bands have begun to narrow, suggesting volatility is easing after the recent sharp move.
The price is holding near 1.3430–1.3450. A sustained move above 1.3490 would allow for a more pronounced corrective pullback. The bearish scenario remains intact while the pair trades below 1.3490.
Conclusion
In summary, GBP/USD remains entrenched in a sustained downtrend, extending its losing streak to five sessions. While headline inflation softened as expected, sticky services inflation and resilient underlying pressures complicate the BoE’s policy calculus. The market remains firmly priced for a March rate cut, with political risks adding to the uncertainty. Technically, the pair has breached key support and trades with a clear bearish bias. Any corrective bounces are likely to be capped near 1.3490–1.3520, with a break below 1.3430 opening the door to deeper losses. The near-term outlook remains firmly negative unless prices can reclaim the 1.3490 level.
Disclaimer
Any forecasts contained herein are based on the author’s particular opinion. This analysis may not be treated as trading advice. RoboForex bears no responsibility for trading results based on trading recommendations and reviews contained herein.