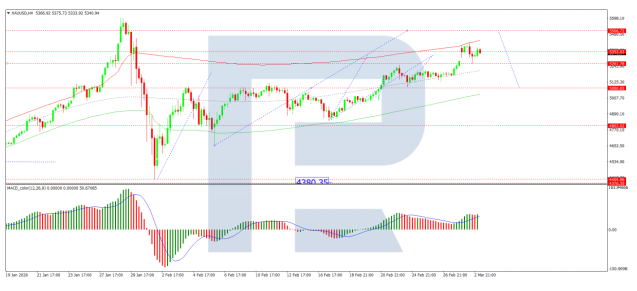
On Friday, trading on the US stock market ended with a decline. By the end of Friday, the Dow Jones (US30) Index fell by 1.05% (-1.15% for the week). The S&P 500 (US500) dropped by 0.43% (-0.38% for the week). The tech-heavy NASDAQ (US100) closed lower by 0.30% (+0.51% for the week). The primary blow was a “hot” Producer Price Index (PPI) report, where the core figure jumped by 0.8%, confirming that companies are actively passing increased tariff costs onto consumers. This sharply reduced the chances of Fed easing, and the escalation in the Persian Gulf added fuel to the fire, sending oil prices and inflation expectations skyrocketing.
Market tranquility was shattered over the weekend. On February 28, 2026, the United States and Israel launched a large-scale military operation, “Epic Fury,” against Iran. In response, Tehran launched missile strikes on US bases in the UAE, Qatar, and Kuwait, while the Islamic Revolutionary Guard Corps announced the closure of the Strait of Hormuz. As up to 30% of global seaborne oil trade passes through this route, experts predict oil prices could jump to $100 per barrel. This creates a risk of a new wave of stagflation for Europe and other nations.
European equity markets mostly rose. The German (DE40) fell 0.02% (+0.86% for the week), the French CAC 40 (FR40) closed down 0.47% (+1.29% for the week), the Spanish IBEX 35 (ES35) dropped 0.73% (+0.73% for the week), and the British FTSE 100 (UK100) closed up 0.59% (+2.31% for the week). However, European exchanges opened with a crash. Markets are reacting to the critical escalation in the Middle East: the death of Iran’s Supreme Leader Ayatollah Ali Khamenei and the de facto blockade of the Strait of Hormuz have threatened Europe’s energy security. Amid record-low gas reserves in underground storage facilities, the spike in energy prices intensifies stagflation risks, forcing investors to price in a more hawkish ECB policy. The macroeconomic backdrop remains concerning: while inflation in Germany slowed in February, its acceleration in France and Spain gives the regulator little cause for optimism. Money markets now price the probability of a rate cut by year-end at just 30%.
Palladium (XPD) prices jumped above $1,800 per ounce, reaching a monthly high amid the large-scale military conflict in the Middle East. The death of Iran’s Supreme Leader and Donald Trump’s tough rhetoric regarding the continuation of Operation “Epic Fury” triggered panic buying of precious metals. Geopolitical chaos has collided with an acute supply deficit: production disruptions in South Africa and the risk of new sanctions against Russian exports (which account for about 40% of the global market) threaten long-term supply chain ruptures for the automotive industry. Future price dynamics will depend on dollar stability and Friday’s Non-farm Payrolls report. If the US labor market remains strong, the dollar will continue to rise, potentially limiting the palladium rally.
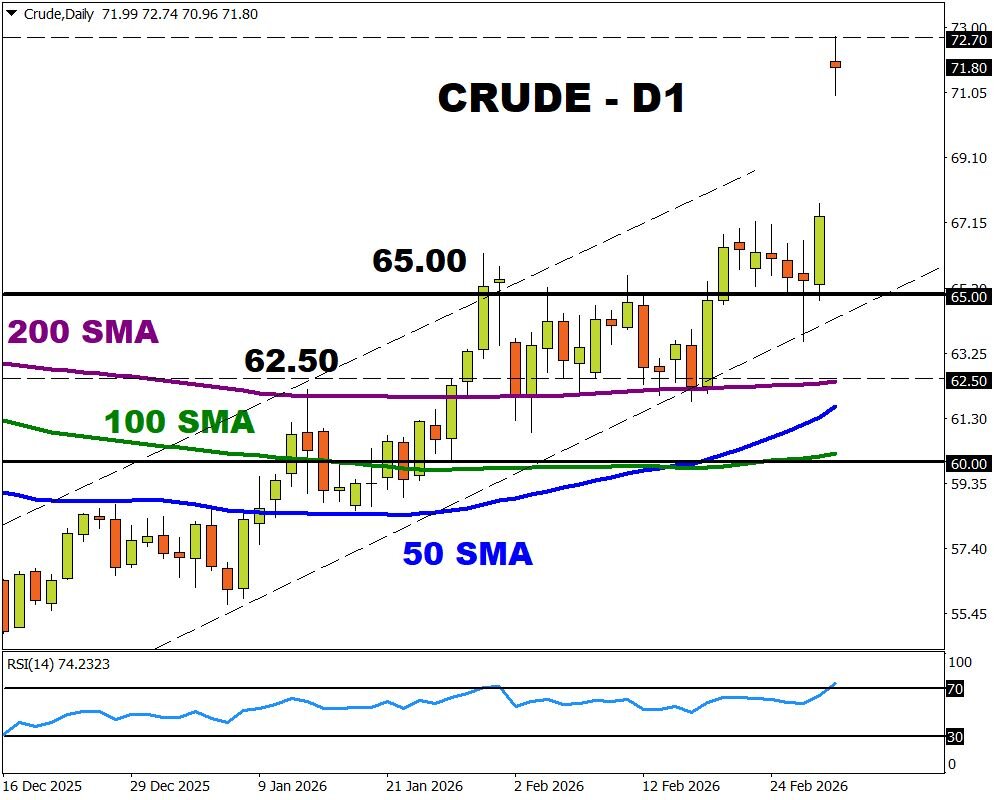
WTI oil prices jumped over 6%, settling above $71 per barrel (after a brief 10% spike). This is an eight-month high triggered by the start of Operation “Epic Fury” – unprecedented strikes by the US and Israel on Iran on February 28. Markets are pricing in the risk of a total blockade of the Strait of Hormuz, through which approximately 20% of global oil supplies flow. Against the backdrop of the escalation, the OPEC+ decision made on Sunday appears extremely cautious: the alliance will increase production in April by only 206,000 barrels per day. This is half the previously discussed volume (up to 548,000 bpd) and clearly insufficient to offset the potential loss of Iranian exports. Investors await the US market open, where a supply deficit combined with a rising geopolitical premium could push quotes to the $80-85 level as early as this week.
Asian markets traded with mixed dynamics last week. The Japanese Nikkei 225 (JP225) rose 3.60% for the week, the Chinese FTSE China A50 (CHA50) fell 1.47%, the Hong Kong Hang Seng (HK50) dropped 1.30%, and the Australian ASX 200 (AU200) showed a positive 5-day result of 1.03%.
The Hang Seng Index plunged 667 points (-2.5%), hitting a six-week low. The sell-off was triggered by the sharp escalation of the war: following the deaths of three US service members, Donald Trump vowed “revenge” and pledged to continue Operation “Epic Fury” until Iran’s military potential is fully destroyed. The confirmed death of Ayatollah Khamenei and the blockade of the Strait of Hormuz threatened global oil supplies, causing a collapse in tech giants and airline stocks due to fuel crisis fears. Mainland Chinese indices served as a partial counterweight, showing moderate growth. Investors are betting on the “Two Sessions” of the NPC starting March 4: amidst a new major war in the Middle East, the market expects Beijing to sharply increase government spending on technological sovereignty and the launch of the 15th Five-Year Plan (2026-2030).
The Australian dollar (AUD) fell to $0.70, completely erasing last week’s gains. As a typical “risk-on” currency, the “aussie” suffered from a global flight to safety (US dollar and gold). Direct Iranian strikes on US bases in Gulf countries and Jordan, alongside the blockade of the Strait of Hormuz, have jeopardized global supply chains to which Australia’s economy is highly sensitive. Domestic statistics added pressure: Australia’s Manufacturing PMI was revised down to 51.0 – a four-month low.