By InvestMacro
Here are the latest charts and statistics for the Commitment of Traders (COT) reports data published by the Commodities Futures Trading Commission (CFTC).
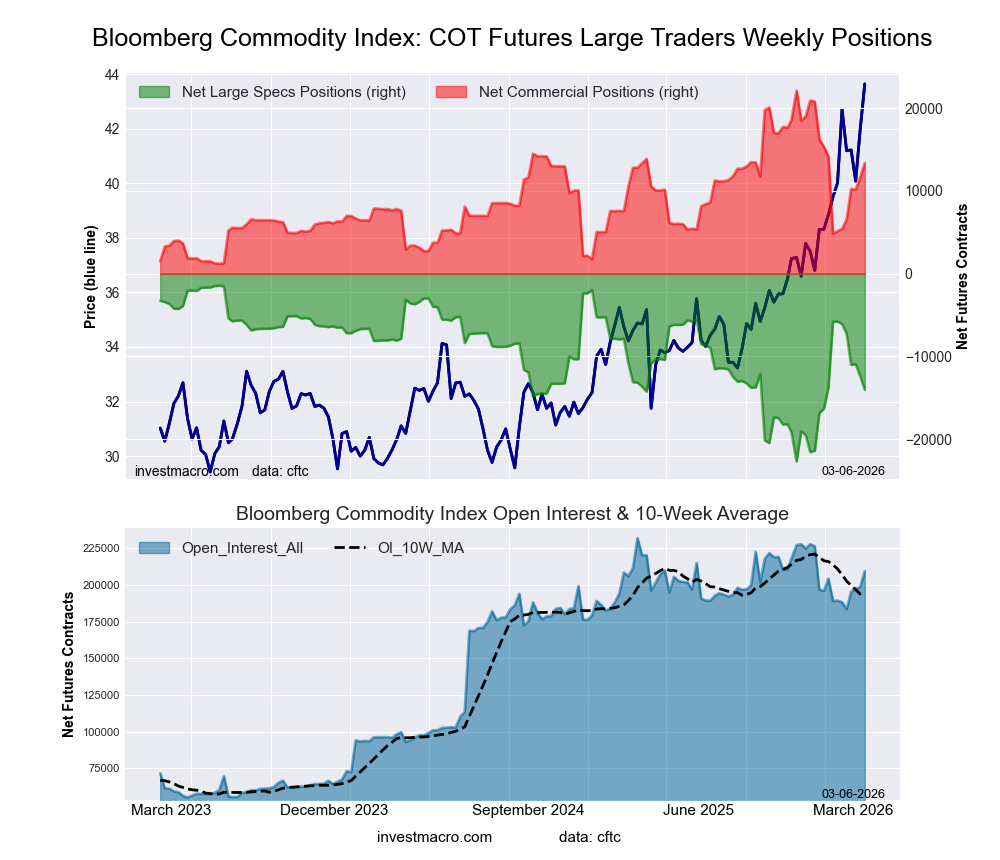
The latest COT data is updated through Tuesday March 3rd and shows a quick view of how large traders (for-profit speculators and commercial entities) were positioned in the futures markets.
Weekly Speculator Changes led by Corn & Soybean Meal
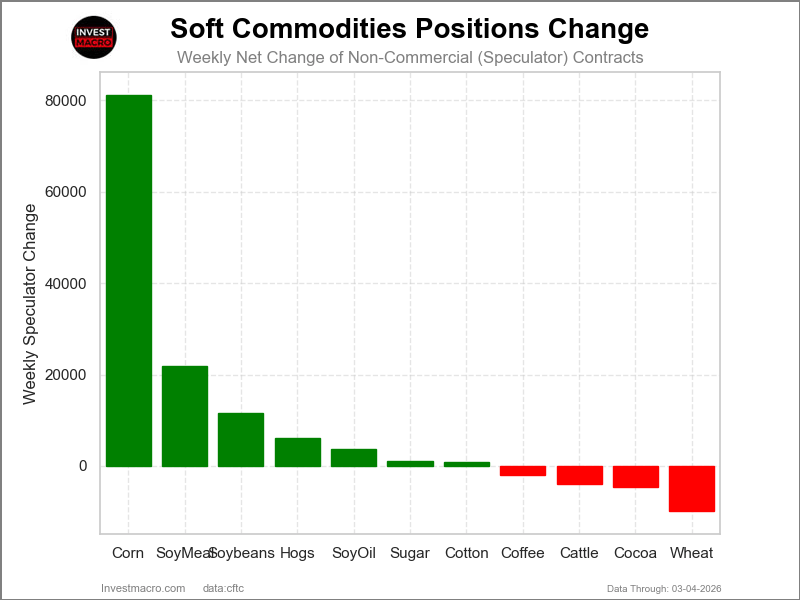
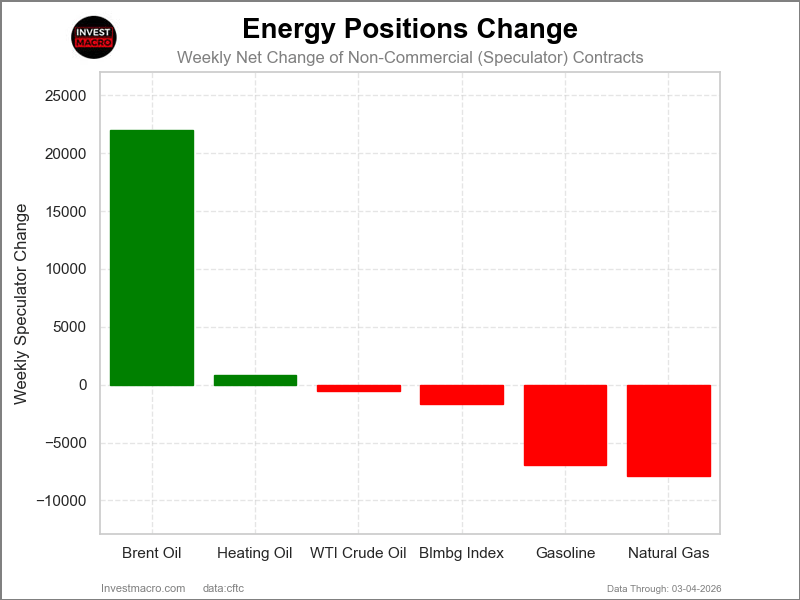
The COT soft commodities markets speculator bets were overall higher this week as seven out of the eleven softs markets we cover had higher positioning while the other four markets had lower speculator contracts.
Leading the gains for the softs markets was Corn (81,231 contracts) with Soybean Meal (21,920 contracts), Soybeans (11,630 contracts), Lean Hogs (6,052 contracts), Soybean Oil (3,752 contracts), Sugar (1,089 contracts) and Cotton (873 contracts) also showing positive weeks.
The markets with the declines in speculator bets this week were Wheat (-9,920 contracts), Cocoa (-4,550 contracts), Live Cattle (-3,896 contracts) and with Coffee (-2,014 contracts) also registering lower bets on the week.
Soybean Oil leads the Soft Commodities price performance this week
Leading the soft commodities price performance this week was Soybean Oil with a strong 7.13% gain over the past five days. Coffee rose this week by 4.67%, followed by Wheat, which rose by 4.61%. Corn was higher by 3.64%. Soybeans were up by 2.54%, and Sugar was higher by approximately 2% on the week. Live Cattle was up by 1.77%, and Lean Hogs advanced by 0.32%.
On the downside, the biggest loser on the week was Soybean Meal with a -3.78% decline, followed by Cotton, which dipped by -2.28%. And Cocoa was virtually unchanged with a small decline of -0.26%.
Soft Commodities Data:
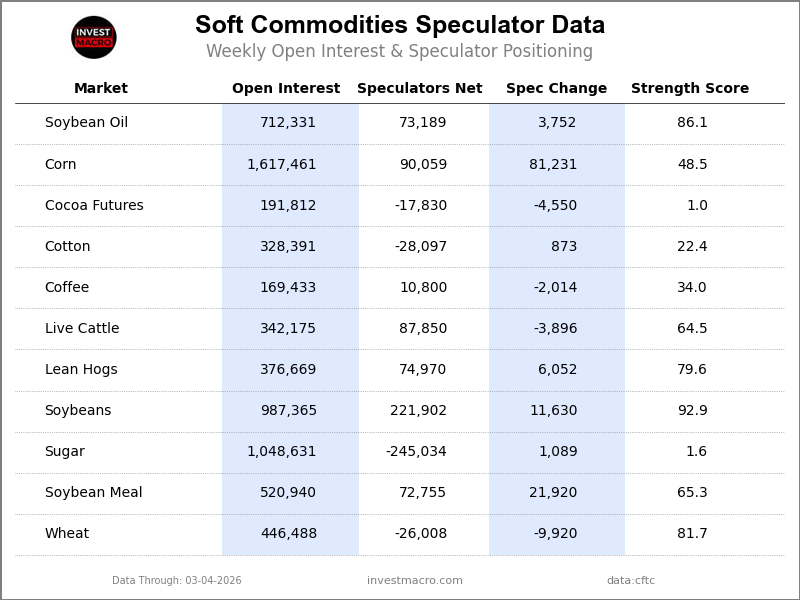
Legend: Weekly Speculators Change | Speculators Current Net Position | Speculators Strength Score compared to last 3-Years (0-100 range)
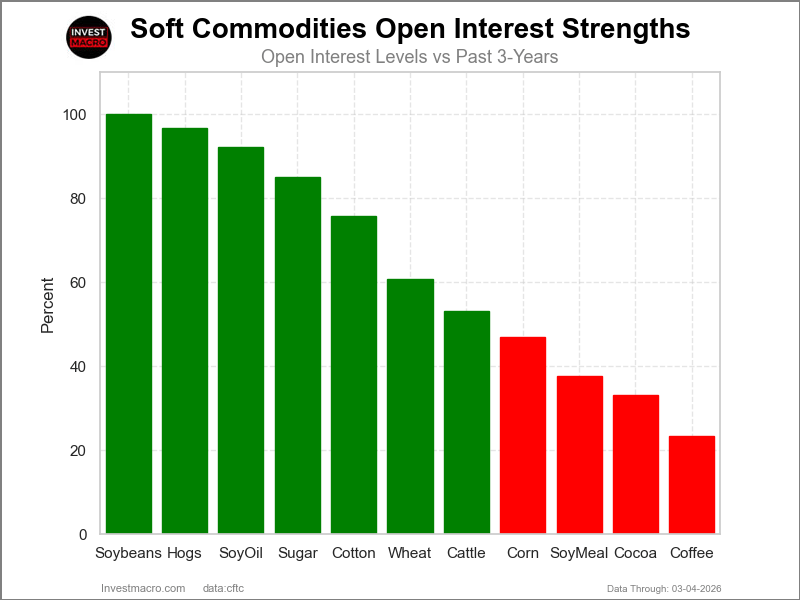
Strength Scores led by Soybeans & Soybean Oil
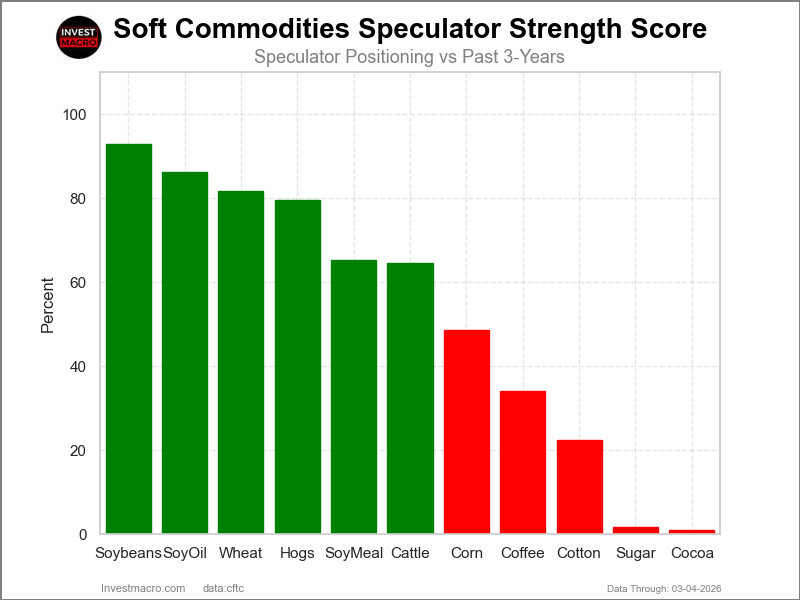
COT Strength Scores (a normalized measure of Speculator positions over a 3-Year range, from 0 to 100 where above 80 is Extreme-Bullish and below 20 is Extreme-Bearish) showed that Soybeans (93 percent) and Soybean Oil (86 percent) lead the softs markets this week. Wheat (82 percent), Lean Hogs (80 percent) and Soybean Meal (65 percent) come in as the next highest in the weekly strength scores.
On the downside, Cocoa (1 percent) and Sugar (2 percent) come in at the lowest strength levels currently and are in Extreme-Bearish territory (below 20 percent). The next lowest strength scores are the Cotton (22 percent) and the Coffee (34 percent).
Strength Statistics:
Corn (48.5 percent) vs Corn previous week (37.4 percent)
Sugar (1.6 percent) vs Sugar previous week (1.4 percent)
Coffee (34.0 percent) vs Coffee previous week (36.0 percent)
Soybeans (92.9 percent) vs Soybeans previous week (90.3 percent)
Soybean Oil (86.1 percent) vs Soybean Oil previous week (83.9 percent)
Soybean Meal (65.3 percent) vs Soybean Meal previous week (56.3 percent)
Live Cattle (64.5 percent) vs Live Cattle previous week (68.4 percent)
Lean Hogs (79.6 percent) vs Lean Hogs previous week (75.3 percent)
Cotton (22.4 percent) vs Cotton previous week (21.8 percent)
Cocoa (1.0 percent) vs Cocoa previous week (5.3 percent)
Wheat (81.7 percent) vs Wheat previous week (90.5 percent)
Wheat & Soybean Oil top the 6-Week Strength Trends
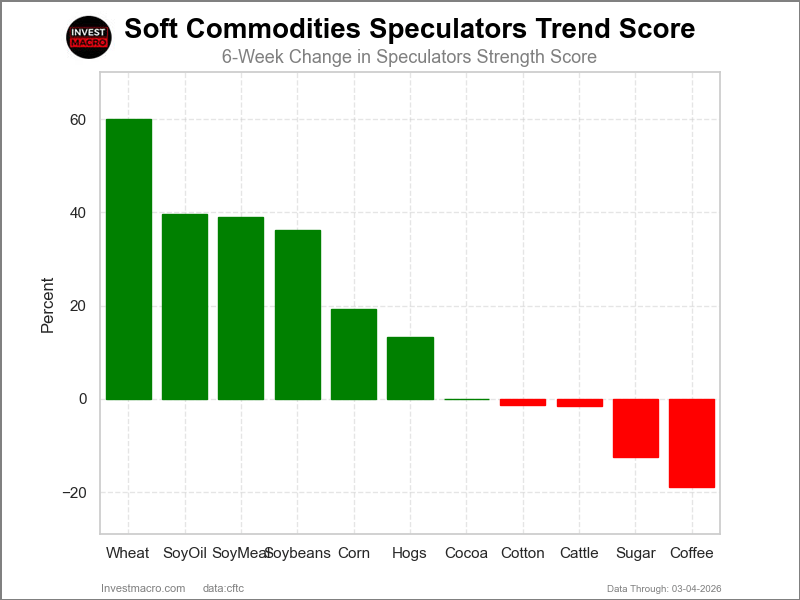
COT Strength Score Trends (or move index, calculates the 6-week changes in strength scores) showed that Wheat (60 percent) and Soybean Oil (40 percent) lead the past six weeks trends for soft commodities. Soybean Meal (39 percent), Soybeans (36 percent) and Corn (19 percent) are the next highest positive movers in the latest trends data.
Coffee (-19 percent) leads the downside trend scores currently with Sugar (-13 percent) following next with a lower trend score.
Strength Trend Statistics:
Corn (19.3 percent) vs Corn previous week (5.8 percent)
Sugar (-12.5 percent) vs Sugar previous week (-15.1 percent)
Coffee (-19.0 percent) vs Coffee previous week (-20.0 percent)
Soybeans (36.3 percent) vs Soybeans previous week (33.5 percent)
Soybean Oil (39.7 percent) vs Soybean Oil previous week (54.7 percent)
Soybean Meal (39.1 percent) vs Soybean Meal previous week (20.5 percent)
Live Cattle (-1.5 percent) vs Live Cattle previous week (5.8 percent)
Lean Hogs (13.3 percent) vs Lean Hogs previous week (19.7 percent)
Cotton (-1.4 percent) vs Cotton previous week (-0.9 percent)
Cocoa (0.0 percent) vs Cocoa previous week (-3.5 percent)
Wheat (60.1 percent) vs Wheat previous week (62.1 percent)
Individual Soft Commodities Markets:
CORN Futures:
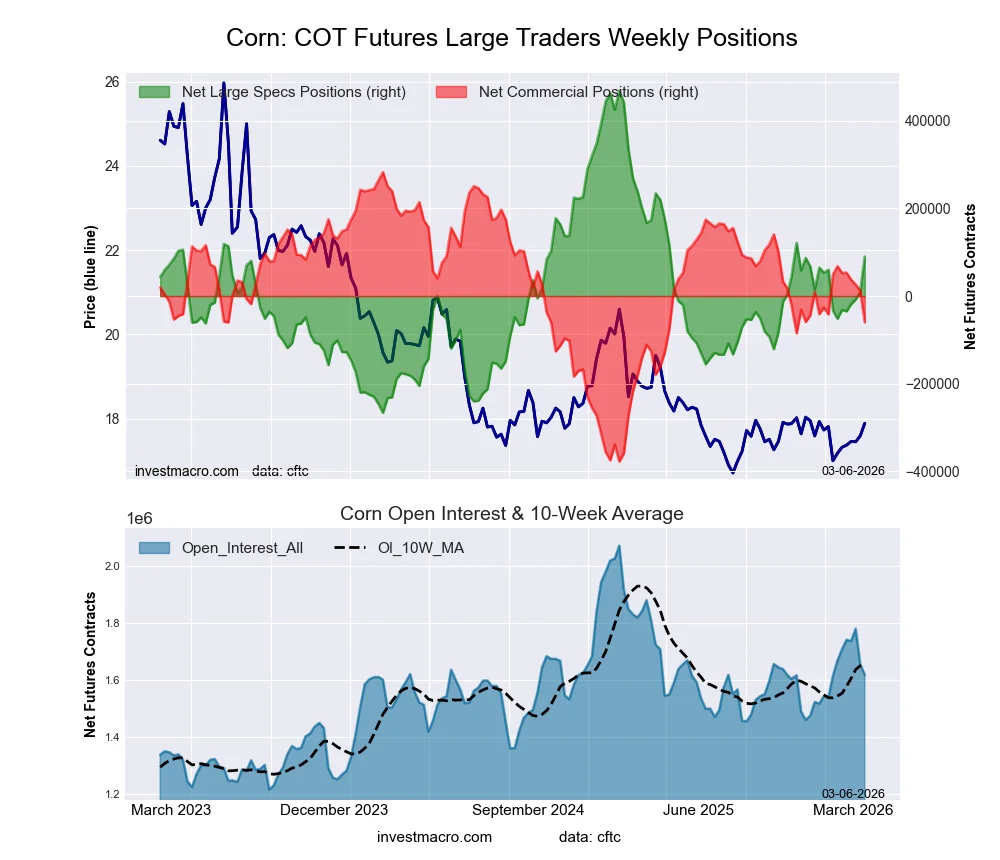 The CORN large speculator standing this week recorded a net position of 90,059 contracts in the data reported through Tuesday. This was a huge weekly increase of 81,231 contracts from the previous week which had a total of 8,828 net contracts.
This week’s current strength score (the trader positioning range over the past three years, measured from 0 to 100) shows the speculators are currently Bearish with a score of 48.5 percent. The commercials are Bearish with a score of 48.1 percent and the small traders (not shown in chart) are Bullish with a score of 71.3 percent.
Price Trend-Following Model: Strong Uptrend
Our weekly trend-following model classifies the current market price position as: Strong Uptrend.
| CORN Futures Statistics | SPECULATORS | COMMERCIALS | SMALL TRADERS |
| – Percent of Open Interest Longs: | 20.8 | 45.6 | 8.2 |
| – Percent of Open Interest Shorts: | 15.2 | 49.3 | 10.1 |
| – Net Position: | 90,059 | -59,782 | -30,277 |
| – Gross Longs: | 336,624 | 738,095 | 132,844 |
| – Gross Shorts: | 246,565 | 797,877 | 163,121 |
| – Long to Short Ratio: | 1.4 to 1 | 0.9 to 1 | 0.8 to 1 |
| NET POSITION TREND: | | | |
| – Strength Index Score (3 Year Range Pct): | 48.5 | 48.1 | 71.3 |
| – Strength Index Reading (3 Year Range): | Bearish | Bearish | Bullish |
| NET POSITION MOVEMENT INDEX: | | | |
| – 6-Week Change in Strength Index: | 19.3 | -19.4 | -16.3 |
SUGAR Futures:
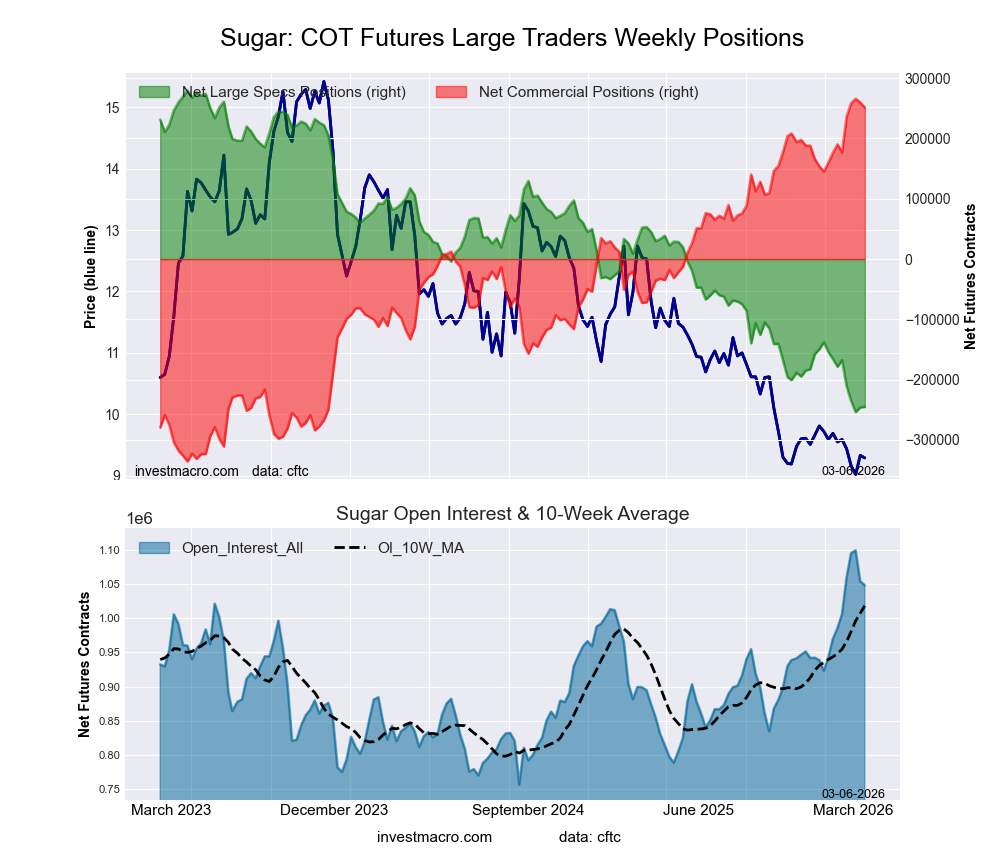 The SUGAR large speculator standing this week recorded a net position of -245,034 contracts in the data reported through Tuesday. This was a weekly increase of 1,089 contracts from the previous week which had a total of -246,123 net contracts.
This week’s current strength score (the trader positioning range over the past three years, measured from 0 to 100) shows the speculators are currently Bearish-Extreme with a score of 1.6 percent. The commercials are Bullish-Extreme with a score of 97.6 percent and the small traders (not shown in chart) are Bearish with a score of 23.4 percent.
Price Trend-Following Model: Downtrend
Our weekly trend-following model classifies the current market price position as: Downtrend.
| SUGAR Futures Statistics | SPECULATORS | COMMERCIALS | SMALL TRADERS |
| – Percent of Open Interest Longs: | 18.4 | 53.2 | 7.2 |
| – Percent of Open Interest Shorts: | 41.8 | 29.2 | 7.8 |
| – Net Position: | -245,034 | 251,319 | -6,285 |
| – Gross Longs: | 193,313 | 557,892 | 75,220 |
| – Gross Shorts: | 438,347 | 306,573 | 81,505 |
| – Long to Short Ratio: | 0.4 to 1 | 1.8 to 1 | 0.9 to 1 |
| NET POSITION TREND: | | | |
| – Strength Index Score (3 Year Range Pct): | 1.6 | 97.6 | 23.4 |
| – Strength Index Reading (3 Year Range): | Bearish-Extreme | Bullish-Extreme | Bearish |
| NET POSITION MOVEMENT INDEX: | | | |
| – 6-Week Change in Strength Index: | -12.5 | 10.2 | 6.7 |
COFFEE Futures:
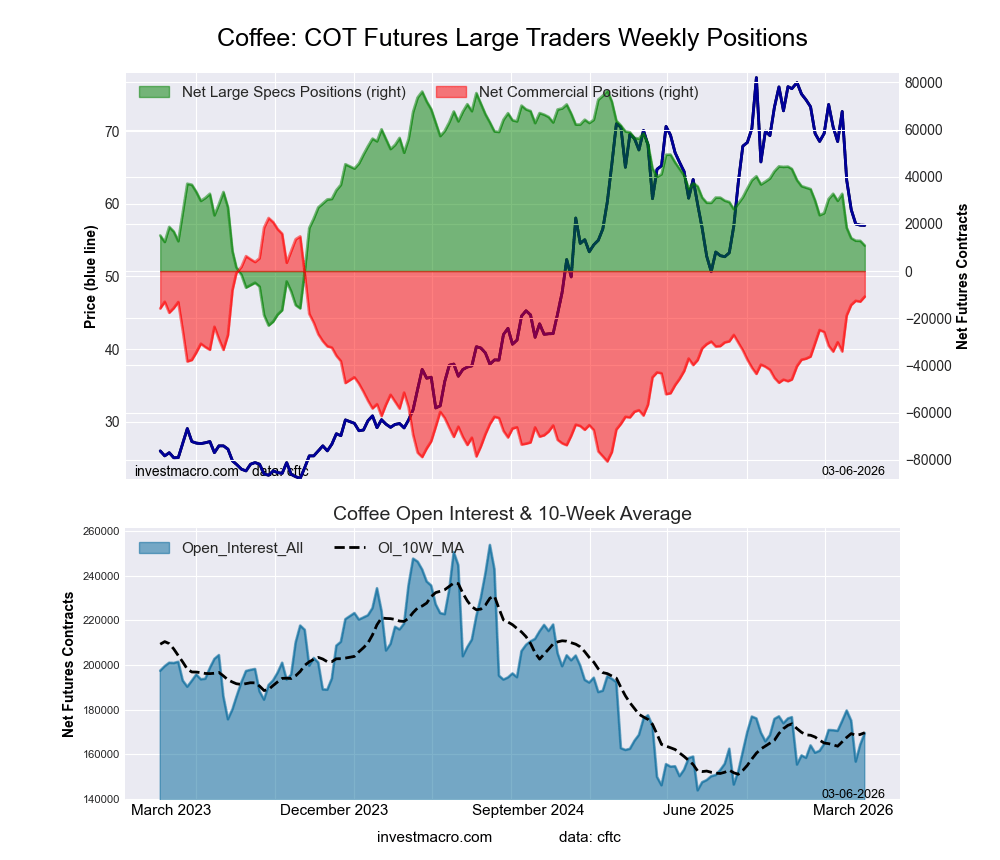 The COFFEE large speculator standing this week recorded a net position of 10,800 contracts in the data reported through Tuesday. This was a weekly decrease of -2,014 contracts from the previous week which had a total of 12,814 net contracts.
This week’s current strength score (the trader positioning range over the past three years, measured from 0 to 100) shows the speculators are currently Bearish with a score of 34.0 percent. The commercials are Bullish with a score of 67.7 percent and the small traders (not shown in chart) are Bearish-Extreme with a score of 18.4 percent.
Price Trend-Following Model: Strong Downtrend
Our weekly trend-following model classifies the current market price position as: Strong Downtrend.
| COFFEE Futures Statistics | SPECULATORS | COMMERCIALS | SMALL TRADERS |
| – Percent of Open Interest Longs: | 28.2 | 42.5 | 4.2 |
| – Percent of Open Interest Shorts: | 21.8 | 48.9 | 4.1 |
| – Net Position: | 10,800 | -10,840 | 40 |
| – Gross Longs: | 47,704 | 72,071 | 7,071 |
| – Gross Shorts: | 36,904 | 82,911 | 7,031 |
| – Long to Short Ratio: | 1.3 to 1 | 0.9 to 1 | 1.0 to 1 |
| NET POSITION TREND: | | | |
| – Strength Index Score (3 Year Range Pct): | 34.0 | 67.7 | 18.4 |
| – Strength Index Reading (3 Year Range): | Bearish | Bullish | Bearish-Extreme |
| NET POSITION MOVEMENT INDEX: | | | |
| – 6-Week Change in Strength Index: | -19.0 | 18.7 | -5.9 |
SOYBEANS Futures:
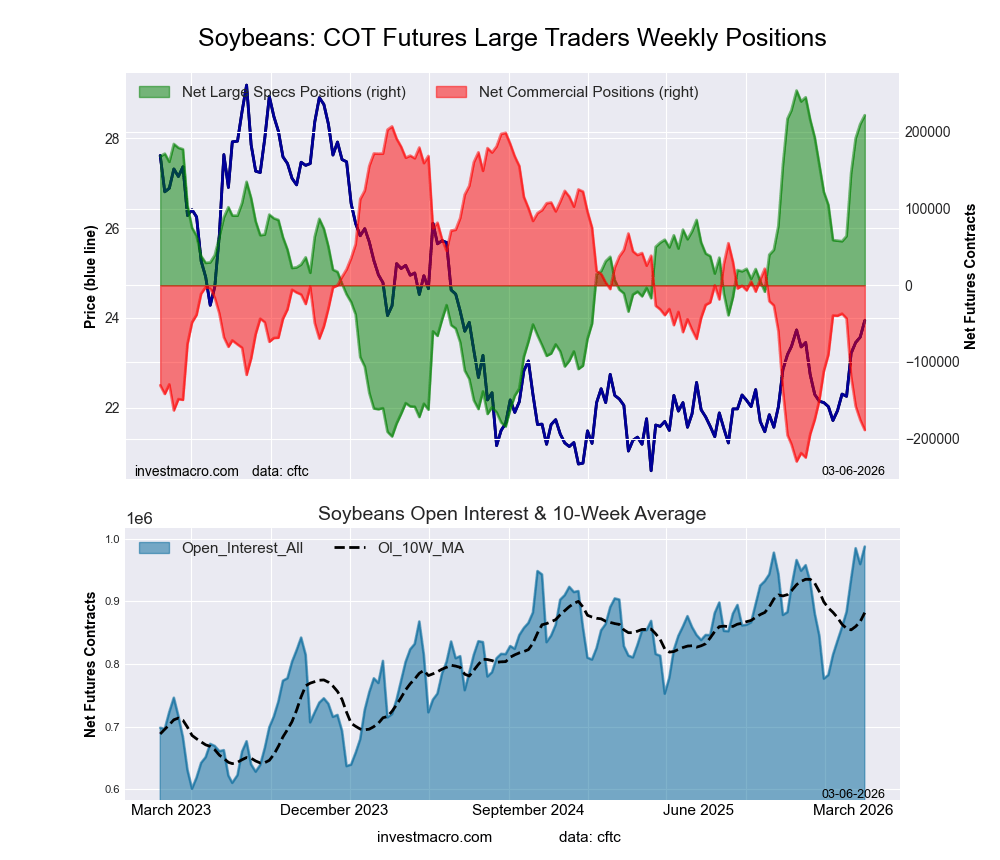 The SOYBEANS large speculator standing this week recorded a net position of 221,902 contracts in the data reported through Tuesday. This was a weekly lift of 11,630 contracts from the previous week which had a total of 210,272 net contracts.
This week’s current strength score (the trader positioning range over the past three years, measured from 0 to 100) shows the speculators are currently Bullish-Extreme with a score of 92.9 percent. The commercials are Bearish-Extreme with a score of 9.4 percent and the small traders (not shown in chart) are Bearish-Extreme with a score of 13.6 percent.
Price Trend-Following Model: Strong Uptrend
Our weekly trend-following model classifies the current market price position as: Strong Uptrend.
| SOYBEANS Futures Statistics | SPECULATORS | COMMERCIALS | SMALL TRADERS |
| – Percent of Open Interest Longs: | 30.7 | 42.3 | 4.9 |
| – Percent of Open Interest Shorts: | 8.2 | 61.5 | 8.2 |
| – Net Position: | 221,902 | -188,859 | -33,043 |
| – Gross Longs: | 303,059 | 418,119 | 48,014 |
| – Gross Shorts: | 81,157 | 606,978 | 81,057 |
| – Long to Short Ratio: | 3.7 to 1 | 0.7 to 1 | 0.6 to 1 |
| NET POSITION TREND: | | | |
| – Strength Index Score (3 Year Range Pct): | 92.9 | 9.4 | 13.6 |
| – Strength Index Reading (3 Year Range): | Bullish-Extreme | Bearish-Extreme | Bearish-Extreme |
| NET POSITION MOVEMENT INDEX: | | | |
| – 6-Week Change in Strength Index: | 36.3 | -34.1 | -44.9 |
SOYBEAN OIL Futures:
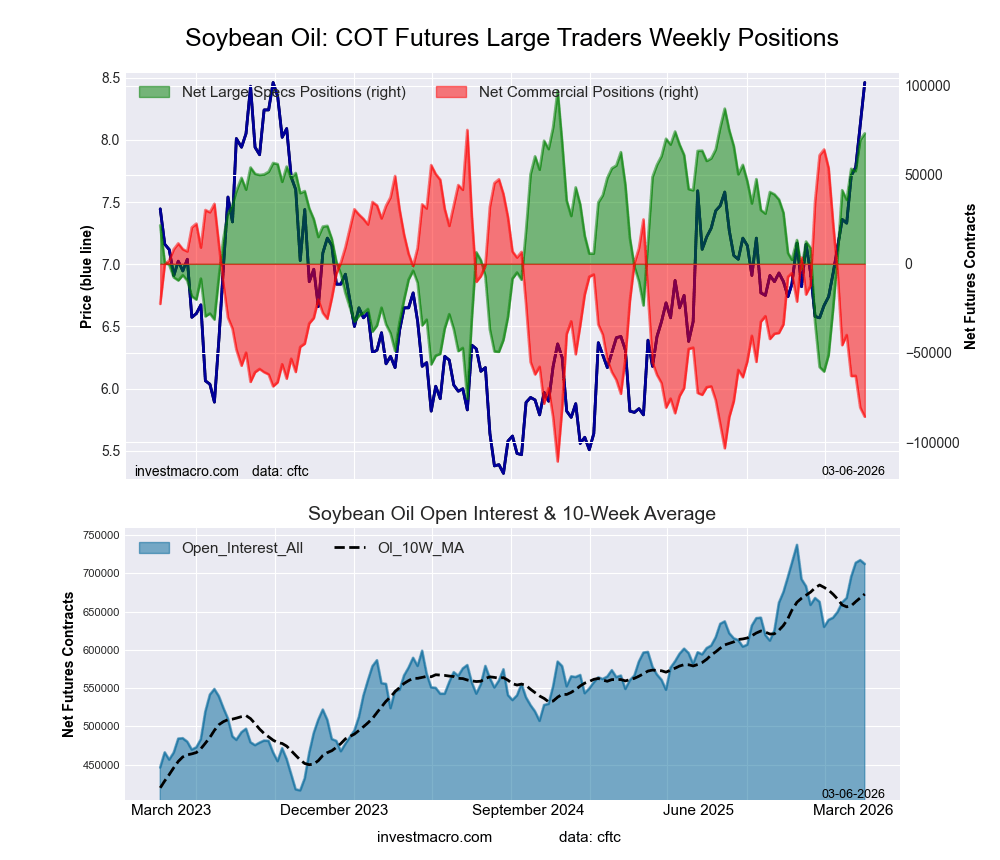 The SOYBEAN OIL large speculator standing this week recorded a net position of 73,189 contracts in the data reported through Tuesday. This was a weekly lift of 3,752 contracts from the previous week which had a total of 69,437 net contracts.
This week’s current strength score (the trader positioning range over the past three years, measured from 0 to 100) shows the speculators are currently Bullish-Extreme with a score of 86.1 percent. The commercials are Bearish-Extreme with a score of 13.5 percent and the small traders (not shown in chart) are Bullish-Extreme with a score of 81.0 percent.
Price Trend-Following Model: Strong Uptrend
Our weekly trend-following model classifies the current market price position as: Strong Uptrend.
| SOYBEAN OIL Futures Statistics | SPECULATORS | COMMERCIALS | SMALL TRADERS |
| – Percent of Open Interest Longs: | 23.8 | 46.0 | 5.5 |
| – Percent of Open Interest Shorts: | 13.5 | 58.0 | 3.7 |
| – Net Position: | 73,189 | -85,779 | 12,590 |
| – Gross Longs: | 169,509 | 327,390 | 39,288 |
| – Gross Shorts: | 96,320 | 413,169 | 26,698 |
| – Long to Short Ratio: | 1.8 to 1 | 0.8 to 1 | 1.5 to 1 |
| NET POSITION TREND: | | | |
| – Strength Index Score (3 Year Range Pct): | 86.1 | 13.5 | 81.0 |
| – Strength Index Reading (3 Year Range): | Bullish-Extreme | Bearish-Extreme | Bullish-Extreme |
| NET POSITION MOVEMENT INDEX: | | | |
| – 6-Week Change in Strength Index: | 39.7 | -43.4 | 60.1 |
SOYBEAN MEAL Futures:
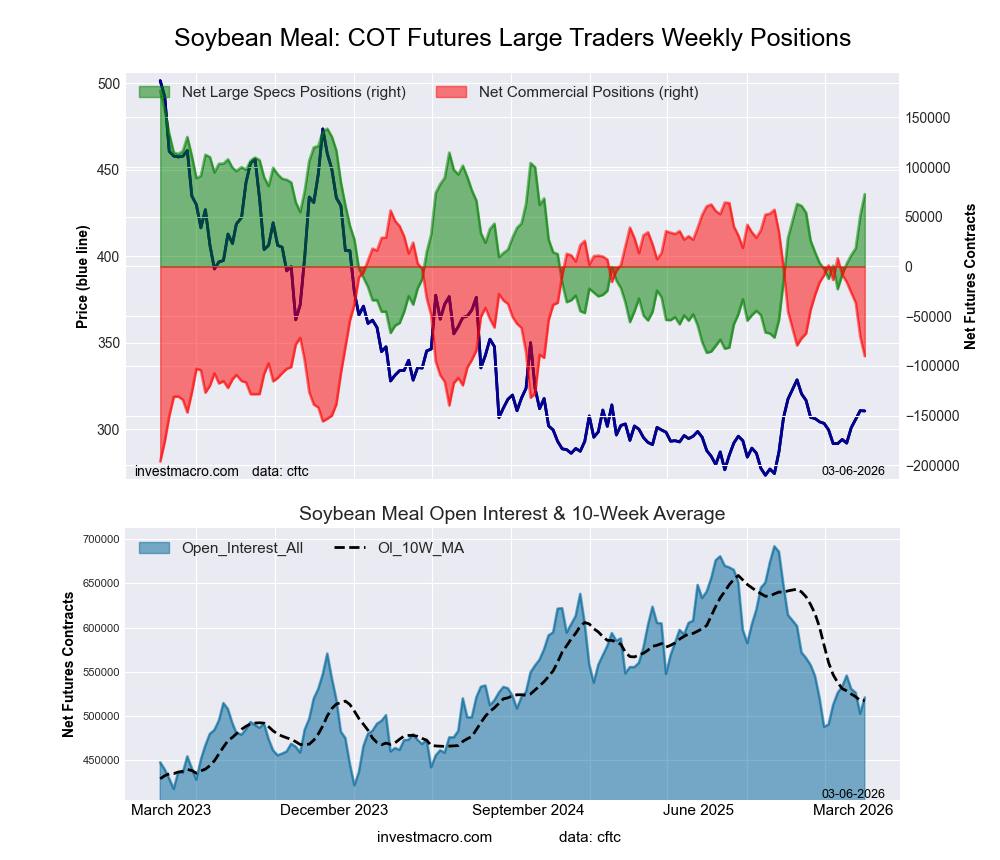 The SOYBEAN MEAL large speculator standing this week recorded a net position of 72,755 contracts in the data reported through Tuesday. This was a weekly advance of 21,920 contracts from the previous week which had a total of 50,835 net contracts.
This week’s current strength score (the trader positioning range over the past three years, measured from 0 to 100) shows the speculators are currently Bullish with a score of 65.3 percent. The commercials are Bearish with a score of 35.7 percent and the small traders (not shown in chart) are Bearish with a score of 42.0 percent.
Price Trend-Following Model: Downtrend
Our weekly trend-following model classifies the current market price position as: Downtrend.
| SOYBEAN MEAL Futures Statistics | SPECULATORS | COMMERCIALS | SMALL TRADERS |
| – Percent of Open Interest Longs: | 27.5 | 47.8 | 8.7 |
| – Percent of Open Interest Shorts: | 13.6 | 65.2 | 5.3 |
| – Net Position: | 72,755 | -90,226 | 17,471 |
| – Gross Longs: | 143,508 | 249,235 | 45,080 |
| – Gross Shorts: | 70,753 | 339,461 | 27,609 |
| – Long to Short Ratio: | 2.0 to 1 | 0.7 to 1 | 1.6 to 1 |
| NET POSITION TREND: | | | |
| – Strength Index Score (3 Year Range Pct): | 65.3 | 35.7 | 42.0 |
| – Strength Index Reading (3 Year Range): | Bullish | Bearish | Bearish |
| NET POSITION MOVEMENT INDEX: | | | |
| – 6-Week Change in Strength Index: | 39.1 | -41.0 | 16.3 |
LIVE CATTLE Futures:
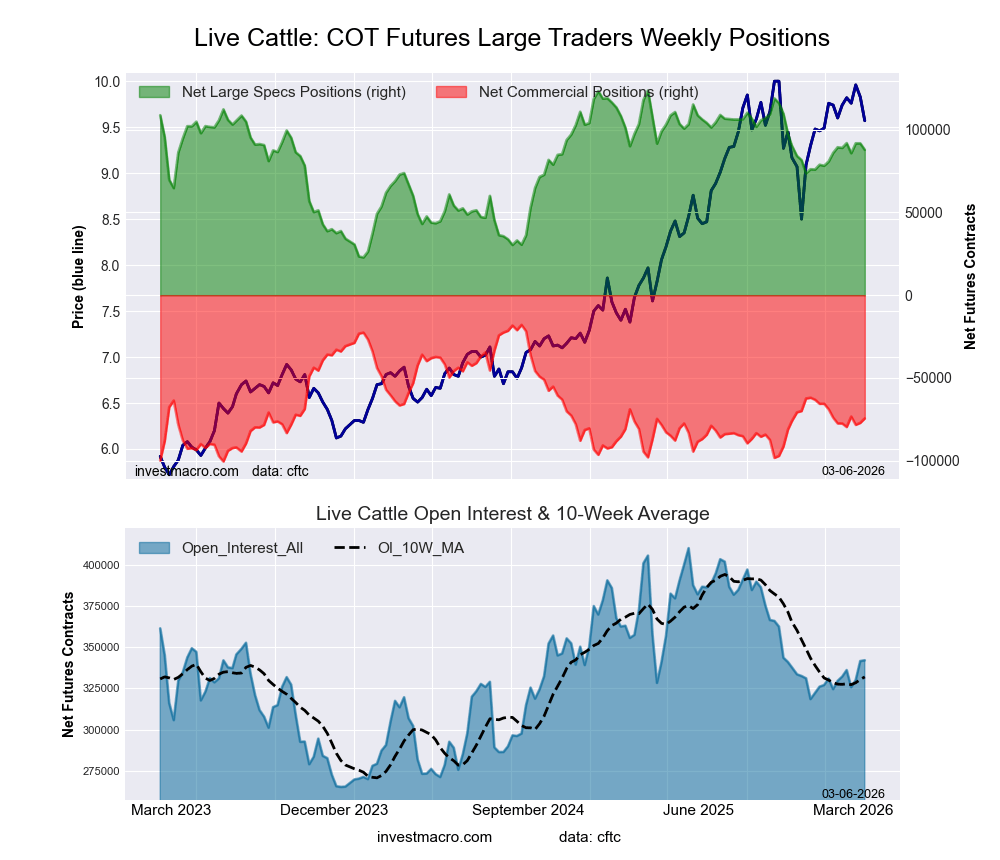 The LIVE CATTLE large speculator standing this week recorded a net position of 87,850 contracts in the data reported through Tuesday. This was a weekly decline of -3,896 contracts from the previous week which had a total of 91,746 net contracts.
This week’s current strength score (the trader positioning range over the past three years, measured from 0 to 100) shows the speculators are currently Bullish with a score of 64.5 percent. The commercials are Bearish with a score of 31.5 percent and the small traders (not shown in chart) are Bullish with a score of 51.4 percent.
Price Trend-Following Model: Uptrend
Our weekly trend-following model classifies the current market price position as: Uptrend.
| LIVE CATTLE Futures Statistics | SPECULATORS | COMMERCIALS | SMALL TRADERS |
| – Percent of Open Interest Longs: | 42.9 | 29.8 | 8.1 |
| – Percent of Open Interest Shorts: | 17.2 | 51.6 | 12.0 |
| – Net Position: | 87,850 | -74,493 | -13,357 |
| – Gross Longs: | 146,655 | 102,033 | 27,700 |
| – Gross Shorts: | 58,805 | 176,526 | 41,057 |
| – Long to Short Ratio: | 2.5 to 1 | 0.6 to 1 | 0.7 to 1 |
| NET POSITION TREND: | | | |
| – Strength Index Score (3 Year Range Pct): | 64.5 | 31.5 | 51.4 |
| – Strength Index Reading (3 Year Range): | Bullish | Bearish | Bullish |
| NET POSITION MOVEMENT INDEX: | | | |
| – 6-Week Change in Strength Index: | -1.5 | 3.6 | -5.2 |
LEAN HOGS Futures:
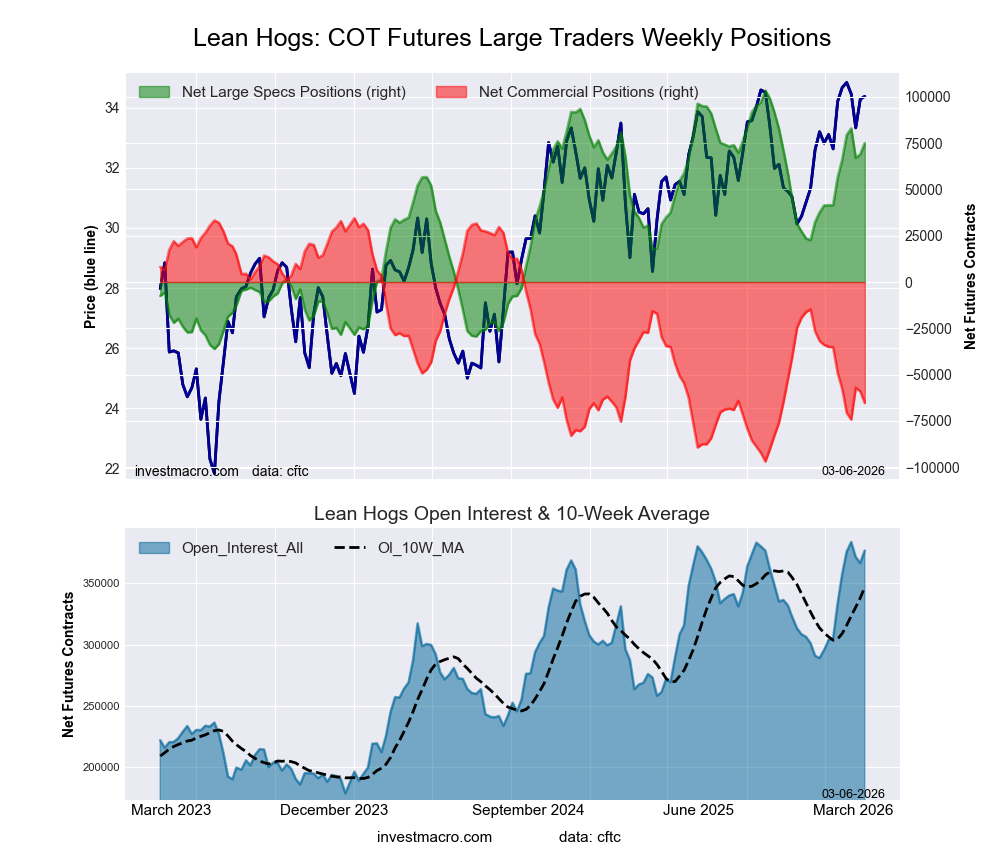 The LEAN HOGS large speculator standing this week recorded a net position of 74,970 contracts in the data reported through Tuesday. This was a weekly rise of 6,052 contracts from the previous week which had a total of 68,918 net contracts.
This week’s current strength score (the trader positioning range over the past three years, measured from 0 to 100) shows the speculators are currently Bullish with a score of 79.6 percent. The commercials are Bearish with a score of 24.0 percent and the small traders (not shown in chart) are Bearish-Extreme with a score of 19.3 percent.
Price Trend-Following Model: Uptrend
Our weekly trend-following model classifies the current market price position as: Uptrend.
| LEAN HOGS Futures Statistics | SPECULATORS | COMMERCIALS | SMALL TRADERS |
| – Percent of Open Interest Longs: | 40.5 | 29.5 | 5.4 |
| – Percent of Open Interest Shorts: | 20.6 | 46.9 | 8.0 |
| – Net Position: | 74,970 | -65,300 | -9,670 |
| – Gross Longs: | 152,501 | 111,253 | 20,445 |
| – Gross Shorts: | 77,531 | 176,553 | 30,115 |
| – Long to Short Ratio: | 2.0 to 1 | 0.6 to 1 | 0.7 to 1 |
| NET POSITION TREND: | | | |
| – Strength Index Score (3 Year Range Pct): | 79.6 | 24.0 | 19.3 |
| – Strength Index Reading (3 Year Range): | Bullish | Bearish | Bearish-Extreme |
| NET POSITION MOVEMENT INDEX: | | | |
| – 6-Week Change in Strength Index: | 13.3 | -12.4 | -14.0 |
COTTON Futures:
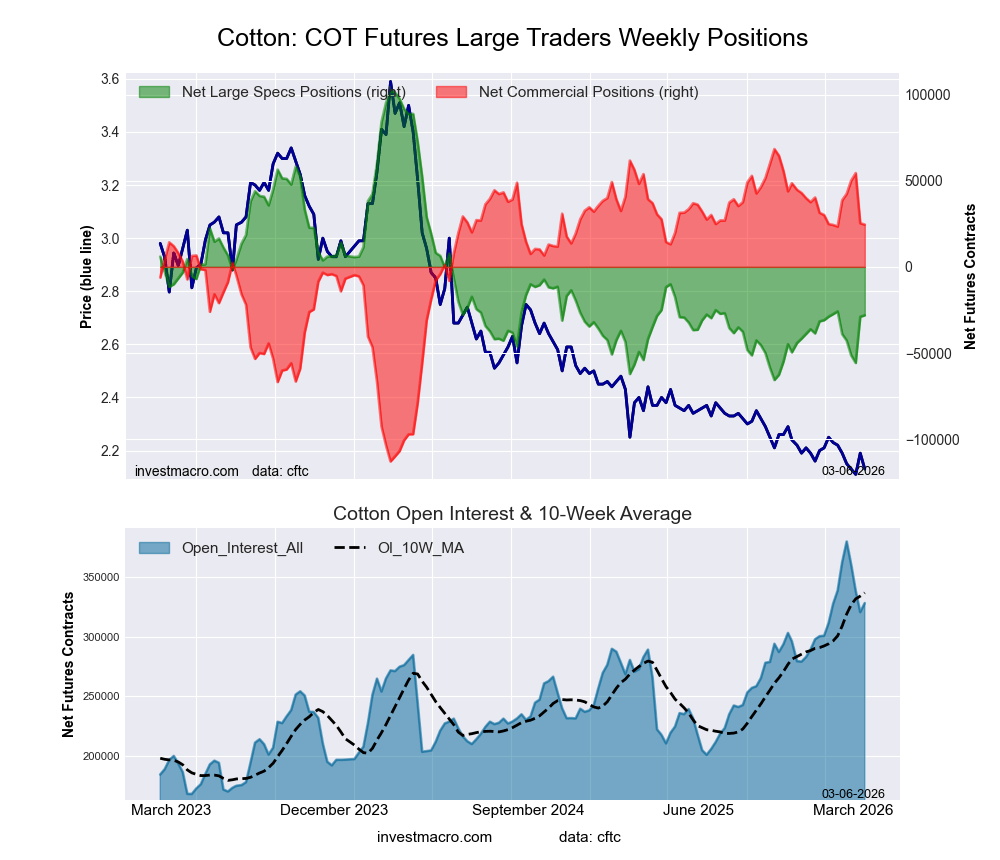 The COTTON large speculator standing this week recorded a net position of -28,097 contracts in the data reported through Tuesday. This was a weekly lift of 873 contracts from the previous week which had a total of -28,970 net contracts.
This week’s current strength score (the trader positioning range over the past three years, measured from 0 to 100) shows the speculators are currently Bearish with a score of 22.4 percent. The commercials are Bullish with a score of 75.8 percent and the small traders (not shown in chart) are Bearish with a score of 48.7 percent.
Price Trend-Following Model: Strong Downtrend
Our weekly trend-following model classifies the current market price position as: Strong Downtrend.
| COTTON Futures Statistics | SPECULATORS | COMMERCIALS | SMALL TRADERS |
| – Percent of Open Interest Longs: | 34.2 | 42.2 | 4.7 |
| – Percent of Open Interest Shorts: | 42.7 | 34.7 | 3.6 |
| – Net Position: | -28,097 | 24,523 | 3,574 |
| – Gross Longs: | 112,260 | 138,605 | 15,326 |
| – Gross Shorts: | 140,357 | 114,082 | 11,752 |
| – Long to Short Ratio: | 0.8 to 1 | 1.2 to 1 | 1.3 to 1 |
| NET POSITION TREND: | | | |
| – Strength Index Score (3 Year Range Pct): | 22.4 | 75.8 | 48.7 |
| – Strength Index Reading (3 Year Range): | Bearish | Bullish | Bearish |
| NET POSITION MOVEMENT INDEX: | | | |
| – 6-Week Change in Strength Index: | -1.4 | 0.6 | 8.5 |
COCOA Futures:
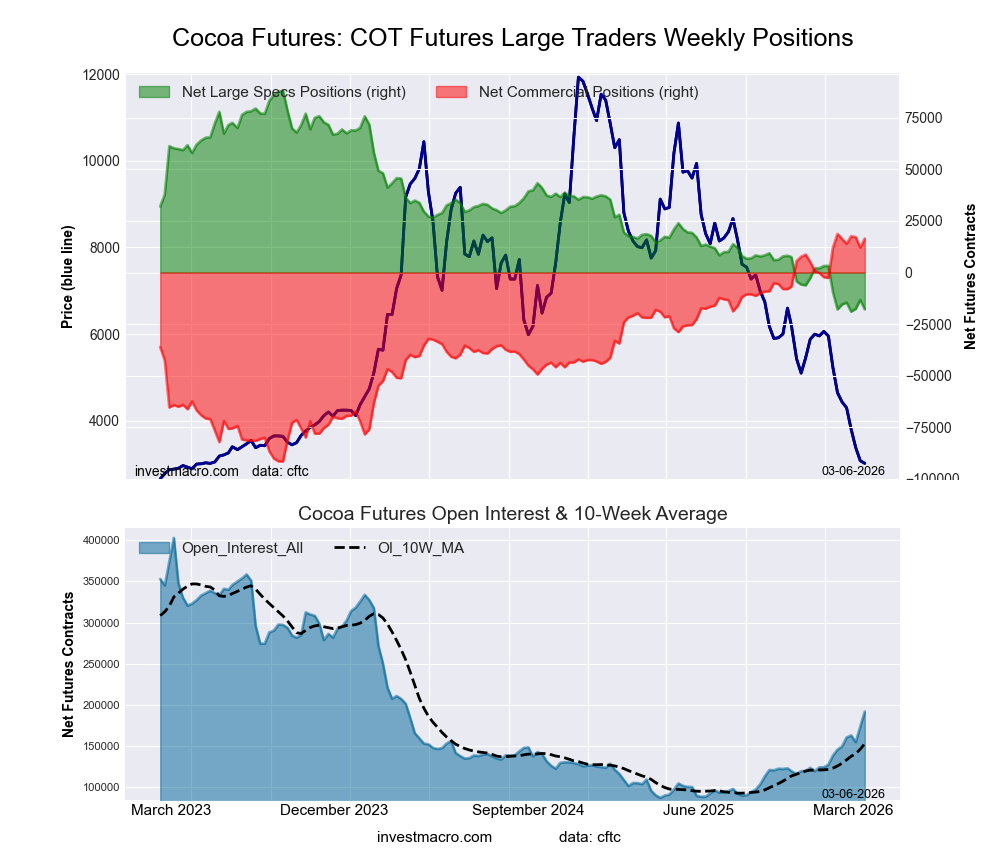 The COCOA large speculator standing this week recorded a net position of -17,830 contracts in the data reported through Tuesday. This was a weekly decline of -4,550 contracts from the previous week which had a total of -13,280 net contracts.
This week’s current strength score (the trader positioning range over the past three years, measured from 0 to 100) shows the speculators are currently Bearish-Extreme with a score of 1.0 percent. The commercials are Bullish-Extreme with a score of 98.0 percent and the small traders (not shown in chart) are Bearish with a score of 40.1 percent.
Price Trend-Following Model: Strong Downtrend
Our weekly trend-following model classifies the current market price position as: Strong Downtrend.
| COCOA Futures Statistics | SPECULATORS | COMMERCIALS | SMALL TRADERS |
| – Percent of Open Interest Longs: | 21.9 | 47.1 | 5.7 |
| – Percent of Open Interest Shorts: | 31.2 | 38.5 | 5.0 |
| – Net Position: | -17,830 | 16,480 | 1,350 |
| – Gross Longs: | 41,974 | 90,280 | 10,890 |
| – Gross Shorts: | 59,804 | 73,800 | 9,540 |
| – Long to Short Ratio: | 0.7 to 1 | 1.2 to 1 | 1.1 to 1 |
| NET POSITION TREND: | | | |
| – Strength Index Score (3 Year Range Pct): | 1.0 | 98.0 | 40.1 |
| – Strength Index Reading (3 Year Range): | Bearish-Extreme | Bullish-Extreme | Bearish |
| NET POSITION MOVEMENT INDEX: | | | |
| – 6-Week Change in Strength Index: | 0.0 | -2.0 | 20.9 |
WHEAT Futures:
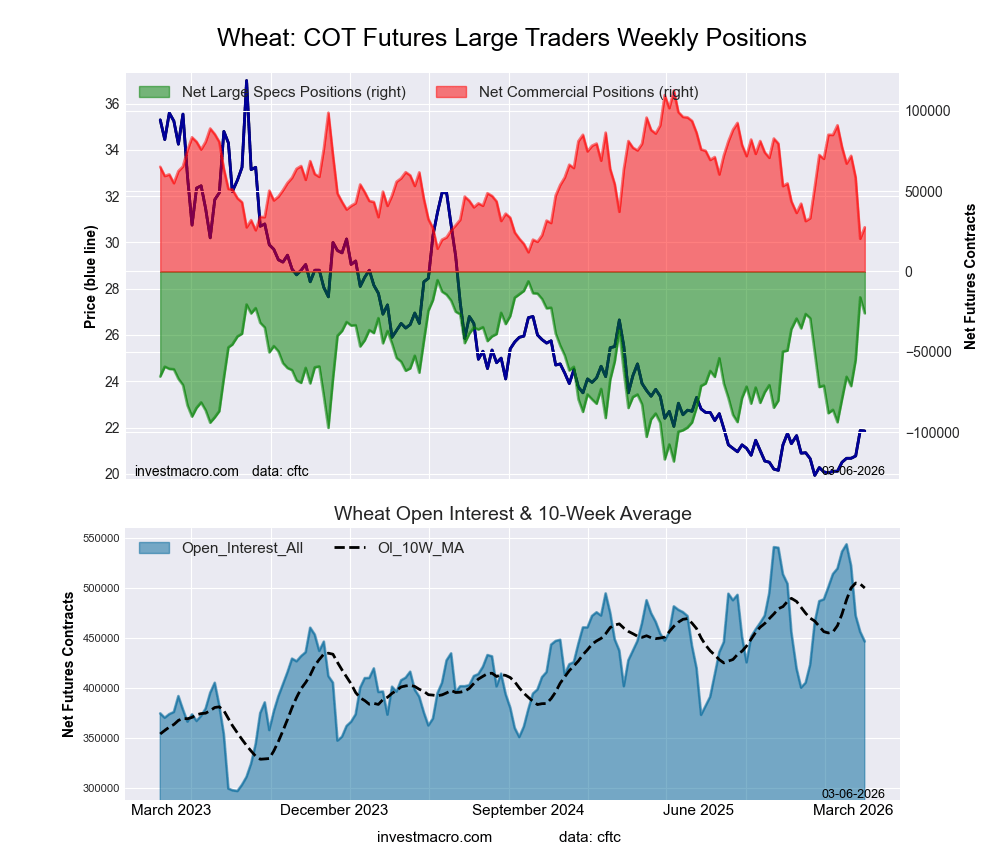 The WHEAT large speculator standing this week recorded a net position of -26,008 contracts in the data reported through Tuesday. This was a weekly reduction of -9,920 contracts from the previous week which had a total of -16,088 net contracts.
This week’s current strength score (the trader positioning range over the past three years, measured from 0 to 100) shows the speculators are currently Bullish-Extreme with a score of 81.7 percent. The commercials are Bearish-Extreme with a score of 15.5 percent and the small traders (not shown in chart) are Bearish with a score of 45.5 percent.
Price Trend-Following Model: Strong Uptrend
Our weekly trend-following model classifies the current market price position as: Strong Uptrend.
| WHEAT Futures Statistics | SPECULATORS | COMMERCIALS | SMALL TRADERS |
| – Percent of Open Interest Longs: | 27.2 | 32.8 | 7.4 |
| – Percent of Open Interest Shorts: | 33.0 | 26.7 | 7.7 |
| – Net Position: | -26,008 | 27,472 | -1,464 |
| – Gross Longs: | 121,504 | 146,569 | 32,849 |
| – Gross Shorts: | 147,512 | 119,097 | 34,313 |
| – Long to Short Ratio: | 0.8 to 1 | 1.2 to 1 | 1.0 to 1 |
| NET POSITION TREND: | | | |
| – Strength Index Score (3 Year Range Pct): | 81.7 | 15.5 | 45.5 |
| – Strength Index Reading (3 Year Range): | Bullish-Extreme | Bearish-Extreme | Bearish |
| NET POSITION MOVEMENT INDEX: | | | |
| – 6-Week Change in Strength Index: | 60.1 | -63.0 | -25.5 |
Article By InvestMacro – Receive our weekly COT Newsletter
*COT Report: The COT data, released weekly to the public each Friday, is updated through the most recent Tuesday (data is 3 days old) and shows a quick view of how large speculators or non-commercials (for-profit traders) were positioned in the futures markets.
The CFTC categorizes trader positions according to commercial hedgers (traders who use futures contracts for hedging as part of the business), non-commercials (large traders who speculate to realize trading profits) and nonreportable traders (usually small traders/speculators) as well as their open interest (contracts open in the market at time of reporting). See CFTC criteria here.