By InvestMacro
Here are the latest charts and statistics for the Commitment of Traders (COT) data published by the Commodities Futures Trading Commission (CFTC).
The latest COT data is updated through Tuesday March 3rd and shows a quick view of how large traders (for-profit speculators and commercial entities) were positioned in the futures markets.
Weekly Speculator Changes led by Brent Oil & Heating Oil
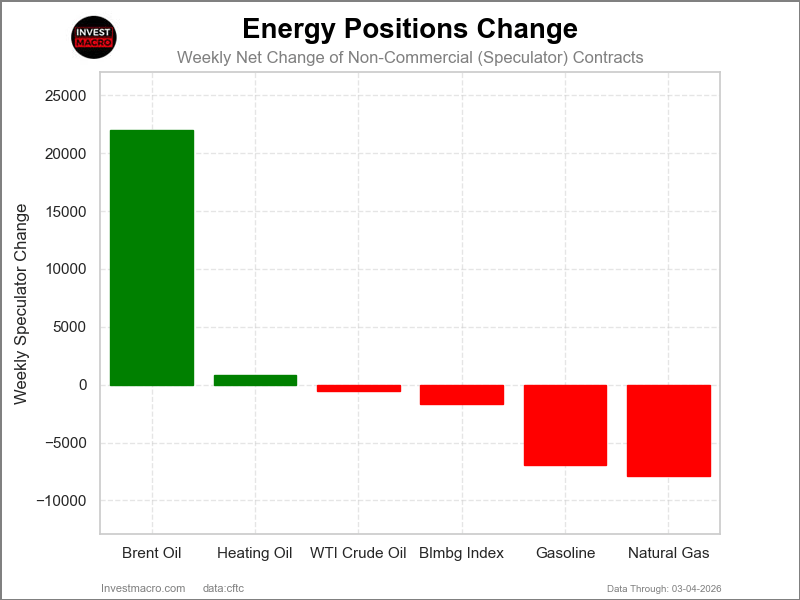
The COT energy market speculator bets were overall lower this week as just two out of the six energy markets we cover had higher positioning while the other four markets had lower speculator contracts.
Leading the gains for the energy markets through Tuesday was Brent Oil (22,025 contracts) with Heating Oil (824 contracts) also having a small positive week.
The markets with declines in speculator bets for the week were Natural Gas (-7,903 contracts), Gasoline (-6,975 contracts), the Bloomberg Index (-1,650 contracts) and with WTI Crude (-562 contracts) also seeing lower bets on the week.
Oil Markets lead Price Performance this week as all 6 Markets saw strong gains on Iran War
Leading the Energy markets this week was WTI Crude Oil, which jumped by approximately 33% over the last five days due to the Iran war. Following next was Heating Oil, which also jumped by over 30%. And Brent Crude Oil was not to be outdone with a gain of 26.17% over that period. Gasoline rose sharply by 20% in the past five days, while Natural Gas was up by 10.73%, and the Bloomberg Commodity Index rose by a strong 8.69%.
These sharp increases in the past week have now pushed all of these six Energy markets higher over the past 30 days and over the past 90 days, with the exception of Natural Gas, which is down by -5.06% in the past 30 days and is also lower by -1.70% in the past 90 days.
Energy Data:
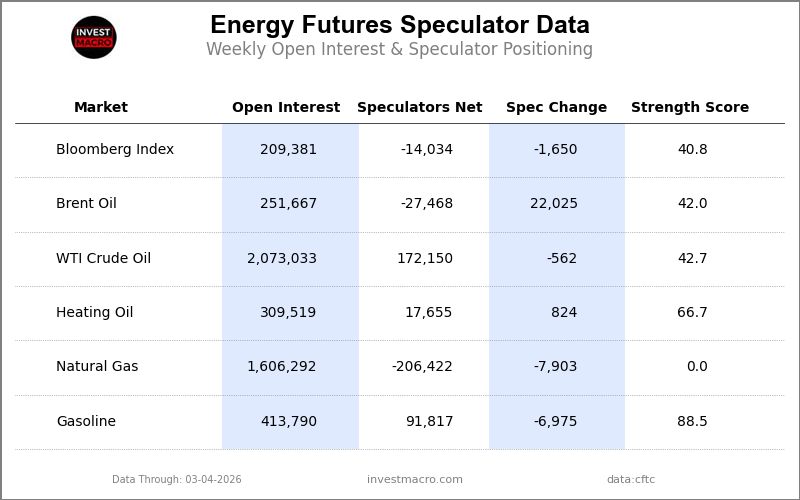
Legend: Weekly Speculators Change | Speculators Current Net Position | Speculators Strength Score compared to last 3-Years (0-100 range)
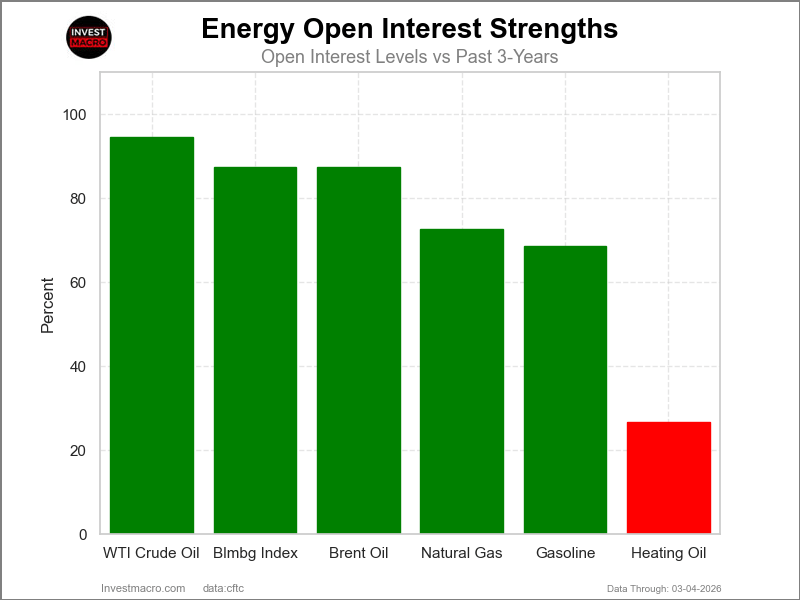
Strength Scores led by Gasoline & Heating Oil
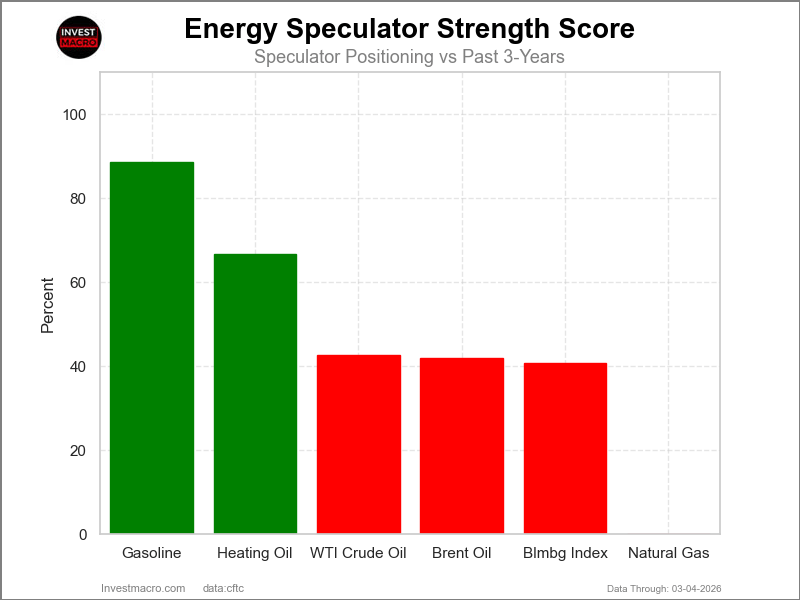
COT Strength Scores (a normalized measure of Speculator positions over a 3-Year range, from 0 to 100 where above 80 is Extreme-Bullish and below 20 is Extreme-Bearish) showed that Gasoline (88.5 percent) and Heating Oil (66.7 percent) lead the energy markets this week.
On the downside, Natural Gas (0.0 percent) comes in at the lowest strength level currently and is in Extreme-Bearish territory (below 20 percent). The next lowest strength score was the Bloomberg Commodity Index (40.8 percent).
Strength Statistics:
WTI Crude Oil (42.7 percent) vs WTI Crude Oil previous week (42.8 percent)
Brent Crude Oil (42.0 percent) vs Brent Crude Oil previous week (10.6 percent)
Natural Gas (0.0 percent) vs Natural Gas previous week (5.1 percent)
Gasoline (88.5 percent) vs Gasoline previous week (96.2 percent)
Heating Oil (66.7 percent) vs Heating Oil previous week (65.6 percent)
Bloomberg Commodity Index (40.8 percent) vs Bloomberg Commodity Index previous week (48.6 percent)
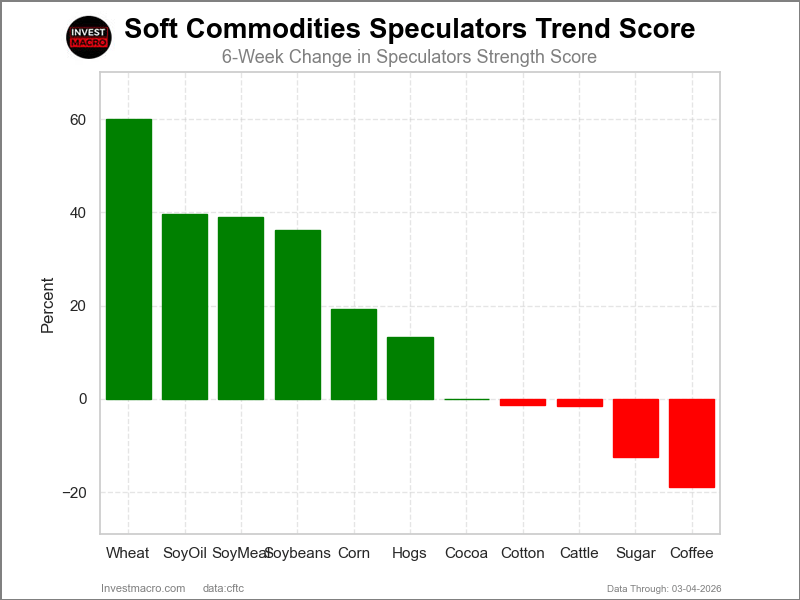
WTI Crude & Gasoline top the 6-Week Strength Trends
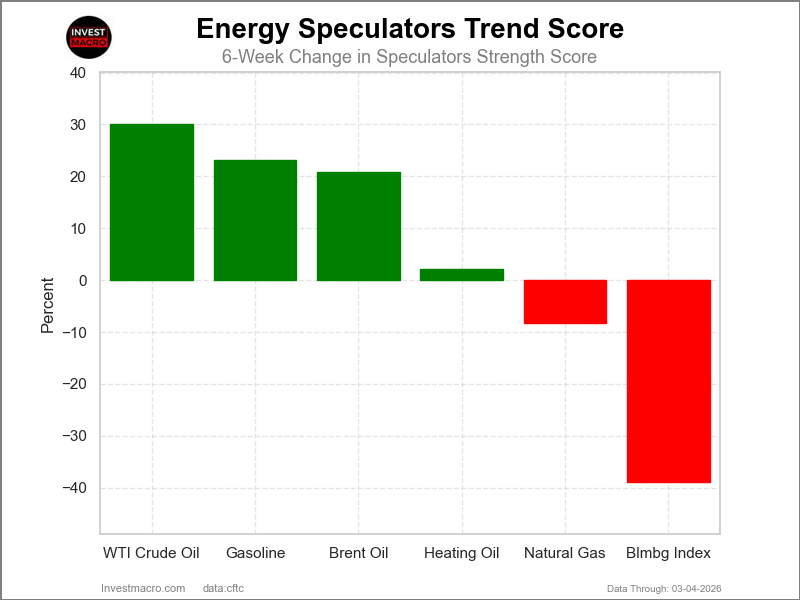
COT Strength Score Trends (or move index, calculates the 6-week changes in strength scores) showed that WTI Crude (30.1 percent) and Gasoline (23.2 percent) lead the past six weeks trends for the energy markets.
The Bloomberg Index (-38.9 percent) leads the downside trend scores currently with Natural Gas (-8.3 percent) as the next market with lower trend scores.
Move Statistics:
WTI Crude Oil (30.1 percent) vs WTI Crude Oil previous week (36.9 percent)
Brent Crude Oil (20.9 percent) vs Brent Crude Oil previous week (-22.3 percent)
Natural Gas (-8.3 percent) vs Natural Gas previous week (-8.3 percent)
Gasoline (23.2 percent) vs Gasoline previous week (29.0 percent)
Heating Oil (2.1 percent) vs Heating Oil previous week (3.1 percent)
Bloomberg Commodity Index (-38.9 percent) vs Bloomberg Commodity Index previous week (-31.0 percent)
Individual COT Market Charts:
WTI Crude Oil Futures:
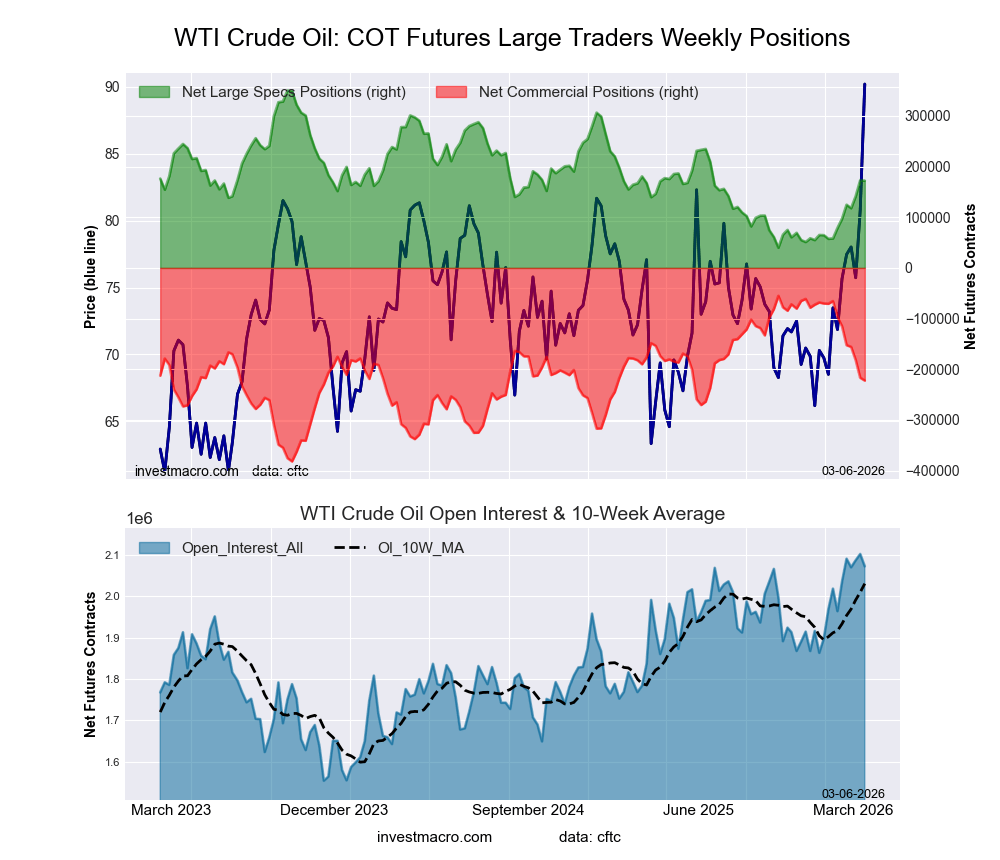 The WTI Crude Oil Futures large speculator standing this week reached a net position of 172,150 contracts in the data reported through Tuesday. This was a weekly decline of -562 contracts from the previous week which had a total of 172,712 net contracts.
This week’s current strength score (the trader positioning range over the past three years, measured from 0 to 100) shows the speculators are currently Bearish with a score of 42.7 percent. The commercials are Bearish with a score of 48.8 percent and the small traders (not shown in chart) are Bullish-Extreme with a score of 100.0 percent.
Price Trend-Following Model: Strong Uptrend
Our weekly trend-following model classifies the current market price position as: Strong Uptrend.
| WTI Crude Oil Futures Statistics | SPECULATORS | COMMERCIALS | SMALL TRADERS |
| – Percent of Open Interest Longs: | 17.1 | 40.7 | 4.3 |
| – Percent of Open Interest Shorts: | 8.8 | 51.4 | 1.9 |
| – Net Position: | 172,150 | -222,327 | 50,177 |
| – Gross Longs: | 355,158 | 842,957 | 89,225 |
| – Gross Shorts: | 183,008 | 1,065,284 | 39,048 |
| – Long to Short Ratio: | 1.9 to 1 | 0.8 to 1 | 2.3 to 1 |
| NET POSITION TREND: | |||
| – Strength Index Score (3 Year Range Pct): | 42.7 | 48.8 | 100.0 |
| – Strength Index Reading (3 Year Range): | Bearish | Bearish | Bullish-Extreme |
| NET POSITION MOVEMENT INDEX: | |||
| – 6-Week Change in Strength Index: | 30.1 | -38.3 | 63.0 |
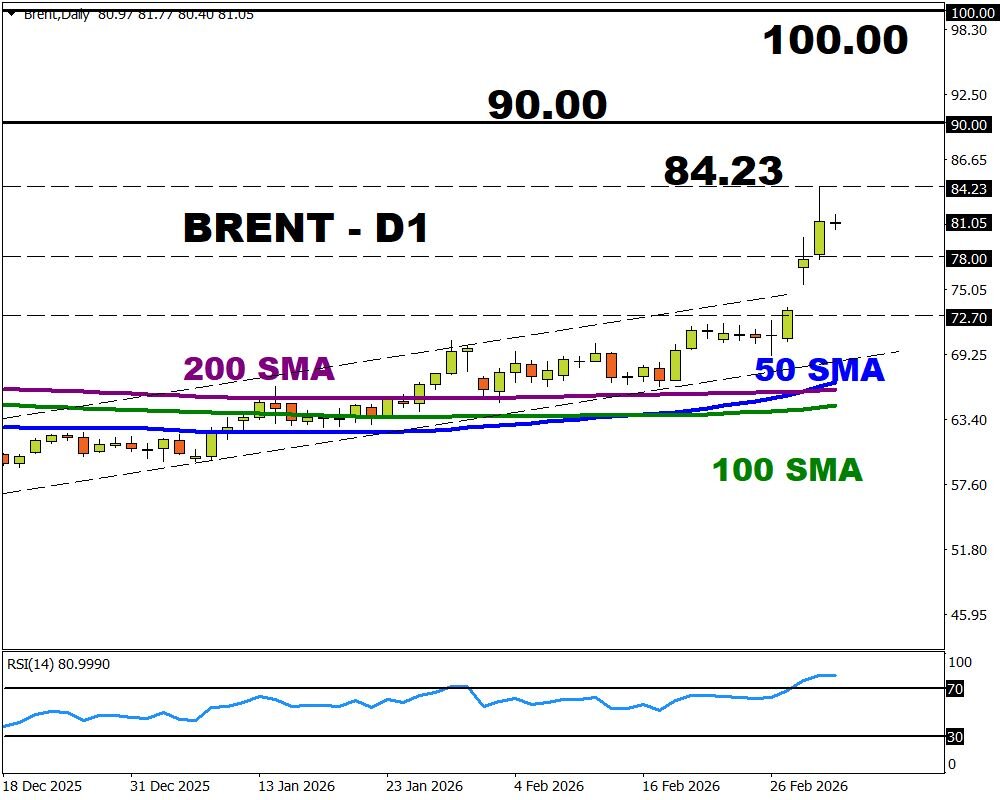
Brent Crude Oil Futures:
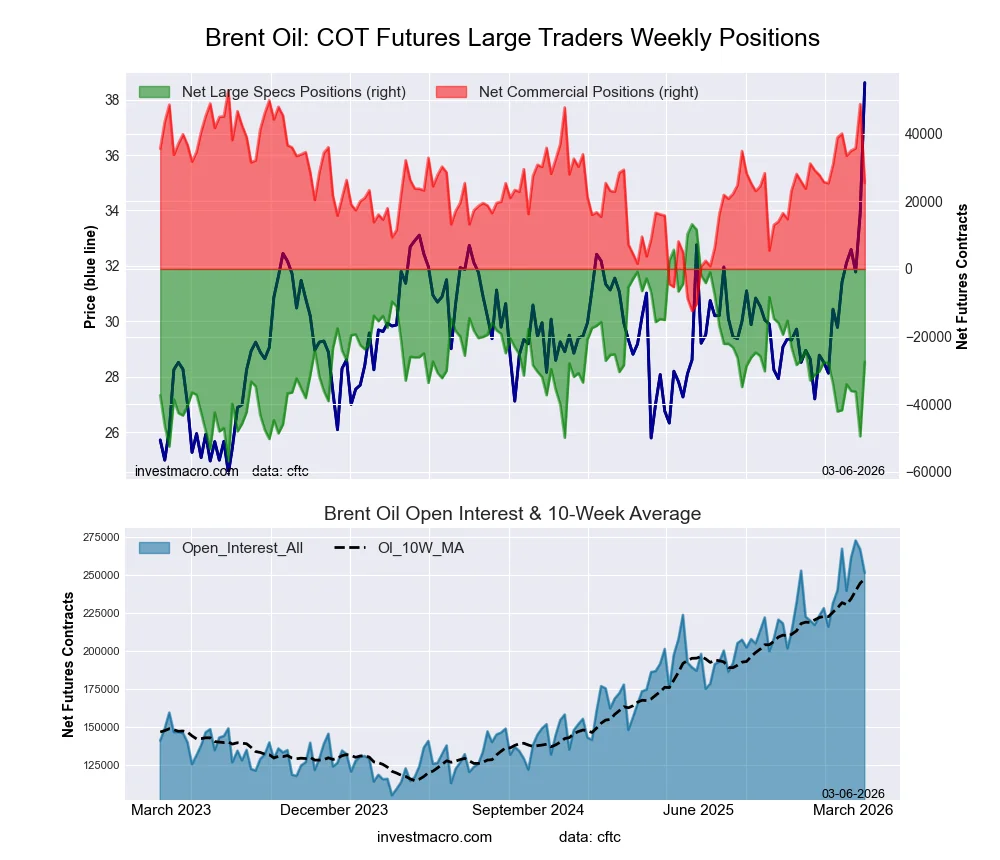 The Brent Crude Oil Futures large speculator standing this week reached a net position of -27,468 contracts in the data reported through Tuesday. This was a weekly increase of 22,025 contracts from the previous week which had a total of -49,493 net contracts.
This week’s current strength score (the trader positioning range over the past three years, measured from 0 to 100) shows the speculators are currently Bearish with a score of 42.0 percent. The commercials are Bullish with a score of 58.1 percent and the small traders (not shown in chart) are Bullish with a score of 59.3 percent.
Price Trend-Following Model: Strong Uptrend
Our weekly trend-following model classifies the current market price position as: Strong Uptrend.
| Brent Crude Oil Futures Statistics | SPECULATORS | COMMERCIALS | SMALL TRADERS |
| – Percent of Open Interest Longs: | 25.4 | 39.5 | 3.4 |
| – Percent of Open Interest Shorts: | 36.4 | 29.4 | 2.6 |
| – Net Position: | -27,468 | 25,400 | 2,068 |
| – Gross Longs: | 64,040 | 99,338 | 8,498 |
| – Gross Shorts: | 91,508 | 73,938 | 6,430 |
| – Long to Short Ratio: | 0.7 to 1 | 1.3 to 1 | 1.3 to 1 |
| NET POSITION TREND: | |||
| – Strength Index Score (3 Year Range Pct): | 42.0 | 58.1 | 59.3 |
| – Strength Index Reading (3 Year Range): | Bearish | Bullish | Bullish |
| NET POSITION MOVEMENT INDEX: | |||
| – 6-Week Change in Strength Index: | 20.9 | -20.7 | -14.1 |
Natural Gas Futures:
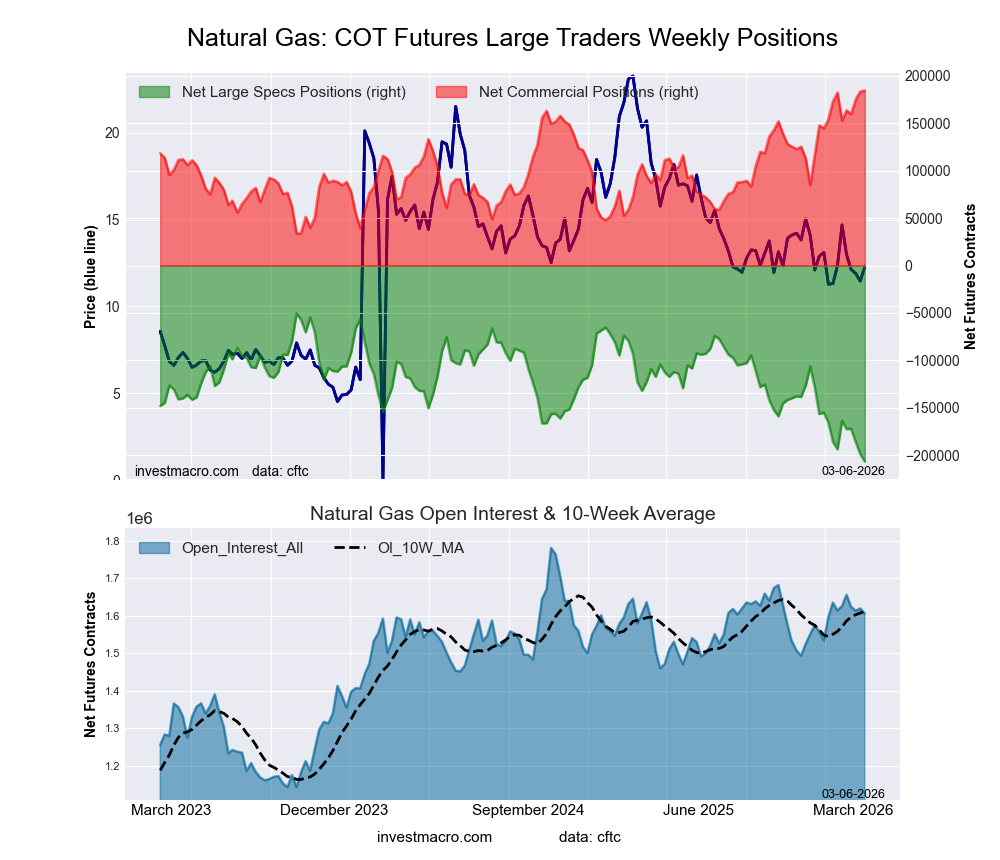 The Natural Gas Futures large speculator standing this week reached a net position of -206,422 contracts in the data reported through Tuesday. This was a weekly decline of -7,903 contracts from the previous week which had a total of -198,519 net contracts.
This week’s current strength score (the trader positioning range over the past three years, measured from 0 to 100) shows the speculators are currently Bearish-Extreme with a score of 0.0 percent. The commercials are Bullish-Extreme with a score of 100.0 percent and the small traders (not shown in chart) are Bullish with a score of 58.9 percent.
Price Trend-Following Model: Downtrend
Our weekly trend-following model classifies the current market price position as: Downtrend.
| Natural Gas Futures Statistics | SPECULATORS | COMMERCIALS | SMALL TRADERS |
| – Percent of Open Interest Longs: | 13.1 | 37.8 | 3.9 |
| – Percent of Open Interest Shorts: | 26.0 | 26.4 | 2.5 |
| – Net Position: | -206,422 | 184,360 | 22,062 |
| – Gross Longs: | 210,477 | 607,907 | 62,972 |
| – Gross Shorts: | 416,899 | 423,547 | 40,910 |
| – Long to Short Ratio: | 0.5 to 1 | 1.4 to 1 | 1.5 to 1 |
| NET POSITION TREND: | |||
| – Strength Index Score (3 Year Range Pct): | 0.0 | 100.0 | 58.9 |
| – Strength Index Reading (3 Year Range): | Bearish-Extreme | Bullish-Extreme | Bullish |
| NET POSITION MOVEMENT INDEX: | |||
| – 6-Week Change in Strength Index: | -8.3 | 1.5 | 26.9 |
Gasoline Blendstock Futures:
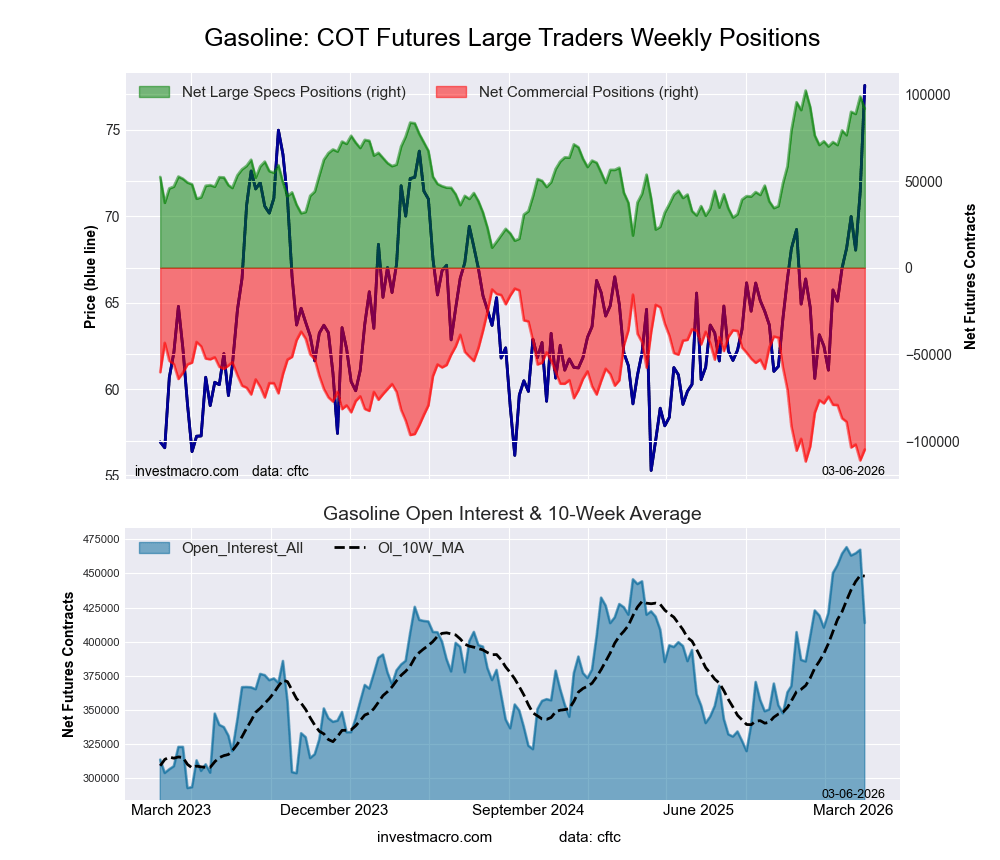 The Gasoline Blendstock Futures large speculator standing this week reached a net position of 91,817 contracts in the data reported through Tuesday. This was a weekly decrease of -6,975 contracts from the previous week which had a total of 98,792 net contracts.
This week’s current strength score (the trader positioning range over the past three years, measured from 0 to 100) shows the speculators are currently Bullish-Extreme with a score of 88.5 percent. The commercials are Bearish-Extreme with a score of 6.9 percent and the small traders (not shown in chart) are Bullish-Extreme with a score of 96.2 percent.
Price Trend-Following Model: Strong Uptrend
Our weekly trend-following model classifies the current market price position as: Strong Uptrend.
| Nasdaq Mini Futures Statistics | SPECULATORS | COMMERCIALS | SMALL TRADERS |
| – Percent of Open Interest Longs: | 26.9 | 42.8 | 6.1 |
| – Percent of Open Interest Shorts: | 4.7 | 68.2 | 2.9 |
| – Net Position: | 91,817 | -104,850 | 13,033 |
| – Gross Longs: | 111,324 | 177,263 | 25,236 |
| – Gross Shorts: | 19,507 | 282,113 | 12,203 |
| – Long to Short Ratio: | 5.7 to 1 | 0.6 to 1 | 2.1 to 1 |
| NET POSITION TREND: | |||
| – Strength Index Score (3 Year Range Pct): | 88.5 | 6.9 | 96.2 |
| – Strength Index Reading (3 Year Range): | Bullish-Extreme | Bearish-Extreme | Bullish-Extreme |
| NET POSITION MOVEMENT INDEX: | |||
| – 6-Week Change in Strength Index: | 23.2 | -25.7 | 26.3 |
#2 Heating Oil NY-Harbor Futures:
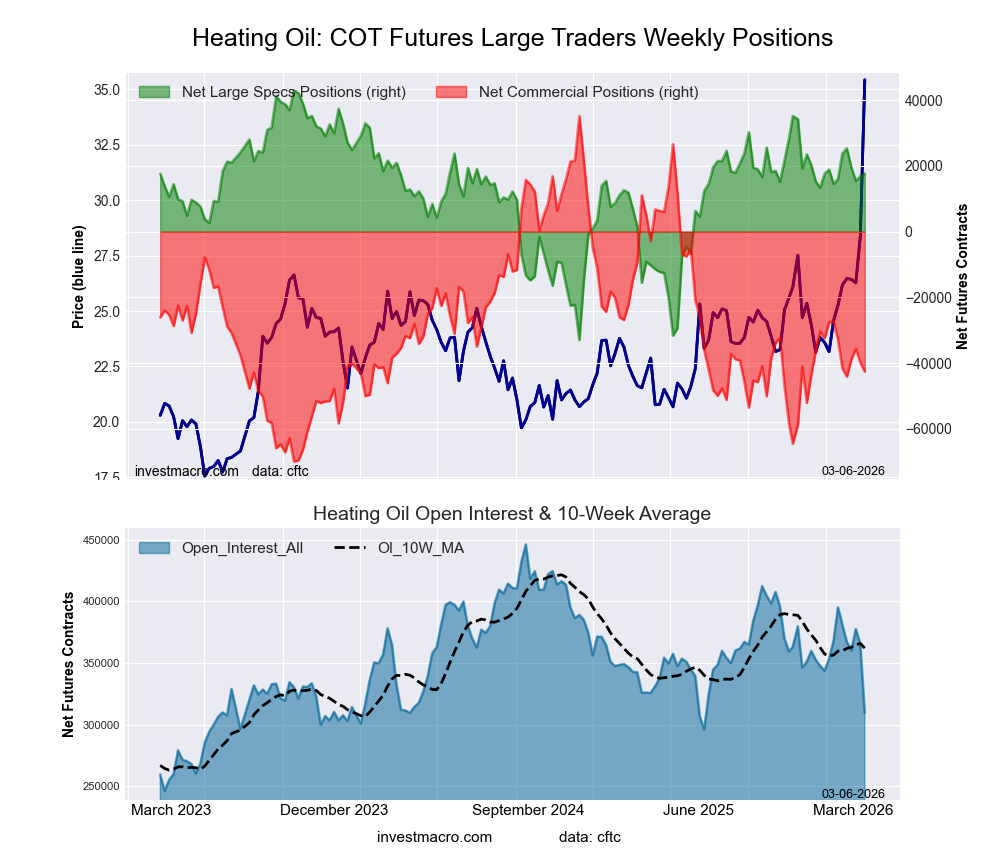 The #2 Heating Oil NY-Harbor Futures large speculator standing this week reached a net position of 17,655 contracts in the data reported through Tuesday. This was a weekly increase of 824 contracts from the previous week which had a total of 16,831 net contracts.
This week’s current strength score (the trader positioning range over the past three years, measured from 0 to 100) shows the speculators are currently Bullish with a score of 66.7 percent. The commercials are Bearish with a score of 26.0 percent and the small traders (not shown in chart) are Bullish-Extreme with a score of 86.3 percent.
Price Trend-Following Model: Strong Uptrend
Our weekly trend-following model classifies the current market price position as: Strong Uptrend.
| Heating Oil Futures Statistics | SPECULATORS | COMMERCIALS | SMALL TRADERS |
| – Percent of Open Interest Longs: | 18.3 | 45.4 | 15.4 |
| – Percent of Open Interest Shorts: | 12.6 | 59.1 | 7.3 |
| – Net Position: | 17,655 | -42,602 | 24,947 |
| – Gross Longs: | 56,514 | 140,463 | 47,560 |
| – Gross Shorts: | 38,859 | 183,065 | 22,613 |
| – Long to Short Ratio: | 1.5 to 1 | 0.8 to 1 | 2.1 to 1 |
| NET POSITION TREND: | |||
| – Strength Index Score (3 Year Range Pct): | 66.7 | 26.0 | 86.3 |
| – Strength Index Reading (3 Year Range): | Bullish | Bearish | Bullish-Extreme |
| NET POSITION MOVEMENT INDEX: | |||
| – 6-Week Change in Strength Index: | 2.1 | -9.2 | 22.0 |
Bloomberg Commodity Index Futures:
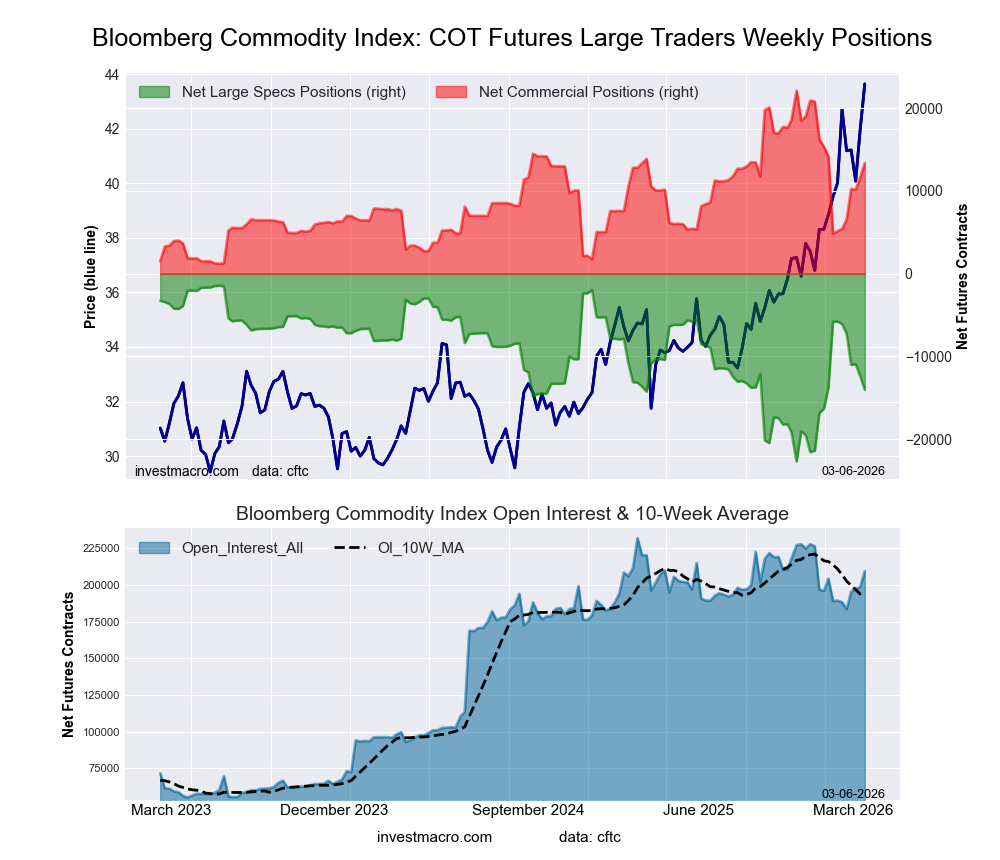 The Bloomberg Commodity Index Futures large speculator standing this week reached a net position of -14,034 contracts in the data reported through Tuesday. This was a weekly reduction of -1,650 contracts from the previous week which had a total of -12,384 net contracts.
This week’s current strength score (the trader positioning range over the past three years, measured from 0 to 100) shows the speculators are currently Bearish with a score of 40.8 percent. The commercials are Bullish with a score of 58.1 percent and the small traders (not shown in chart) are Bearish with a score of 49.9 percent.
Price Trend-Following Model: Strong Uptrend
Our weekly trend-following model classifies the current market price position as: Strong Uptrend.
| Bloomberg Index Futures Statistics | SPECULATORS | COMMERCIALS | SMALL TRADERS |
| – Percent of Open Interest Longs: | 31.6 | 66.9 | 0.4 |
| – Percent of Open Interest Shorts: | 38.3 | 60.5 | 0.0 |
| – Net Position: | -14,034 | 13,355 | 679 |
| – Gross Longs: | 66,250 | 140,036 | 759 |
| – Gross Shorts: | 80,284 | 126,681 | 80 |
| – Long to Short Ratio: | 0.8 to 1 | 1.1 to 1 | 9.5 to 1 |
| NET POSITION TREND: | |||
| – Strength Index Score (3 Year Range Pct): | 40.8 | 58.1 | 49.9 |
| – Strength Index Reading (3 Year Range): | Bearish | Bullish | Bearish |
| NET POSITION MOVEMENT INDEX: | |||
| – 6-Week Change in Strength Index: | -38.9 | 39.2 | 1.9 |
Article By InvestMacro – Receive our weekly COT Newsletter
*COT Report: The COT data, released weekly to the public each Friday, is updated through the most recent Tuesday (data is 3 days old) and shows a quick view of how large speculators or non-commercials (for-profit traders) were positioned in the futures markets.
The CFTC categorizes trader positions according to commercial hedgers (traders who use futures contracts for hedging as part of the business), non-commercials (large traders who speculate to realize trading profits) and nonreportable traders (usually small traders/speculators) as well as their open interest (contracts open in the market at time of reporting). See CFTC criteria here.