
By InvestMacro | COT | Data Tables | COT Leaders | Downloads | COT Newsletter
Here are the latest charts and statistics for the Commitment of Traders (COT) reports data published by the Commodities Futures Trading Commission (CFTC).
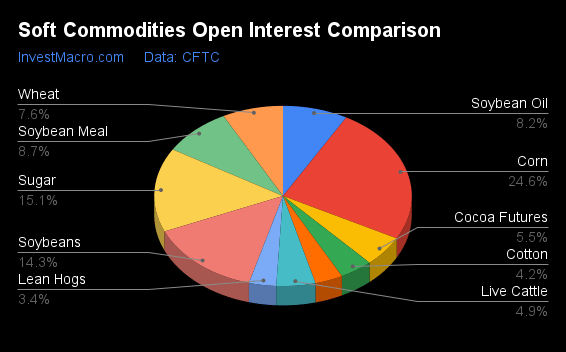
The latest COT data is updated through Tuesday October 24th and shows a quick view of how large traders (for-profit speculators and commercial entities) were positioned in the futures markets.
Weekly Speculator Changes led by Soybean Meal & Coffee
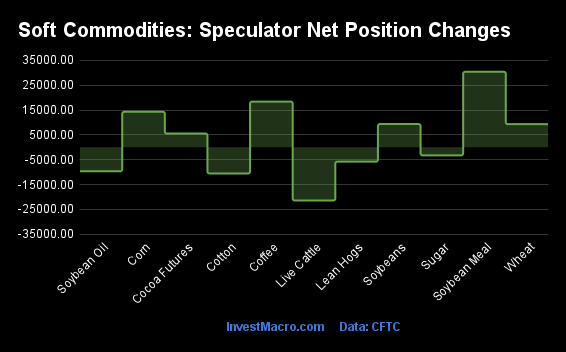
The COT soft commodities markets speculator bets were higher this week as six out of the eleven softs markets we cover had higher positioning while the other five markets had lower speculator contracts.
Leading the gains for the softs markets was Soybean Meal (30,388 contracts) with Coffee (18,396 contracts), Corn (14,274 contracts), Soybeans (9,349 contracts), Wheat (9,296 contracts and Cocoa (5,528 contracts) also showing positive weeks.
The markets with the declines in speculator bets this week were Live Cattle (-21,450 contracts) with Cotton (-10,557 contracts), Soybean Oil (-9,666 contracts), Lean Hogs (-5,806 contracts) and Sugar (-3,264 contracts) also registering lower bets on the week.
| Oct-24-2023 | OI | OI-Index | Spec-Net | Spec-Index | Com-Net | COM-Index | Smalls-Net | Smalls-Index |
|---|---|---|---|---|---|---|---|---|
| WTI Crude | 1,628,044 | 21 | 300,765 | 41 | -340,958 | 59 | 40,193 | 60 |
| Gold | 463,476 | 19 | 149,385 | 43 | -165,873 | 60 | 16,488 | 22 |
| Silver | 123,980 | 12 | 24,332 | 53 | -34,570 | 52 | 10,238 | 23 |
| Copper | 224,704 | 62 | -20,760 | 13 | 21,401 | 89 | -641 | 14 |
| Palladium | 22,459 | 100 | -11,240 | 2 | 11,085 | 98 | 155 | 51 |
| Platinum | 84,610 | 93 | -480 | 14 | -4,832 | 83 | 5,312 | 39 |
| Natural Gas | 1,211,450 | 51 | -70,272 | 47 | 51,221 | 57 | 19,051 | 25 |
| Brent | 127,094 | 8 | -38,171 | 37 | 34,548 | 63 | 3,623 | 60 |
| Heating Oil | 322,791 | 45 | 31,988 | 81 | -51,471 | 28 | 19,483 | 63 |
| Soybeans | 814,726 | 63 | 36,454 | 5 | -24,483 | 88 | -11,971 | 75 |
| Corn | 1,401,898 | 27 | -48,280 | 11 | 83,034 | 90 | -34,754 | 83 |
| Coffee | 199,646 | 18 | 18,208 | 46 | -18,113 | 58 | -95 | 11 |
| Sugar | 857,661 | 38 | 224,695 | 72 | -271,696 | 26 | 47,001 | 64 |
| Wheat | 435,685 | 86 | -59,947 | 24 | 56,978 | 74 | 2,969 | 80 |
Strength Scores led by Cocoa & Sugar
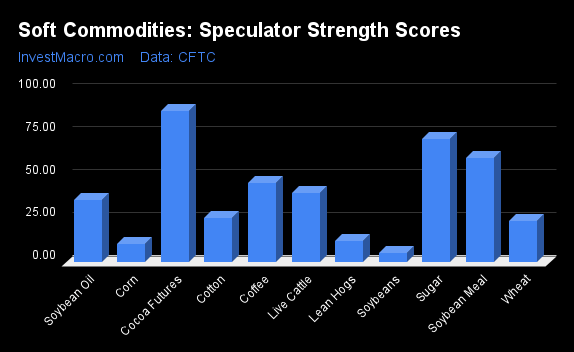
COT Strength Scores (a normalized measure of Speculator positions over a 3-Year range, from 0 to 100 where above 80 is Extreme-Bullish and below 20 is Extreme-Bearish) showed that Cocoa (89 percent) and Sugar (72 percent) led the softs markets this week. Soybean Meal (61 percent), Coffee (46 percent) and Live Cattle (40 percent) come in as the next highest in the weekly strength scores.
On the downside, Soybeans (5 percent), Corn (11 percent) and Lean Hogs (13 percent) come in at the lowest strength levels currently and are in Extreme-Bearish territory (below 20 percent).
Strength Statistics:
Corn (10.5 percent) vs Corn previous week (8.4 percent)
Sugar (71.9 percent) vs Sugar previous week (73.1 percent)
Coffee (46.1 percent) vs Coffee previous week (27.2 percent)
Soybeans (5.4 percent) vs Soybeans previous week (1.8 percent)
Soybean Oil (36.2 percent) vs Soybean Oil previous week (41.8 percent)
Soybean Meal (60.6 percent) vs Soybean Meal previous week (43.7 percent)
Live Cattle (40.3 percent) vs Live Cattle previous week (63.4 percent)
Lean Hogs (12.6 percent) vs Lean Hogs previous week (17.4 percent)
Cotton (25.8 percent) vs Cotton previous week (33.7 percent)
Cocoa (88.5 percent) vs Cocoa previous week (82.9 percent)
Wheat (24.2 percent) vs Wheat previous week (17.6 percent)
Coffee & Soybean Meal top the 6-Week Strength Trends
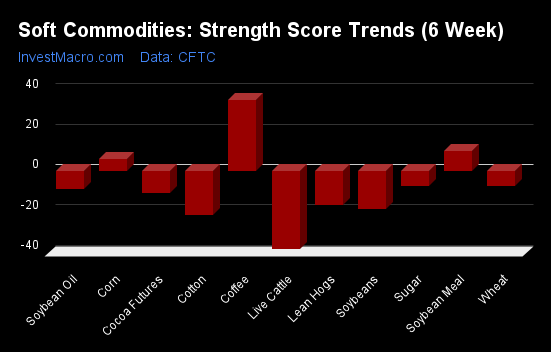
COT Strength Score Trends (or move index, calculates the 6-week changes in strength scores) showed that Coffee (36 percent) and Soybean Meal (10 percent) lead the past six weeks trends for soft commodities. Corn (6 percent) is the next highest positive movers in the latest trends data.
Live Cattle (-39 percent) leads the downside trend scores currently with Cotton (-22 percent), Soybeans (-19 percent) and Lean Hogs (-16 percent) following next with lower trend scores.
Strength Trend Statistics:
Corn (6.0 percent) vs Corn previous week (-2.5 percent)
Sugar (-7.1 percent) vs Sugar previous week (-2.7 percent)
Coffee (35.7 percent) vs Coffee previous week (18.7 percent)
Soybeans (-18.8 percent) vs Soybeans previous week (-23.2 percent)
Soybean Oil (-8.6 percent) vs Soybean Oil previous week (-8.8 percent)
Soybean Meal (10.0 percent) vs Soybean Meal previous week (-9.4 percent)
Live Cattle (-38.5 percent) vs Live Cattle previous week (-8.8 percent)
Lean Hogs (-16.4 percent) vs Lean Hogs previous week (-7.2 percent)
Cotton (-21.6 percent) vs Cotton previous week (-17.4 percent)
Cocoa (-10.8 percent) vs Cocoa previous week (-15.0 percent)
Wheat (-7.3 percent) vs Wheat previous week (-16.2 percent)
Individual Soft Commodities Markets:
CORN Futures:
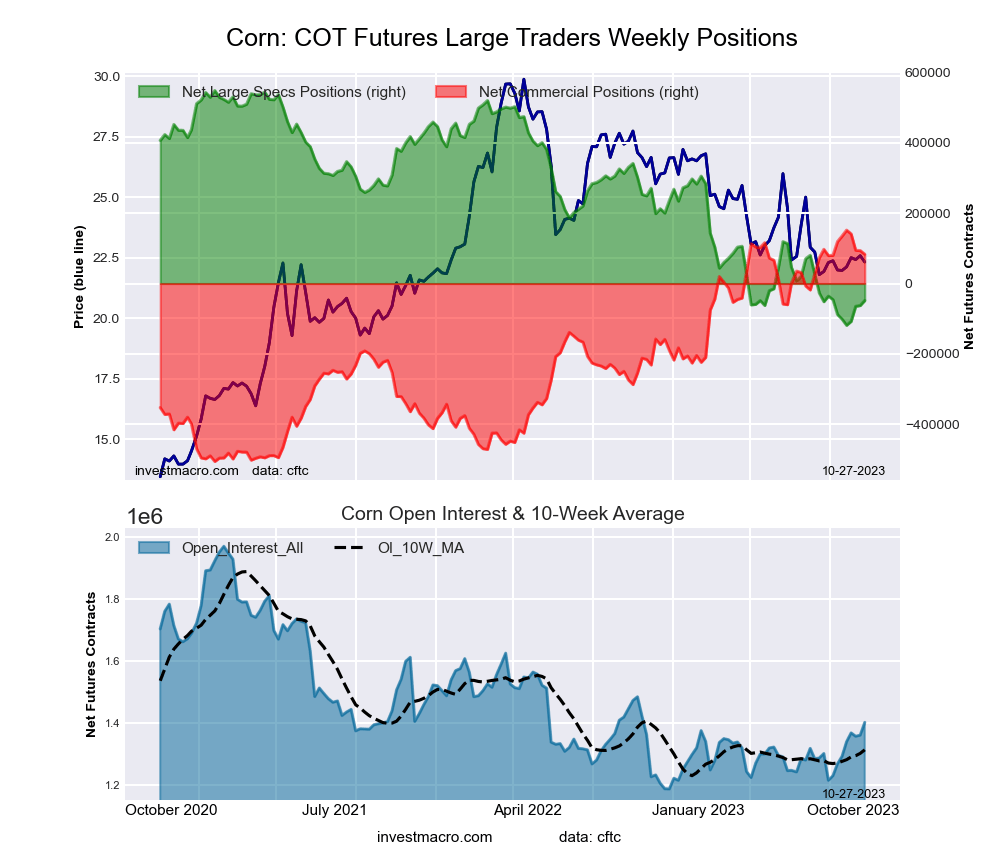 The CORN large speculator standing this week recorded a net position of -48,280 contracts in the data reported through Tuesday. This was a weekly advance of 14,274 contracts from the previous week which had a total of -62,554 net contracts.
This week’s current strength score (the trader positioning range over the past three years, measured from 0 to 100) shows the speculators are currently Bearish-Extreme with a score of 10.5 percent. The commercials are Bullish-Extreme with a score of 89.6 percent and the small traders (not shown in chart) are Bullish-Extreme with a score of 82.9 percent.
Price Trend-Following Model: Downtrend
Our weekly trend-following model classifies the current market price position as: Downtrend. The current action for the model is considered to be: Hold – Maintain Short Position.
| CORN Futures Statistics | SPECULATORS | COMMERCIALS | SMALL TRADERS |
| – Percent of Open Interest Longs: | 20.2 | 46.6 | 9.9 |
| – Percent of Open Interest Shorts: | 23.6 | 40.7 | 12.4 |
| – Net Position: | -48,280 | 83,034 | -34,754 |
| – Gross Longs: | 283,037 | 653,322 | 139,285 |
| – Gross Shorts: | 331,317 | 570,288 | 174,039 |
| – Long to Short Ratio: | 0.9 to 1 | 1.1 to 1 | 0.8 to 1 |
| NET POSITION TREND: | |||
| – Strength Index Score (3 Year Range Pct): | 10.5 | 89.6 | 82.9 |
| – Strength Index Reading (3 Year Range): | Bearish-Extreme | Bullish-Extreme | Bullish-Extreme |
| NET POSITION MOVEMENT INDEX: | |||
| – 6-Week Change in Strength Index: | 6.0 | -5.5 | -7.0 |
SUGAR Futures:
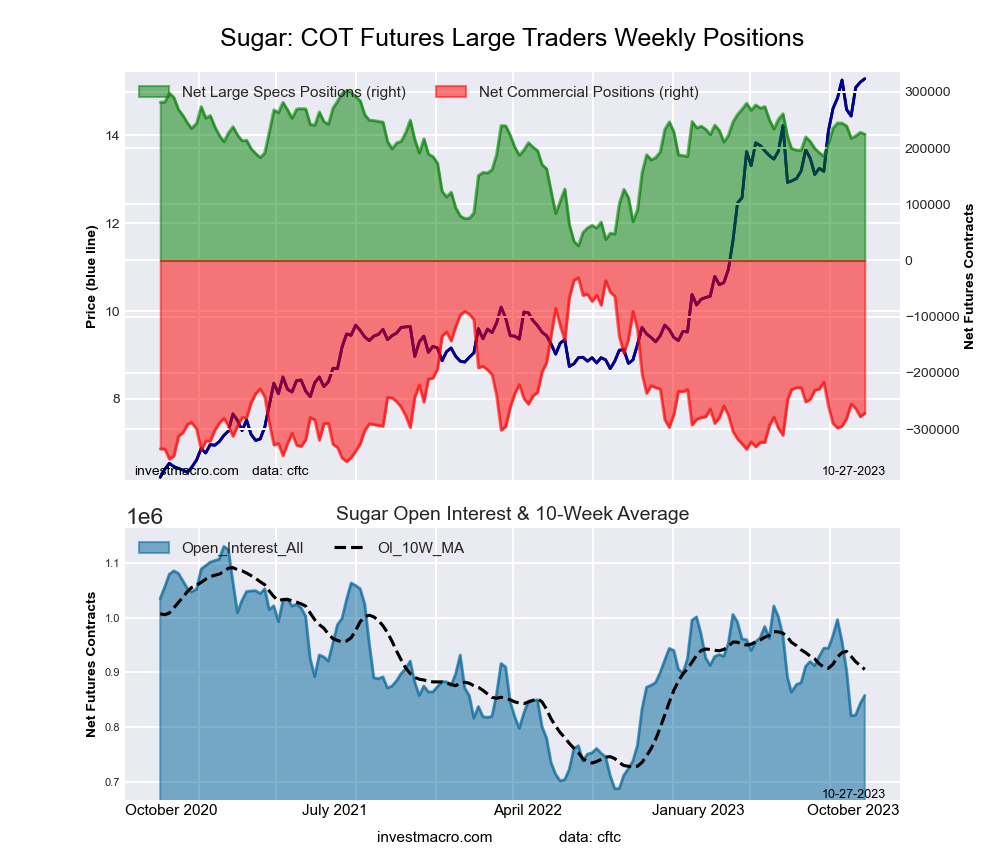 The SUGAR large speculator standing this week recorded a net position of 224,695 contracts in the data reported through Tuesday. This was a weekly reduction of -3,264 contracts from the previous week which had a total of 227,959 net contracts.
This week’s current strength score (the trader positioning range over the past three years, measured from 0 to 100) shows the speculators are currently Bullish with a score of 71.9 percent. The commercials are Bearish with a score of 26.2 percent and the small traders (not shown in chart) are Bullish with a score of 63.8 percent.
Price Trend-Following Model: Uptrend
Our weekly trend-following model classifies the current market price position as: Uptrend. The current action for the model is considered to be: Hold – Maintain Long Position.
| SUGAR Futures Statistics | SPECULATORS | COMMERCIALS | SMALL TRADERS |
| – Percent of Open Interest Longs: | 37.4 | 38.2 | 10.8 |
| – Percent of Open Interest Shorts: | 11.2 | 69.9 | 5.3 |
| – Net Position: | 224,695 | -271,696 | 47,001 |
| – Gross Longs: | 320,884 | 328,055 | 92,632 |
| – Gross Shorts: | 96,189 | 599,751 | 45,631 |
| – Long to Short Ratio: | 3.3 to 1 | 0.5 to 1 | 2.0 to 1 |
| NET POSITION TREND: | |||
| – Strength Index Score (3 Year Range Pct): | 71.9 | 26.2 | 63.8 |
| – Strength Index Reading (3 Year Range): | Bullish | Bearish | Bullish |
| NET POSITION MOVEMENT INDEX: | |||
| – 6-Week Change in Strength Index: | -7.1 | 8.0 | -8.3 |
COFFEE Futures:
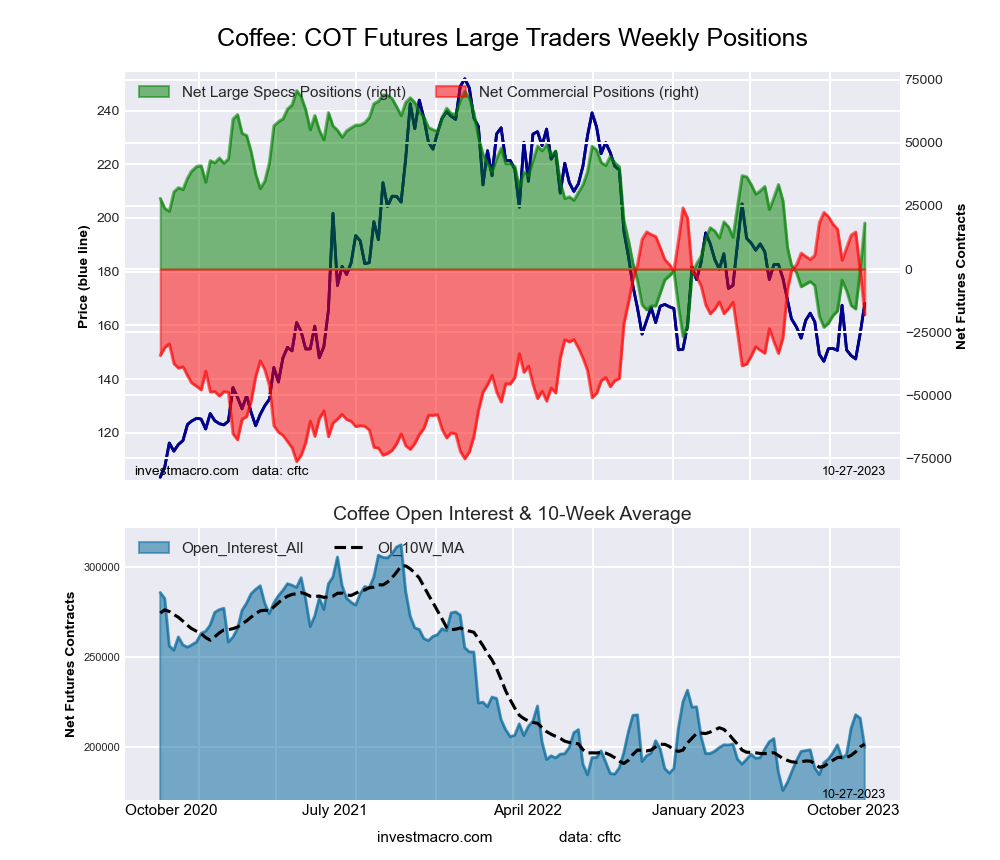 The COFFEE large speculator standing this week recorded a net position of 18,208 contracts in the data reported through Tuesday. This was a weekly increase of 18,396 contracts from the previous week which had a total of -188 net contracts.
This week’s current strength score (the trader positioning range over the past three years, measured from 0 to 100) shows the speculators are currently Bearish with a score of 46.1 percent. The commercials are Bullish with a score of 57.9 percent and the small traders (not shown in chart) are Bearish-Extreme with a score of 11.5 percent.
Price Trend-Following Model: Weak Downtrend
Our weekly trend-following model classifies the current market price position as: Weak Downtrend. The current action for the model is considered to be: Hold – Maintain Short Position.
| COFFEE Futures Statistics | SPECULATORS | COMMERCIALS | SMALL TRADERS |
| – Percent of Open Interest Longs: | 27.6 | 42.7 | 5.2 |
| – Percent of Open Interest Shorts: | 18.5 | 51.8 | 5.2 |
| – Net Position: | 18,208 | -18,113 | -95 |
| – Gross Longs: | 55,113 | 85,251 | 10,332 |
| – Gross Shorts: | 36,905 | 103,364 | 10,427 |
| – Long to Short Ratio: | 1.5 to 1 | 0.8 to 1 | 1.0 to 1 |
| NET POSITION TREND: | |||
| – Strength Index Score (3 Year Range Pct): | 46.1 | 57.9 | 11.5 |
| – Strength Index Reading (3 Year Range): | Bearish | Bullish | Bearish-Extreme |
| NET POSITION MOVEMENT INDEX: | |||
| – 6-Week Change in Strength Index: | 35.7 | -33.7 | -10.4 |
SOYBEANS Futures:
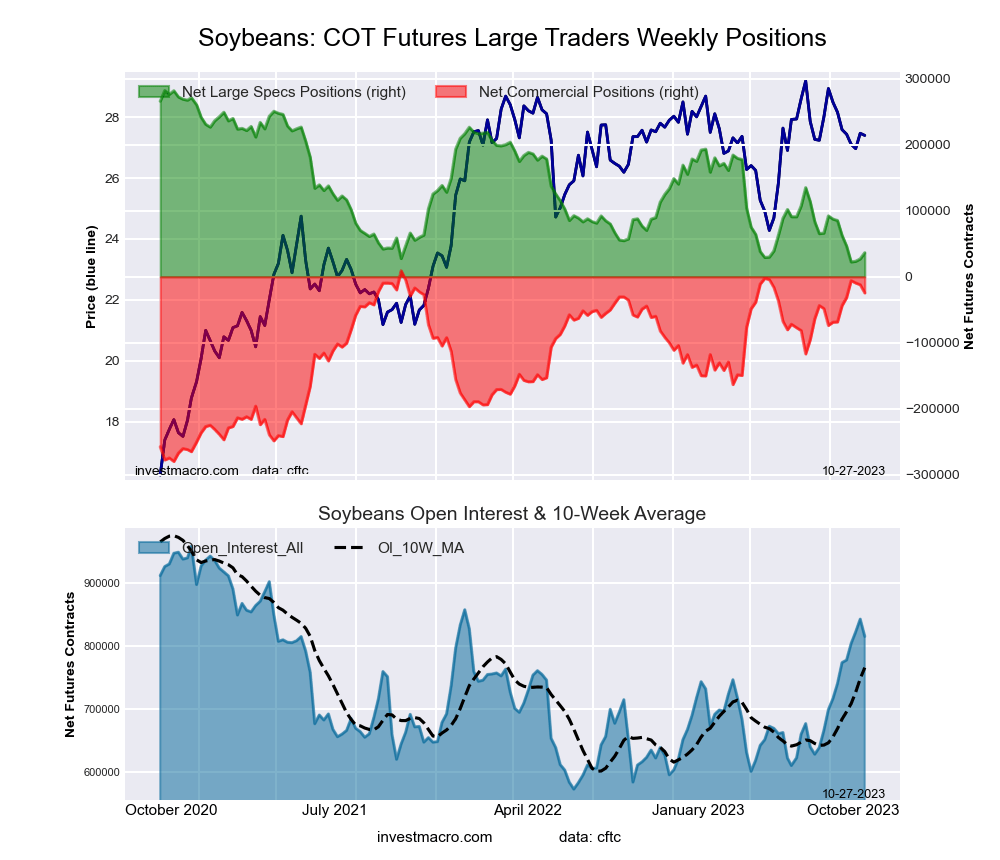 The SOYBEANS large speculator standing this week recorded a net position of 36,454 contracts in the data reported through Tuesday. This was a weekly advance of 9,349 contracts from the previous week which had a total of 27,105 net contracts.
This week’s current strength score (the trader positioning range over the past three years, measured from 0 to 100) shows the speculators are currently Bearish-Extreme with a score of 5.4 percent. The commercials are Bullish-Extreme with a score of 88.4 percent and the small traders (not shown in chart) are Bullish with a score of 75.3 percent.
Price Trend-Following Model: Weak Uptrend
Our weekly trend-following model classifies the current market price position as: Weak Uptrend. The current action for the model is considered to be: Hold – Maintain Long Position.
| SOYBEANS Futures Statistics | SPECULATORS | COMMERCIALS | SMALL TRADERS |
| – Percent of Open Interest Longs: | 16.6 | 54.3 | 7.0 |
| – Percent of Open Interest Shorts: | 12.1 | 57.3 | 8.5 |
| – Net Position: | 36,454 | -24,483 | -11,971 |
| – Gross Longs: | 135,138 | 442,219 | 57,078 |
| – Gross Shorts: | 98,684 | 466,702 | 69,049 |
| – Long to Short Ratio: | 1.4 to 1 | 0.9 to 1 | 0.8 to 1 |
| NET POSITION TREND: | |||
| – Strength Index Score (3 Year Range Pct): | 5.4 | 88.4 | 75.3 |
| – Strength Index Reading (3 Year Range): | Bearish-Extreme | Bullish-Extreme | Bullish |
| NET POSITION MOVEMENT INDEX: | |||
| – 6-Week Change in Strength Index: | -18.8 | 15.2 | 11.6 |
SOYBEAN OIL Futures:
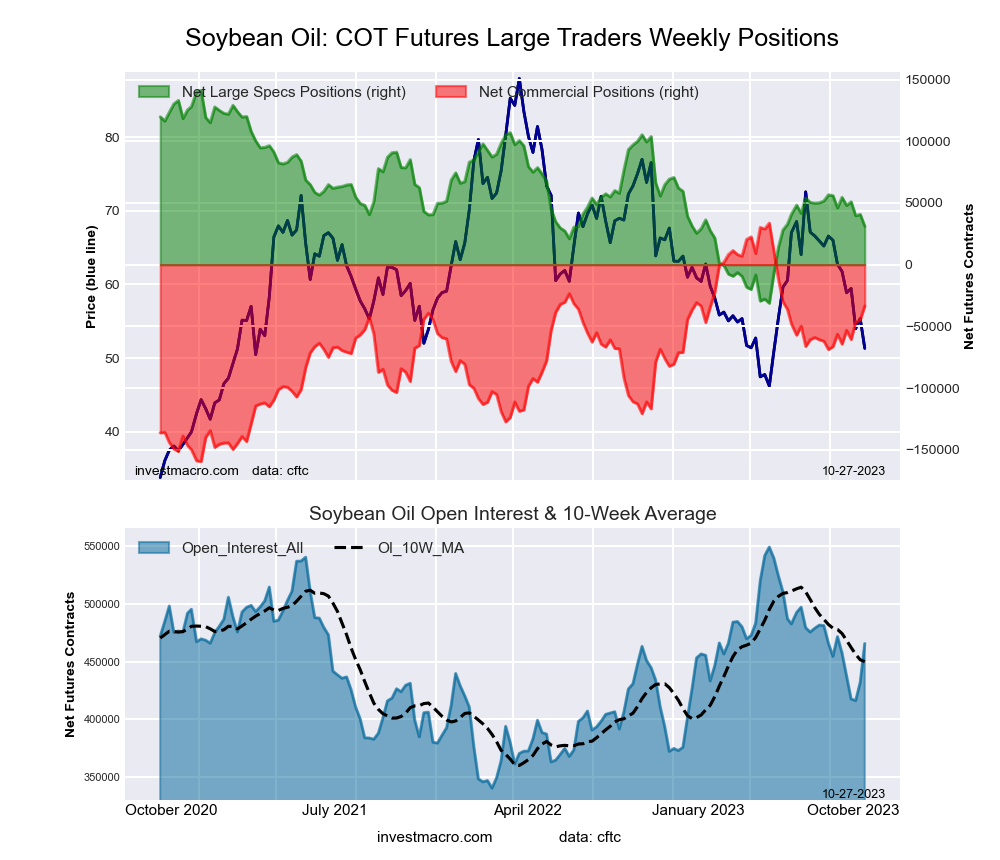 The SOYBEAN OIL large speculator standing this week recorded a net position of 31,139 contracts in the data reported through Tuesday. This was a weekly decline of -9,666 contracts from the previous week which had a total of 40,805 net contracts.
This week’s current strength score (the trader positioning range over the past three years, measured from 0 to 100) shows the speculators are currently Bearish with a score of 36.2 percent. The commercials are Bullish with a score of 65.3 percent and the small traders (not shown in chart) are Bearish with a score of 22.2 percent.
Price Trend-Following Model: Strong Downtrend
Our weekly trend-following model classifies the current market price position as: Strong Downtrend. The current action for the model is considered to be: Hold – Maintain Short Position.
| SOYBEAN OIL Futures Statistics | SPECULATORS | COMMERCIALS | SMALL TRADERS |
| – Percent of Open Interest Longs: | 21.2 | 48.4 | 6.6 |
| – Percent of Open Interest Shorts: | 14.5 | 55.6 | 6.1 |
| – Net Position: | 31,139 | -33,462 | 2,323 |
| – Gross Longs: | 98,579 | 225,469 | 30,536 |
| – Gross Shorts: | 67,440 | 258,931 | 28,213 |
| – Long to Short Ratio: | 1.5 to 1 | 0.9 to 1 | 1.1 to 1 |
| NET POSITION TREND: | |||
| – Strength Index Score (3 Year Range Pct): | 36.2 | 65.3 | 22.2 |
| – Strength Index Reading (3 Year Range): | Bearish | Bullish | Bearish |
| NET POSITION MOVEMENT INDEX: | |||
| – 6-Week Change in Strength Index: | -8.6 | 11.8 | -29.9 |
SOYBEAN MEAL Futures:
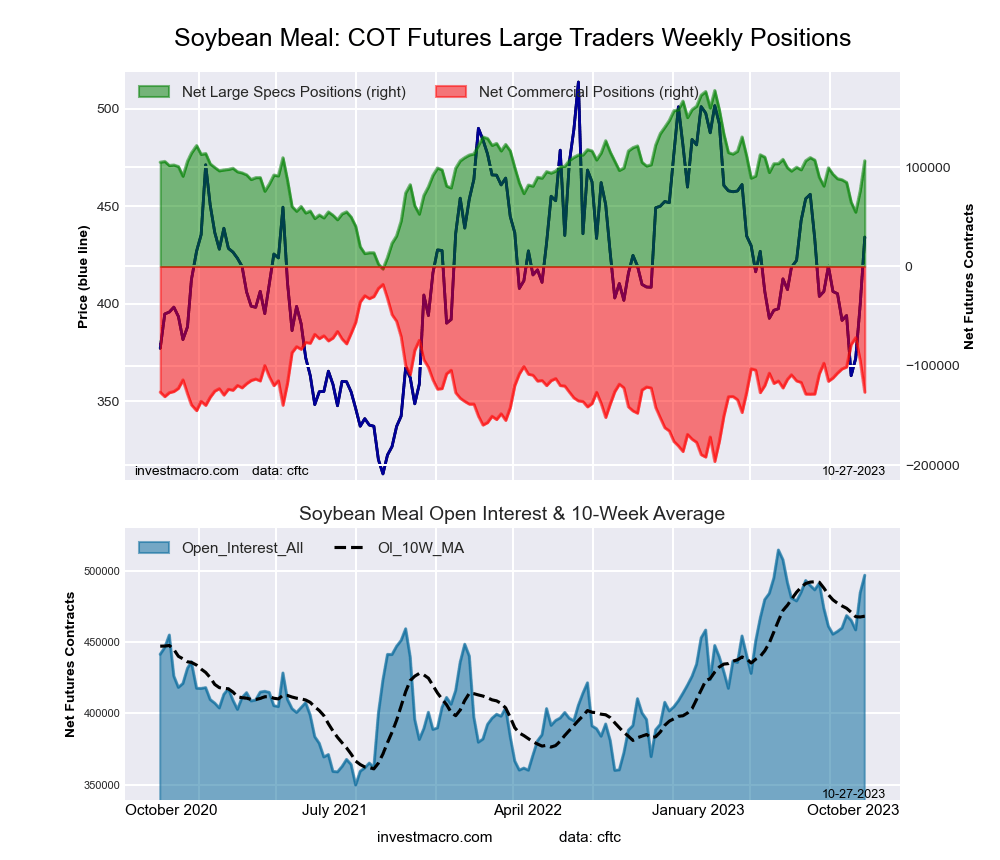 The SOYBEAN MEAL large speculator standing this week recorded a net position of 106,326 contracts in the data reported through Tuesday. This was a weekly gain of 30,388 contracts from the previous week which had a total of 75,938 net contracts.
This week’s current strength score (the trader positioning range over the past three years, measured from 0 to 100) shows the speculators are currently Bullish with a score of 60.6 percent. The commercials are Bearish with a score of 39.1 percent and the small traders (not shown in chart) are Bearish with a score of 45.7 percent.
Price Trend-Following Model: Weak Downtrend
Our weekly trend-following model classifies the current market price position as: Weak Downtrend. The current action for the model is considered to be: Hold – Maintain Short Position.
| SOYBEAN MEAL Futures Statistics | SPECULATORS | COMMERCIALS | SMALL TRADERS |
| – Percent of Open Interest Longs: | 26.5 | 38.2 | 10.1 |
| – Percent of Open Interest Shorts: | 5.1 | 63.7 | 6.1 |
| – Net Position: | 106,326 | -126,450 | 20,124 |
| – Gross Longs: | 131,878 | 189,965 | 50,190 |
| – Gross Shorts: | 25,552 | 316,415 | 30,066 |
| – Long to Short Ratio: | 5.2 to 1 | 0.6 to 1 | 1.7 to 1 |
| NET POSITION TREND: | |||
| – Strength Index Score (3 Year Range Pct): | 60.6 | 39.1 | 45.7 |
| – Strength Index Reading (3 Year Range): | Bullish | Bearish | Bearish |
| NET POSITION MOVEMENT INDEX: | |||
| – 6-Week Change in Strength Index: | 10.0 | -10.8 | 5.1 |
LIVE CATTLE Futures:
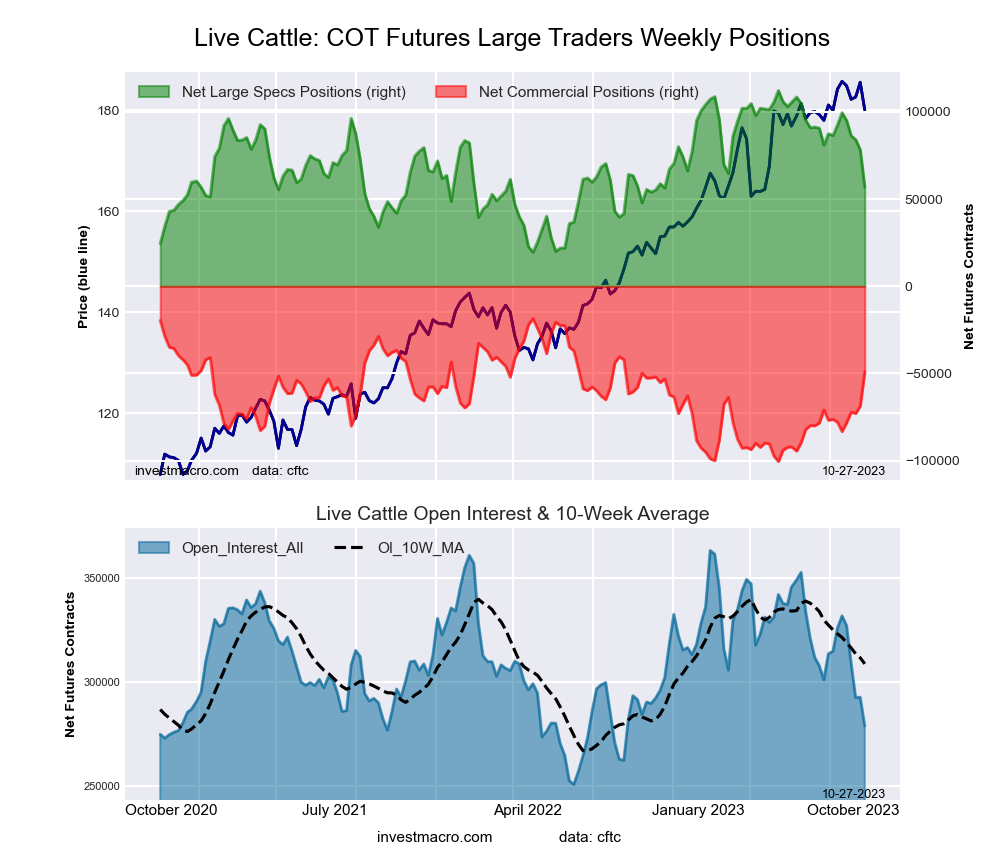 The LIVE CATTLE large speculator standing this week recorded a net position of 56,857 contracts in the data reported through Tuesday. This was a weekly lowering of -21,450 contracts from the previous week which had a total of 78,307 net contracts.
This week’s current strength score (the trader positioning range over the past three years, measured from 0 to 100) shows the speculators are currently Bearish with a score of 40.3 percent. The commercials are Bullish with a score of 62.7 percent and the small traders (not shown in chart) are Bearish with a score of 48.5 percent.
Price Trend-Following Model: Uptrend
Our weekly trend-following model classifies the current market price position as: Uptrend. The current action for the model is considered to be: Hold – Maintain Long Position.
| LIVE CATTLE Futures Statistics | SPECULATORS | COMMERCIALS | SMALL TRADERS |
| – Percent of Open Interest Longs: | 36.9 | 34.6 | 9.5 |
| – Percent of Open Interest Shorts: | 16.5 | 52.3 | 12.3 |
| – Net Position: | 56,857 | -49,115 | -7,742 |
| – Gross Longs: | 102,832 | 96,618 | 26,491 |
| – Gross Shorts: | 45,975 | 145,733 | 34,233 |
| – Long to Short Ratio: | 2.2 to 1 | 0.7 to 1 | 0.8 to 1 |
| NET POSITION TREND: | |||
| – Strength Index Score (3 Year Range Pct): | 40.3 | 62.7 | 48.5 |
| – Strength Index Reading (3 Year Range): | Bearish | Bullish | Bearish |
| NET POSITION MOVEMENT INDEX: | |||
| – 6-Week Change in Strength Index: | -38.5 | 35.3 | 36.2 |
LEAN HOGS Futures:
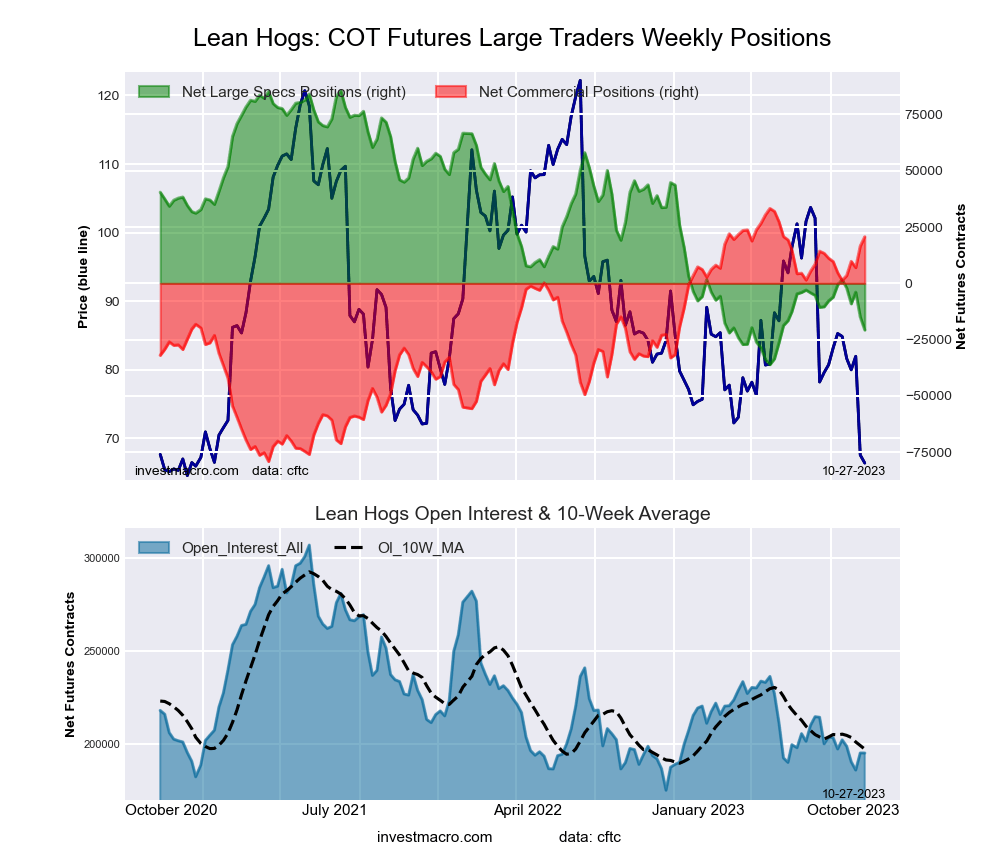 The LEAN HOGS large speculator standing this week recorded a net position of -20,721 contracts in the data reported through Tuesday. This was a weekly reduction of -5,806 contracts from the previous week which had a total of -14,915 net contracts.
This week’s current strength score (the trader positioning range over the past three years, measured from 0 to 100) shows the speculators are currently Bearish-Extreme with a score of 12.6 percent. The commercials are Bullish-Extreme with a score of 88.8 percent and the small traders (not shown in chart) are Bullish-Extreme with a score of 83.6 percent.
Price Trend-Following Model: Strong Downtrend
Our weekly trend-following model classifies the current market price position as: Strong Downtrend. The current action for the model is considered to be: Hold – Maintain Short Position.
| LEAN HOGS Futures Statistics | SPECULATORS | COMMERCIALS | SMALL TRADERS |
| – Percent of Open Interest Longs: | 27.9 | 39.5 | 10.2 |
| – Percent of Open Interest Shorts: | 38.5 | 28.9 | 10.1 |
| – Net Position: | -20,721 | 20,671 | 50 |
| – Gross Longs: | 54,414 | 76,966 | 19,814 |
| – Gross Shorts: | 75,135 | 56,295 | 19,764 |
| – Long to Short Ratio: | 0.7 to 1 | 1.4 to 1 | 1.0 to 1 |
| NET POSITION TREND: | |||
| – Strength Index Score (3 Year Range Pct): | 12.6 | 88.8 | 83.6 |
| – Strength Index Reading (3 Year Range): | Bearish-Extreme | Bullish-Extreme | Bullish-Extreme |
| NET POSITION MOVEMENT INDEX: | |||
| – 6-Week Change in Strength Index: | -16.4 | 14.2 | 18.1 |
COTTON Futures:
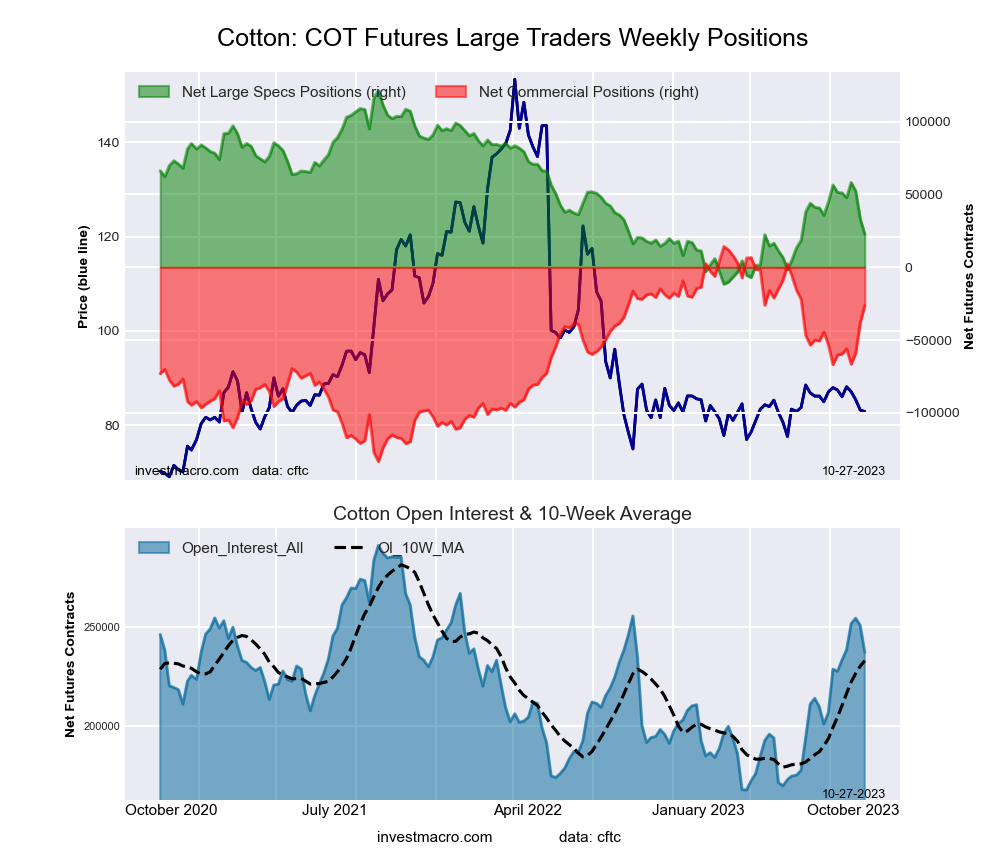 The COTTON large speculator standing this week recorded a net position of 22,680 contracts in the data reported through Tuesday. This was a weekly lowering of -10,557 contracts from the previous week which had a total of 33,237 net contracts.
This week’s current strength score (the trader positioning range over the past three years, measured from 0 to 100) shows the speculators are currently Bearish with a score of 25.8 percent. The commercials are Bullish with a score of 72.6 percent and the small traders (not shown in chart) are Bearish with a score of 37.5 percent.
Price Trend-Following Model: Weak Uptrend
Our weekly trend-following model classifies the current market price position as: Weak Uptrend. The current action for the model is considered to be: Hold – Maintain Long Position.
| COTTON Futures Statistics | SPECULATORS | COMMERCIALS | SMALL TRADERS |
| – Percent of Open Interest Longs: | 27.2 | 49.1 | 5.8 |
| – Percent of Open Interest Shorts: | 17.6 | 60.1 | 4.3 |
| – Net Position: | 22,680 | -26,215 | 3,535 |
| – Gross Longs: | 64,477 | 116,370 | 13,814 |
| – Gross Shorts: | 41,797 | 142,585 | 10,279 |
| – Long to Short Ratio: | 1.5 to 1 | 0.8 to 1 | 1.3 to 1 |
| NET POSITION TREND: | |||
| – Strength Index Score (3 Year Range Pct): | 25.8 | 72.6 | 37.5 |
| – Strength Index Reading (3 Year Range): | Bearish | Bullish | Bearish |
| NET POSITION MOVEMENT INDEX: | |||
| – 6-Week Change in Strength Index: | -21.6 | 23.0 | -32.0 |
COCOA Futures:
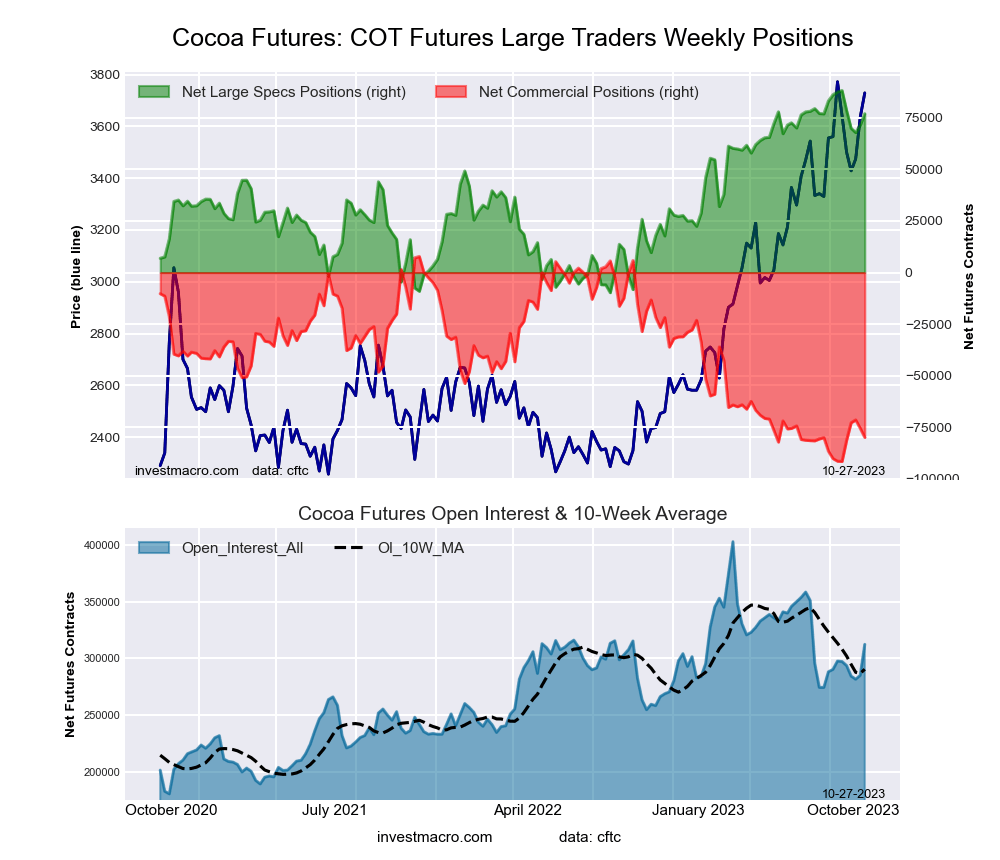 The COCOA large speculator standing this week recorded a net position of 77,020 contracts in the data reported through Tuesday. This was a weekly rise of 5,528 contracts from the previous week which had a total of 71,492 net contracts.
This week’s current strength score (the trader positioning range over the past three years, measured from 0 to 100) shows the speculators are currently Bullish-Extreme with a score of 88.5 percent. The commercials are Bearish-Extreme with a score of 11.7 percent and the small traders (not shown in chart) are Bearish with a score of 25.9 percent.
Price Trend-Following Model: Strong Uptrend
Our weekly trend-following model classifies the current market price position as: Strong Uptrend. The current action for the model is considered to be: Hold – Maintain Long Position.
| COCOA Futures Statistics | SPECULATORS | COMMERCIALS | SMALL TRADERS |
| – Percent of Open Interest Longs: | 41.2 | 26.6 | 4.8 |
| – Percent of Open Interest Shorts: | 16.5 | 52.3 | 3.9 |
| – Net Position: | 77,020 | -79,960 | 2,940 |
| – Gross Longs: | 128,611 | 83,207 | 14,982 |
| – Gross Shorts: | 51,591 | 163,167 | 12,042 |
| – Long to Short Ratio: | 2.5 to 1 | 0.5 to 1 | 1.2 to 1 |
| NET POSITION TREND: | |||
| – Strength Index Score (3 Year Range Pct): | 88.5 | 11.7 | 25.9 |
| – Strength Index Reading (3 Year Range): | Bullish-Extreme | Bearish-Extreme | Bearish |
| NET POSITION MOVEMENT INDEX: | |||
| – 6-Week Change in Strength Index: | -10.8 | 11.6 | -9.3 |
WHEAT Futures:
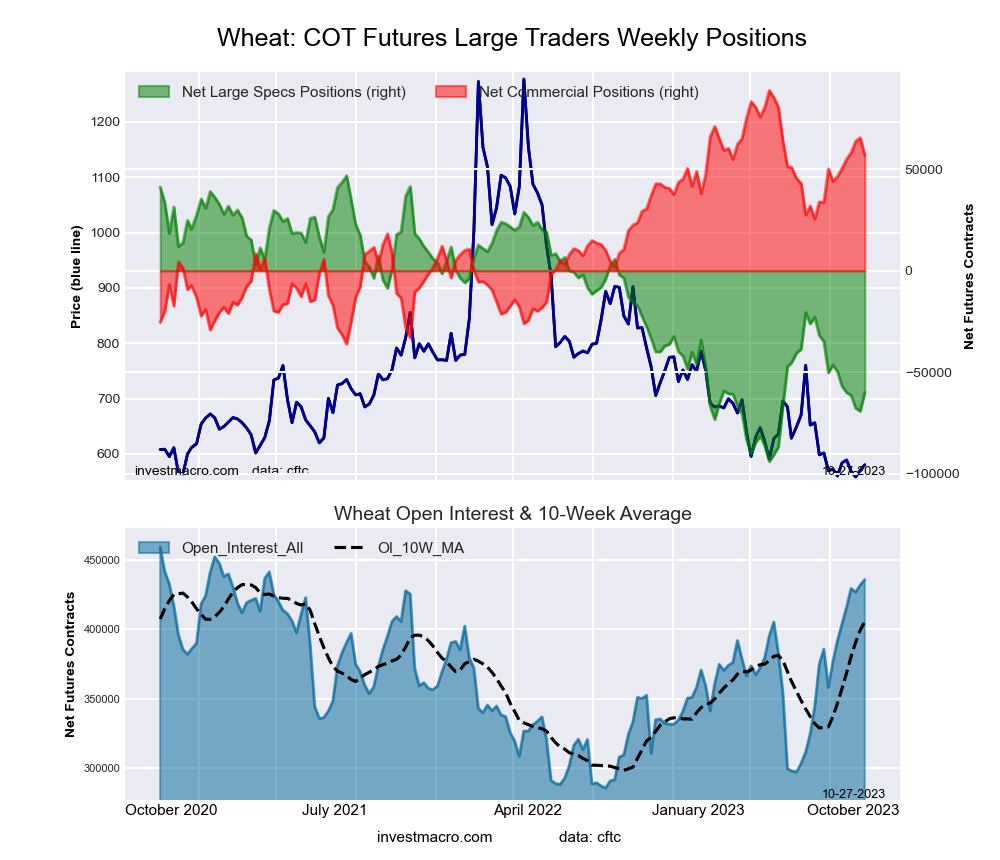 The WHEAT large speculator standing this week recorded a net position of -59,947 contracts in the data reported through Tuesday. This was a weekly boost of 9,296 contracts from the previous week which had a total of -69,243 net contracts.
This week’s current strength score (the trader positioning range over the past three years, measured from 0 to 100) shows the speculators are currently Bearish with a score of 24.2 percent. The commercials are Bullish with a score of 74.5 percent and the small traders (not shown in chart) are Bullish with a score of 79.9 percent.
Price Trend-Following Model: Downtrend
Our weekly trend-following model classifies the current market price position as: Downtrend. The current action for the model is considered to be: Hold – Maintain Short Position.
| WHEAT Futures Statistics | SPECULATORS | COMMERCIALS | SMALL TRADERS |
| – Percent of Open Interest Longs: | 28.0 | 34.5 | 8.8 |
| – Percent of Open Interest Shorts: | 41.7 | 21.4 | 8.1 |
| – Net Position: | -59,947 | 56,978 | 2,969 |
| – Gross Longs: | 121,807 | 150,412 | 38,208 |
| – Gross Shorts: | 181,754 | 93,434 | 35,239 |
| – Long to Short Ratio: | 0.7 to 1 | 1.6 to 1 | 1.1 to 1 |
| NET POSITION TREND: | |||
| – Strength Index Score (3 Year Range Pct): | 24.2 | 74.5 | 79.9 |
| – Strength Index Reading (3 Year Range): | Bearish | Bullish | Bullish |
| NET POSITION MOVEMENT INDEX: | |||
| – 6-Week Change in Strength Index: | -7.3 | 8.4 | -0.5 |
Article By InvestMacro – Receive our weekly COT Reports by Email
*COT Report: The COT data, released weekly to the public each Friday, is updated through the most recent Tuesday (data is 3 days old) and shows a quick view of how large speculators or non-commercials (for-profit traders) were positioned in the futures markets.
The CFTC categorizes trader positions according to commercial hedgers (traders who use futures contracts for hedging as part of the business), non-commercials (large traders who speculate to realize trading profits) and nonreportable traders (usually small traders/speculators) as well as their open interest (contracts open in the market at time of reporting).See CFTC criteria here.
All information and opinions on this website and contained in this article are for general informational purposes only and do not constitute investment advice.


