By InvestMacro
Here are the latest charts and statistics for the Commitment of Traders (COT) reports data published by the Commodities Futures Trading Commission (CFTC).
The latest COT data is updated through Tuesday December 12th and shows a quick view of how large traders (for-profit speculators and commercial entities) were positioned in the futures markets.
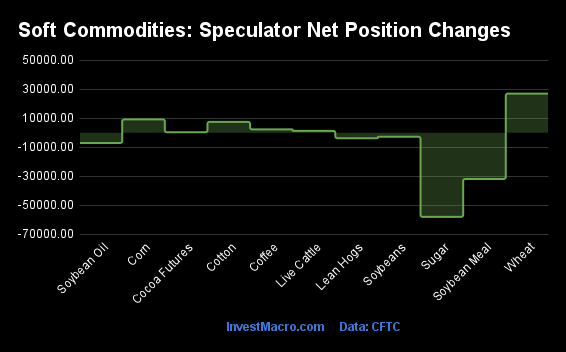
Weekly Speculator Changes led by Wheat
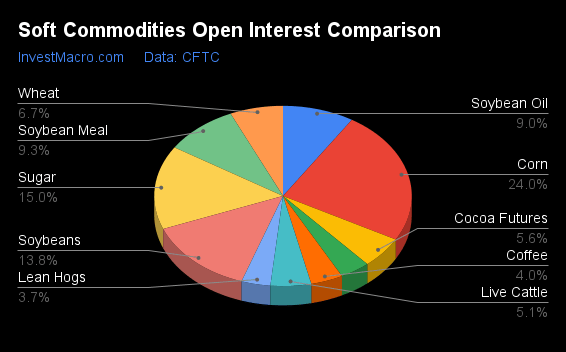
The COT soft commodities markets speculator bets were slightly higher this week as six out of the eleven softs markets we cover had higher positioning while the other five markets had lower speculator contracts.
Leading the gains for the softs markets was Wheat (27,046 contracts) with Corn (9,224 contracts), Cotton (7,547 contracts), Coffee (2,308 contracts), Live Cattle (1,300 contracts) and Cocoa (392 contracts) also having positive weeks.
The markets with the declines in speculator bets this week were Sugar (-58,077 contracts), Soybean Meal (-31,907 contracts), Soybean Oil (-7,060 contracts), Lean Hogs (-3,765 contracts) and Soybeans (-2,759 contracts).
| Dec-12-2023 | OI | OI-Index | Spec-Net | Spec-Index | Com-Net | COM-Index | Smalls-Net | Smalls-Index |
|---|
| WTI Crude | 1,650,245 | 23 | 151,599 | 3 | -175,326 | 98 | 23,727 | 28 |
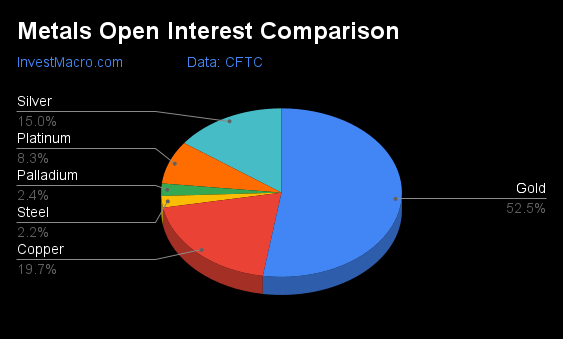
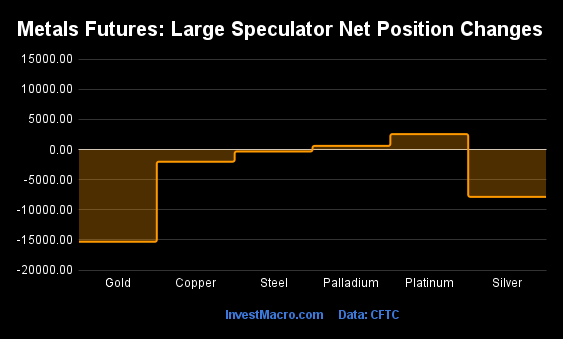
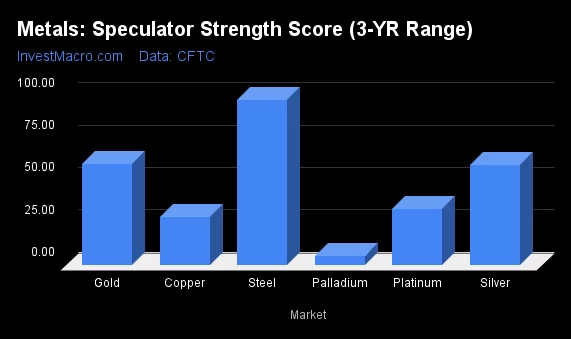
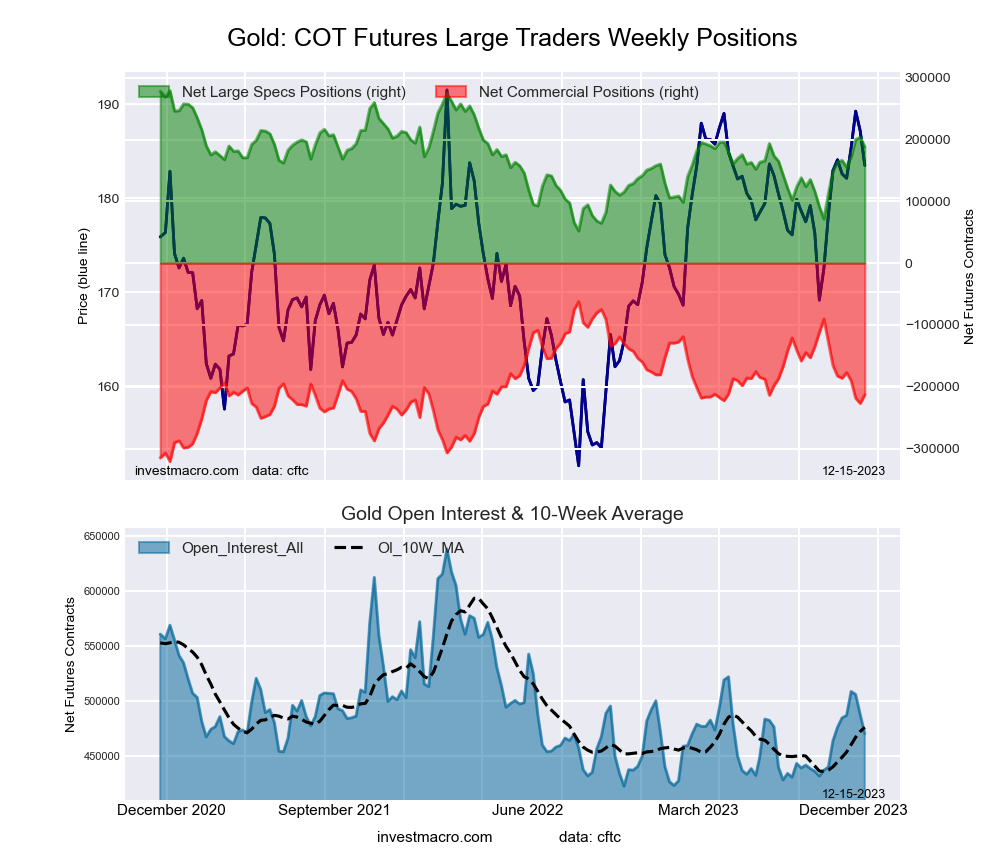
| Gold | 469,939 | 22 | 188,233 | 60 | -212,808 | 42 | 24,575 | 46 |
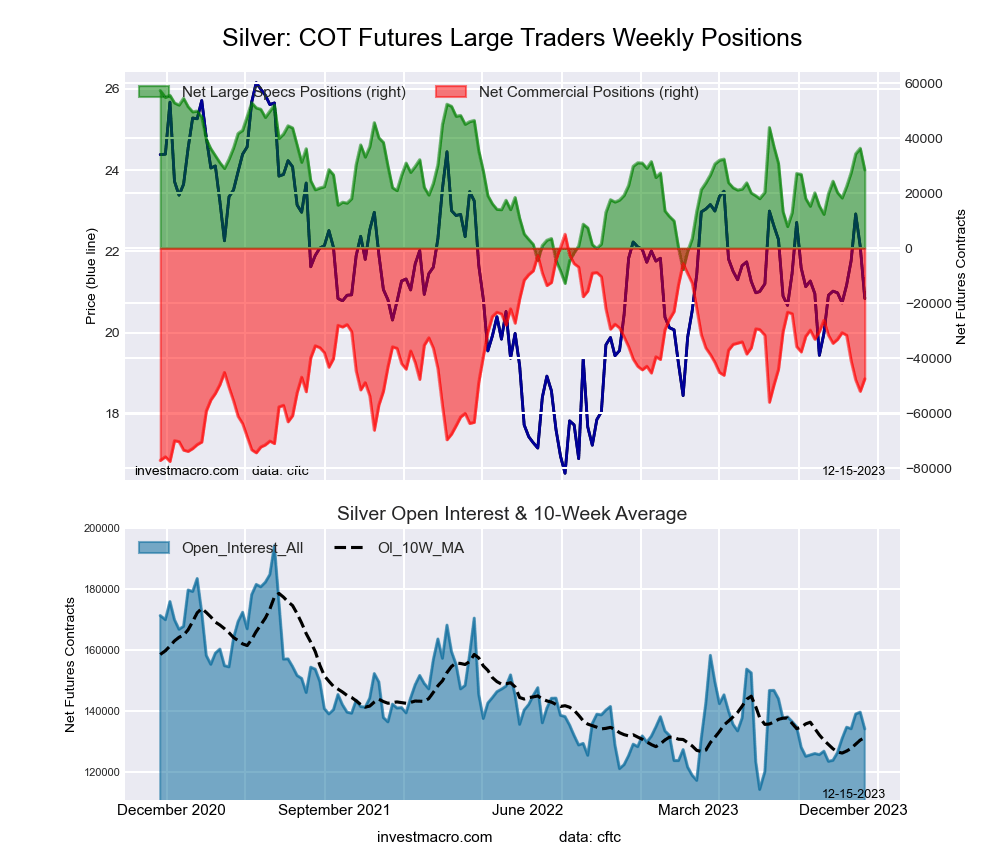
| Silver | 134,281 | 25 | 28,458 | 59 | -47,496 | 36 | 19,038 | 72 |
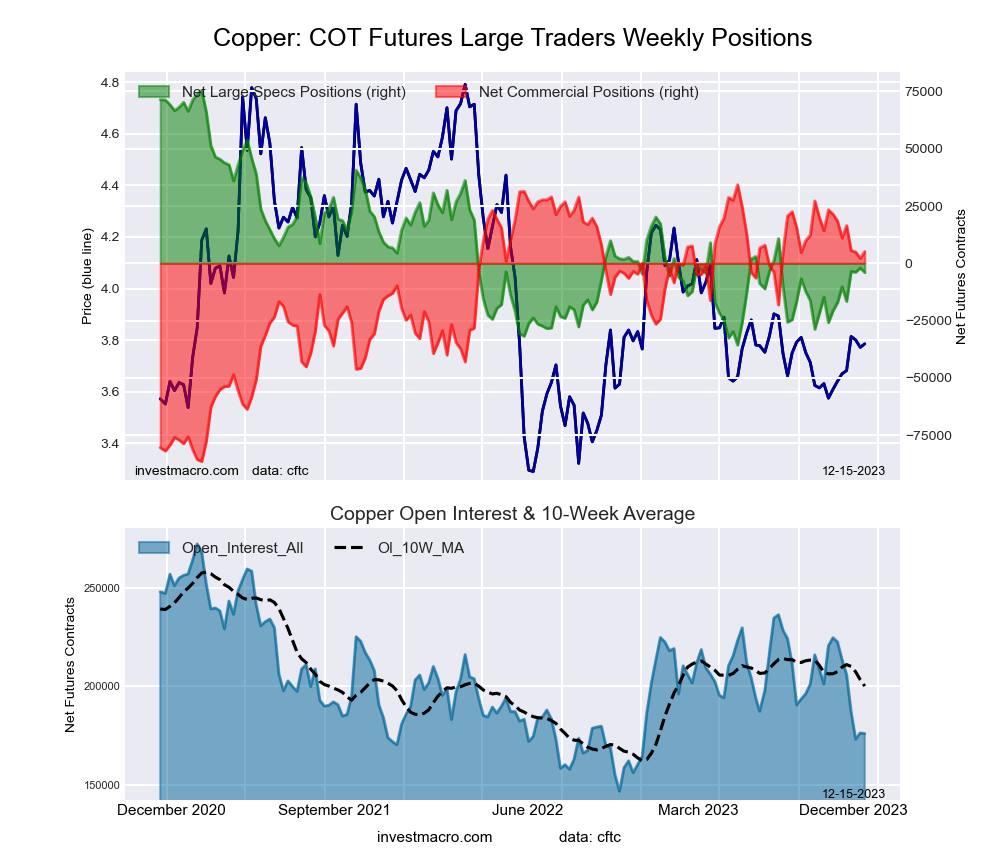
| Copper | 176,034 | 23 | -4,004 | 29 | 5,131 | 76 | -1,127 | 11 |
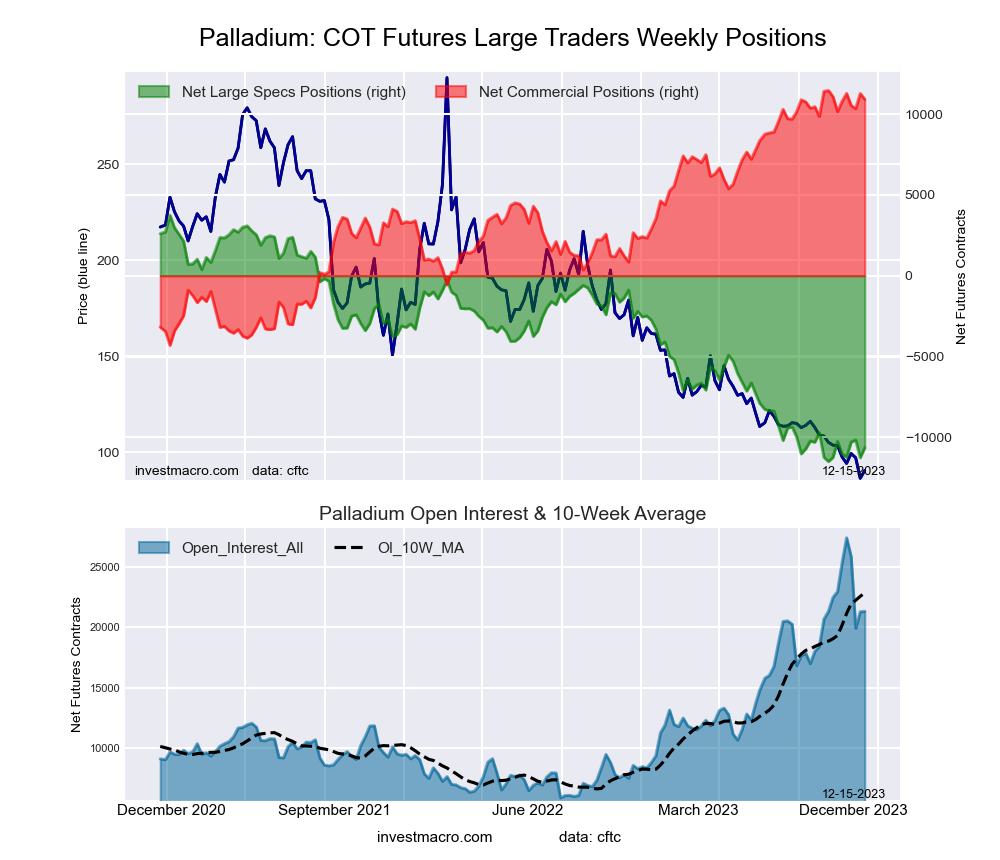
| Palladium | 21,309 | 72 | -10,638 | 6 | 10,920 | 97 | -282 | 25 |
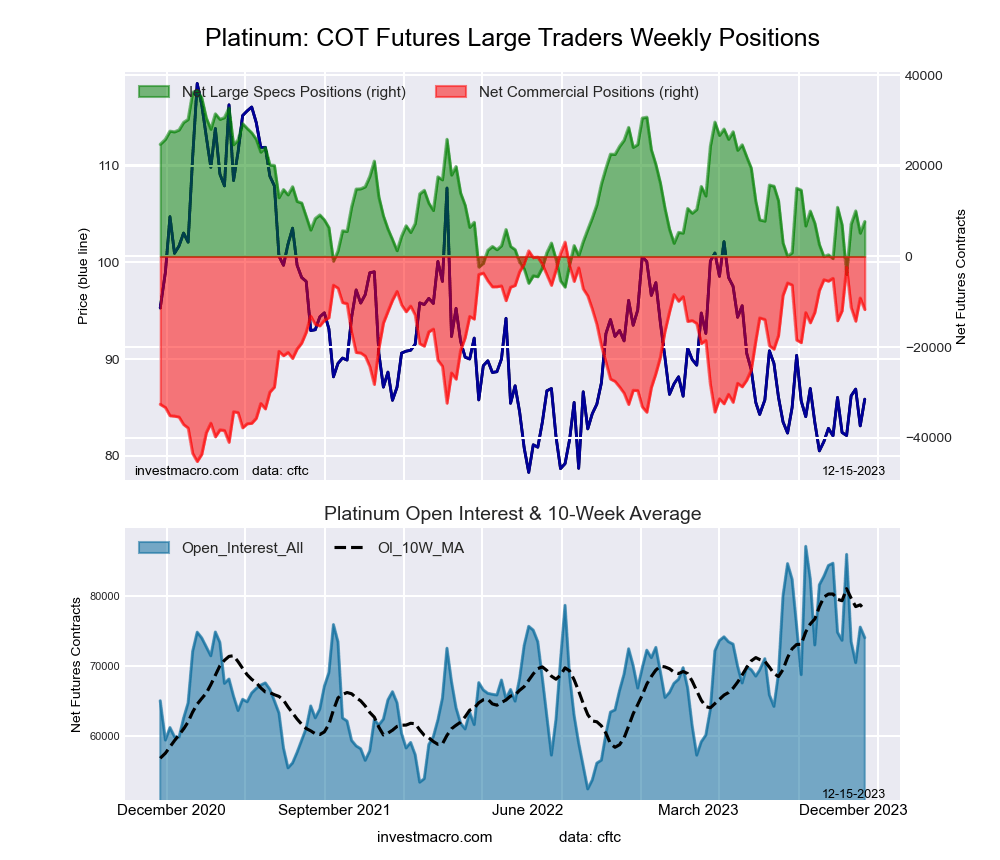
| Platinum | 74,004 | 62 | 7,709 | 33 | -11,713 | 69 | 4,004 | 22 |
| Natural Gas | 1,412,602 | 90 | -111,617 | 32 | 88,022 | 71 | 23,595 | 36 |
| Brent | 126,671 | 7 | -17,577 | 78 | 15,753 | 24 | 1,824 | 37 |
| Heating Oil | 302,940 | 37 | 27,120 | 72 | -41,287 | 43 | 14,167 | 40 |
| Soybeans | 718,648 | 38 | 17,539 | 1 | -216 | 97 | -17,323 | 62 |
| Corn | 1,251,100 | 8 | -101,215 | 8 | 131,530 | 94 | -30,315 | 81 |
| Coffee | 210,390 | 25 | 36,568 | 65 | -38,176 | 38 | 1,608 | 33 |
| Sugar | 781,527 | 21 | 107,392 | 29 | -129,631 | 70 | 22,239 | 31 |
| Wheat | 347,460 | 35 | -40,021 | 40 | 48,543 | 63 | -8,522 | 29 |
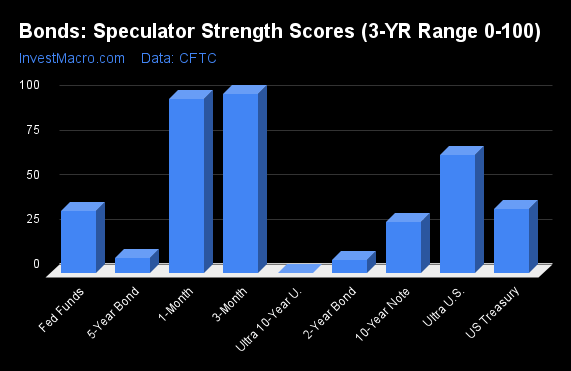
Strength Scores led by Cocoa & Coffee
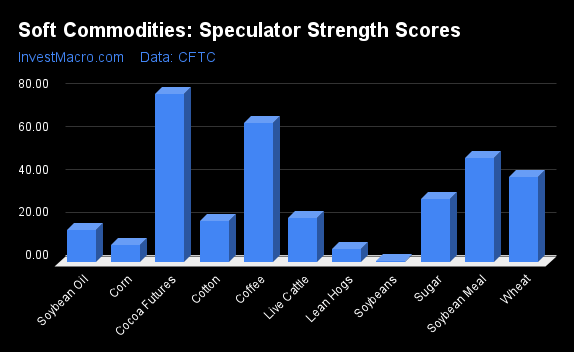
COT Strength Scores (a normalized measure of Speculator positions over a 3-Year range, from 0 to 100 where above 80 is Extreme-Bullish and below 20 is Extreme-Bearish) showed that Cocoa (79 percent) and Coffee (65 percent) lead the softs markets this week. Soybean Meal (49 percent) comes in as the next highest in the weekly strength scores.
On the downside, Soybeans (1 percent), Lean Hogs (6 percent), Corn (8 percent), Soybean Oil (15 percent) and Cotton (19 percent) come in at the lowest strength levels currently and are in Extreme-Bearish territory (below 20 percent).
Strength Statistics:
Corn (7.9 percent) vs Corn previous week (6.6 percent)
Sugar (29.4 percent) vs Sugar previous week (50.5 percent)
Coffee (64.9 percent) vs Coffee previous week (62.6 percent)
Soybeans (0.5 percent) vs Soybeans previous week (1.6 percent)
Soybean Oil (14.8 percent) vs Soybean Oil previous week (18.9 percent)
Soybean Meal (48.6 percent) vs Soybean Meal previous week (66.4 percent)
Live Cattle (20.7 percent) vs Live Cattle previous week (19.3 percent)
Lean Hogs (6.3 percent) vs Lean Hogs previous week (9.4 percent)
Cotton (19.3 percent) vs Cotton previous week (13.7 percent)
Cocoa (78.6 percent) vs Cocoa previous week (78.2 percent)
Wheat (39.7 percent) vs Wheat previous week (20.9 percent)
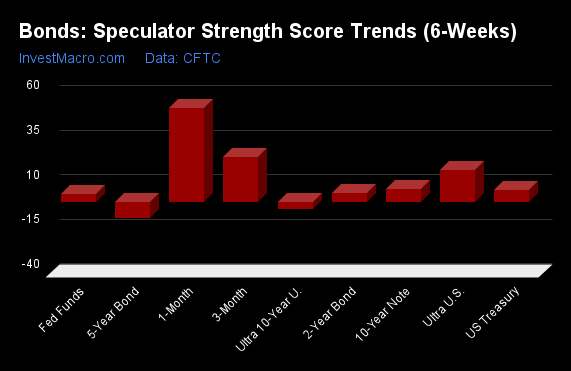
Wheat & Coffee top the 6-Week Strength Trends
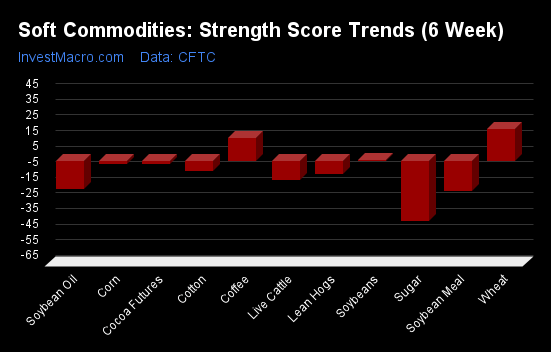
COT Strength Score Trends (or move index, calculates the 6-week changes in strength scores) showed that Wheat (21 percent) and Coffee (15 percent) lead the past six weeks trends for soft commodities.
Sugar (-38 percent) leads the downside trend scores currently with Soybean Meal (-19 percent), Soybean Oil (-18 percent) and Live Cattle (-12 percent) following next with lower trend scores.
Strength Trend Statistics:
Corn (-1.9 percent) vs Corn previous week (-8.8 percent)
Sugar (-38.4 percent) vs Sugar previous week (-21.4 percent)
Coffee (14.7 percent) vs Coffee previous week (16.5 percent)
Soybeans (0.5 percent) vs Soybeans previous week (-6.3 percent)
Soybean Oil (-17.9 percent) vs Soybean Oil previous week (-17.3 percent)
Soybean Meal (-19.4 percent) vs Soybean Meal previous week (5.7 percent)
Live Cattle (-12.3 percent) vs Live Cattle previous week (-20.9 percent)
Lean Hogs (-8.4 percent) vs Lean Hogs previous week (-3.3 percent)
Cotton (-6.4 percent) vs Cotton previous week (-12.1 percent)
Cocoa (-2.2 percent) vs Cocoa previous week (-10.3 percent)
Wheat (20.5 percent) vs Wheat previous week (-4.9 percent)
Individual Soft Commodities Markets:
CORN Futures:
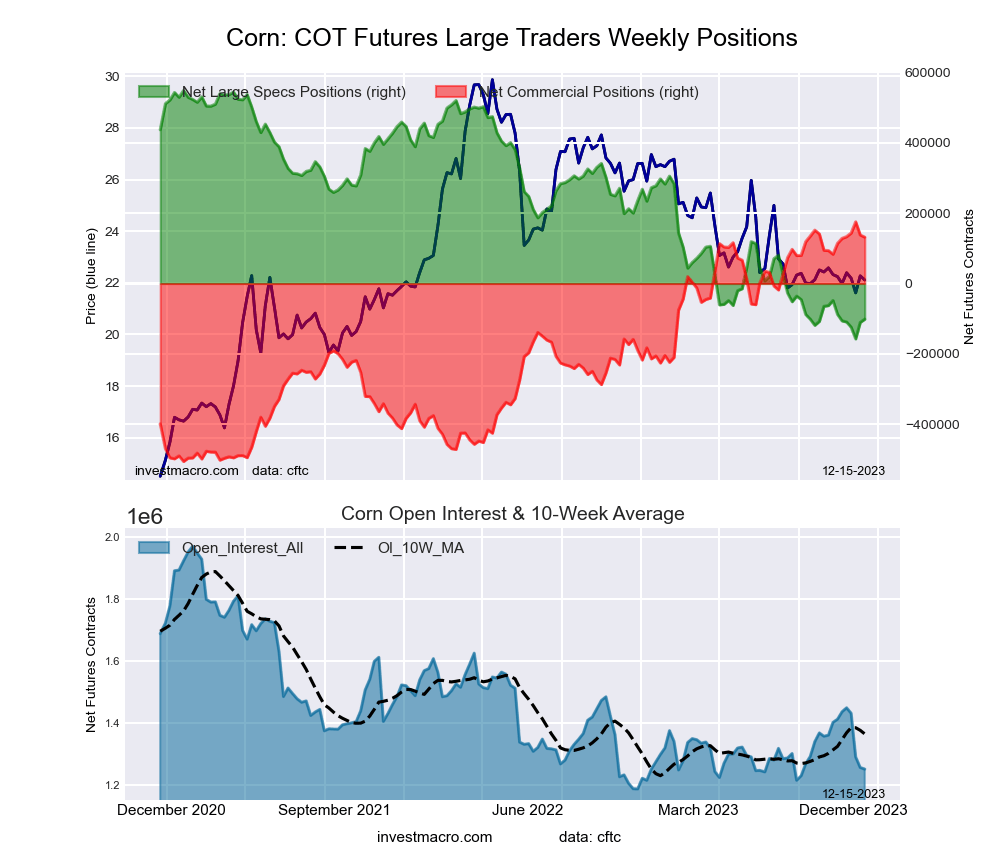 The CORN large speculator standing this week totaled a net position of -101,215 contracts in the data reported through Tuesday. This was a weekly increase of 9,224 contracts from the previous week which had a total of -110,439 net contracts.
This week’s current strength score (the trader positioning range over the past three years, measured from 0 to 100) shows the speculators are currently Bearish-Extreme with a score of 7.9 percent. The commercials are Bullish-Extreme with a score of 93.6 percent and the small traders (not shown in chart) are Bullish-Extreme with a score of 80.5 percent.
Price Trend-Following Model: Downtrend
Our weekly trend-following model classifies the current market price position as: Downtrend. The current action for the model is considered to be: Hold – Maintain Short Position.
| CORN Futures Statistics | SPECULATORS | COMMERCIALS | SMALL TRADERS |
| – Percent of Open Interest Longs: | 21.3 | 46.8 | 10.6 |
| – Percent of Open Interest Shorts: | 29.4 | 36.3 | 13.0 |
| – Net Position: | -101,215 | 131,530 | -30,315 |
| – Gross Longs: | 266,655 | 585,265 | 132,780 |
| – Gross Shorts: | 367,870 | 453,735 | 163,095 |
| – Long to Short Ratio: | 0.7 to 1 | 1.3 to 1 | 0.8 to 1 |
| NET POSITION TREND: | | | |
| – Strength Index Score (3 Year Range Pct): | 7.9 | 93.6 | 80.5 |
| – Strength Index Reading (3 Year Range): | Bearish-Extreme | Bullish-Extreme | Bullish-Extreme |
| NET POSITION MOVEMENT INDEX: | | | |
| – 6-Week Change in Strength Index: | -1.9 | 2.6 | -6.3 |
SUGAR Futures:
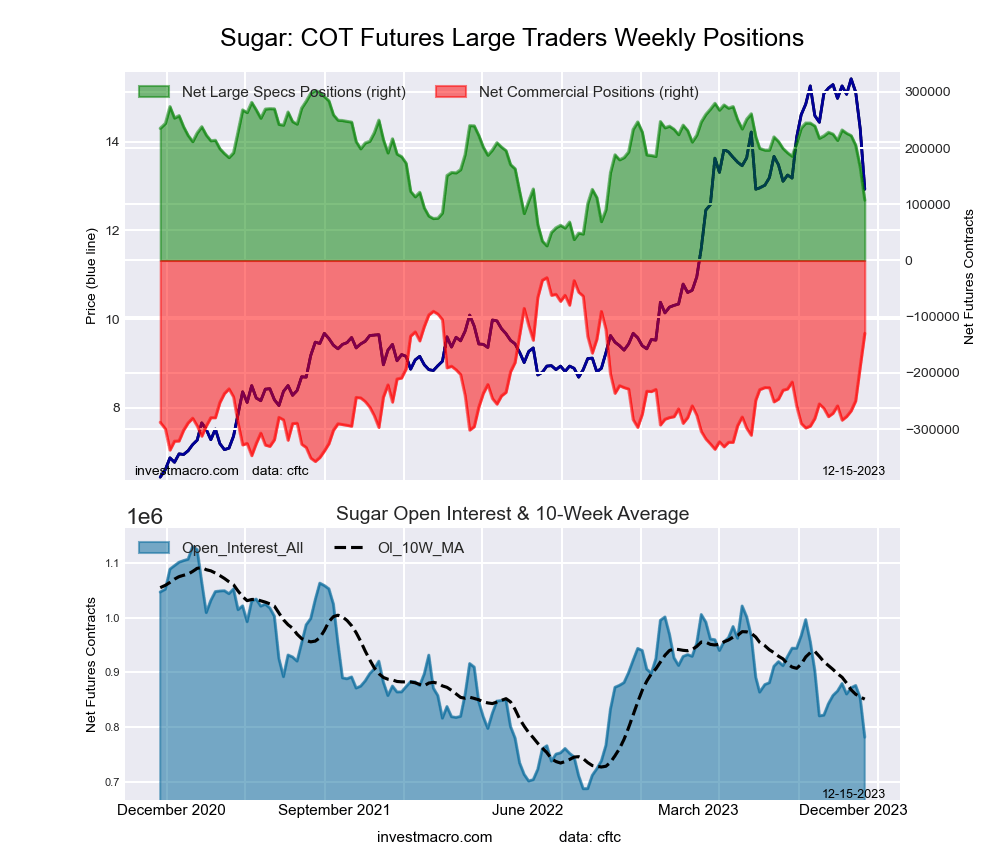 The SUGAR large speculator standing this week totaled a net position of 107,392 contracts in the data reported through Tuesday. This was a weekly fall of -58,077 contracts from the previous week which had a total of 165,469 net contracts.
This week’s current strength score (the trader positioning range over the past three years, measured from 0 to 100) shows the speculators are currently Bearish with a score of 29.4 percent. The commercials are Bullish with a score of 69.7 percent and the small traders (not shown in chart) are Bearish with a score of 31.2 percent.
Price Trend-Following Model: Weak Uptrend (Possible Trend Change)
Our weekly trend-following model classifies the current market price position as: Weak Uptrend. The current action for the model is considered to be: Hold – Maintain Long Position.
| SUGAR Futures Statistics | SPECULATORS | COMMERCIALS | SMALL TRADERS |
| – Percent of Open Interest Longs: | 25.7 | 52.2 | 9.5 |
| – Percent of Open Interest Shorts: | 11.9 | 68.8 | 6.6 |
| – Net Position: | 107,392 | -129,631 | 22,239 |
| – Gross Longs: | 200,473 | 408,051 | 74,109 |
| – Gross Shorts: | 93,081 | 537,682 | 51,870 |
| – Long to Short Ratio: | 2.2 to 1 | 0.8 to 1 | 1.4 to 1 |
| NET POSITION TREND: | | | |
| – Strength Index Score (3 Year Range Pct): | 29.4 | 69.7 | 31.2 |
| – Strength Index Reading (3 Year Range): | Bearish | Bullish | Bearish |
| NET POSITION MOVEMENT INDEX: | | | |
| – 6-Week Change in Strength Index: | -38.4 | 39.5 | -29.9 |
COFFEE Futures:
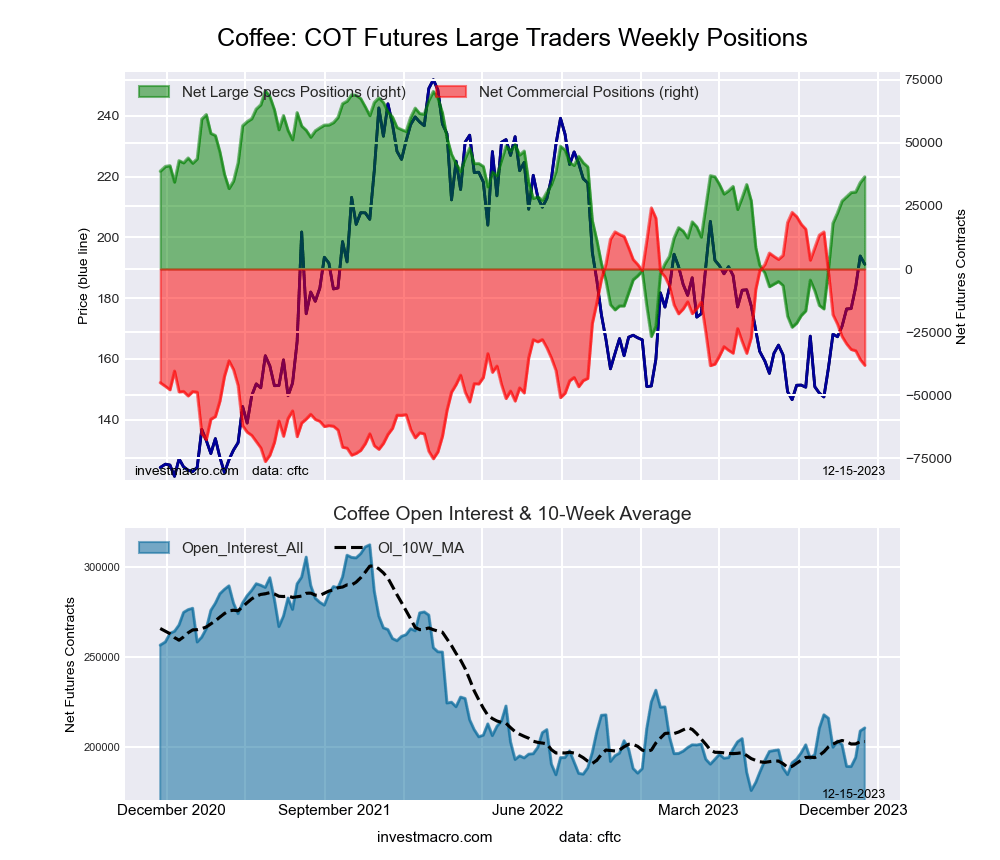 The COFFEE large speculator standing this week totaled a net position of 36,568 contracts in the data reported through Tuesday. This was a weekly gain of 2,308 contracts from the previous week which had a total of 34,260 net contracts.
This week’s current strength score (the trader positioning range over the past three years, measured from 0 to 100) shows the speculators are currently Bullish with a score of 64.9 percent. The commercials are Bearish with a score of 37.9 percent and the small traders (not shown in chart) are Bearish with a score of 33.3 percent.
Price Trend-Following Model: Strong Uptrend
Our weekly trend-following model classifies the current market price position as: Strong Uptrend. The current action for the model is considered to be: Hold – Maintain Long Position.
| COFFEE Futures Statistics | SPECULATORS | COMMERCIALS | SMALL TRADERS |
| – Percent of Open Interest Longs: | 31.9 | 37.5 | 5.5 |
| – Percent of Open Interest Shorts: | 14.5 | 55.6 | 4.7 |
| – Net Position: | 36,568 | -38,176 | 1,608 |
| – Gross Longs: | 67,149 | 78,878 | 11,508 |
| – Gross Shorts: | 30,581 | 117,054 | 9,900 |
| – Long to Short Ratio: | 2.2 to 1 | 0.7 to 1 | 1.2 to 1 |
| NET POSITION TREND: | | | |
| – Strength Index Score (3 Year Range Pct): | 64.9 | 37.9 | 33.3 |
| – Strength Index Reading (3 Year Range): | Bullish | Bearish | Bearish |
| NET POSITION MOVEMENT INDEX: | | | |
| – 6-Week Change in Strength Index: | 14.7 | -16.2 | 25.3 |
SOYBEANS Futures:
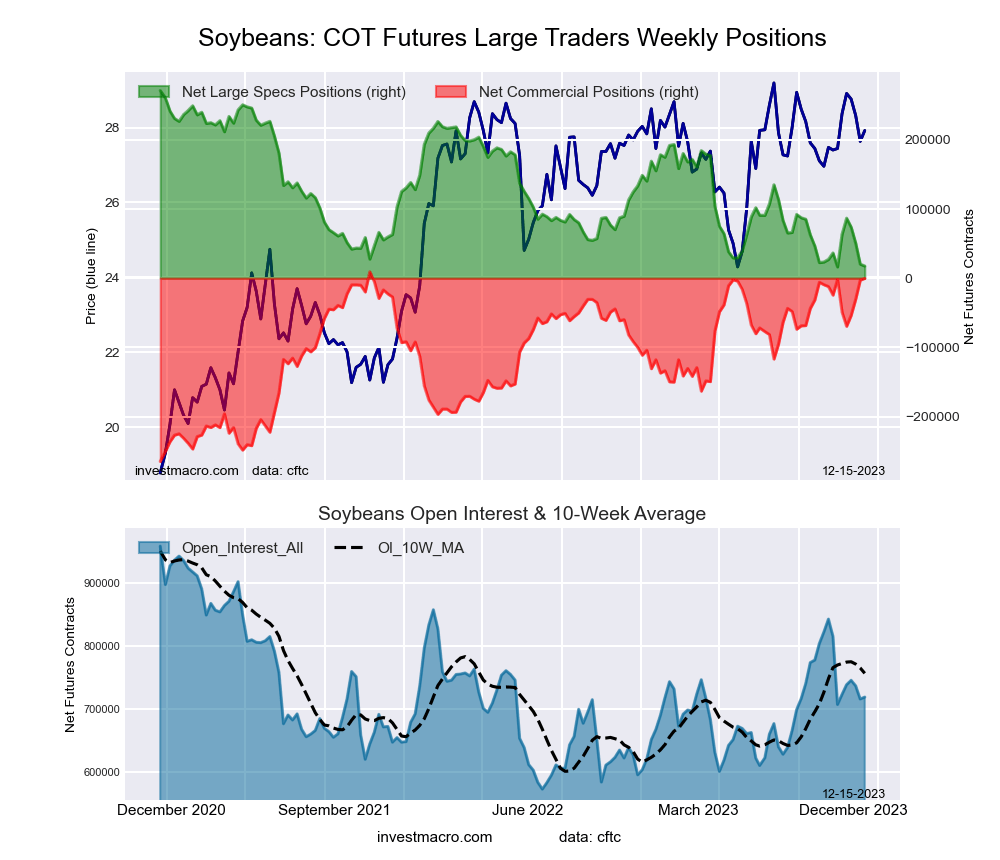 The SOYBEANS large speculator standing this week totaled a net position of 17,539 contracts in the data reported through Tuesday. This was a weekly reduction of -2,759 contracts from the previous week which had a total of 20,298 net contracts.
This week’s current strength score (the trader positioning range over the past three years, measured from 0 to 100) shows the speculators are currently Bearish-Extreme with a score of 0.5 percent. The commercials are Bullish-Extreme with a score of 96.6 percent and the small traders (not shown in chart) are Bullish with a score of 62.3 percent.
Price Trend-Following Model: Weak Downtrend (Possible Trend Change)
Our weekly trend-following model classifies the current market price position as: Weak Downtrend. The current action for the model is considered to be: Hold – Maintain Short Position.
| SOYBEANS Futures Statistics | SPECULATORS | COMMERCIALS | SMALL TRADERS |
| – Percent of Open Interest Longs: | 15.0 | 53.5 | 7.3 |
| – Percent of Open Interest Shorts: | 12.6 | 53.6 | 9.7 |
| – Net Position: | 17,539 | -216 | -17,323 |
| – Gross Longs: | 107,860 | 384,698 | 52,732 |
| – Gross Shorts: | 90,321 | 384,914 | 70,055 |
| – Long to Short Ratio: | 1.2 to 1 | 1.0 to 1 | 0.8 to 1 |
| NET POSITION TREND: | | | |
| – Strength Index Score (3 Year Range Pct): | 0.5 | 96.6 | 62.3 |
| – Strength Index Reading (3 Year Range): | Bearish-Extreme | Bullish-Extreme | Bullish |
| NET POSITION MOVEMENT INDEX: | | | |
| – 6-Week Change in Strength Index: | 0.5 | 0.6 | -6.9 |
SOYBEAN OIL Futures:
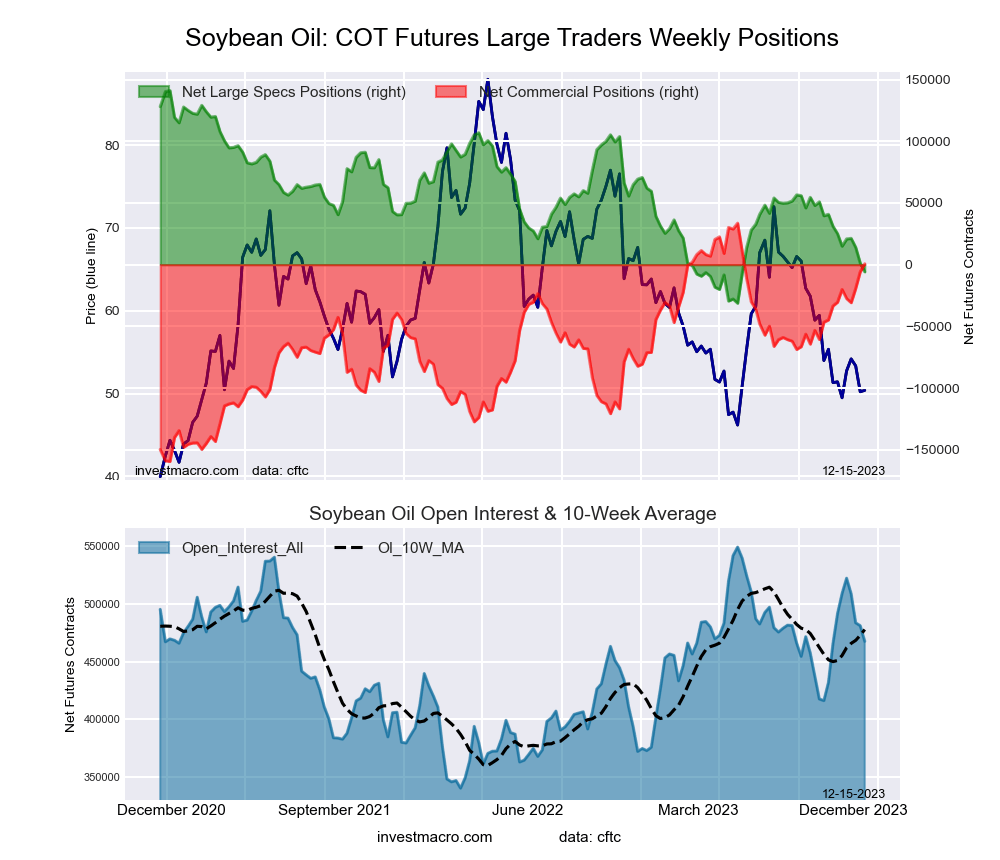 The SOYBEAN OIL large speculator standing this week totaled a net position of -5,804 contracts in the data reported through Tuesday. This was a weekly lowering of -7,060 contracts from the previous week which had a total of 1,256 net contracts.
This week’s current strength score (the trader positioning range over the past three years, measured from 0 to 100) shows the speculators are currently Bearish-Extreme with a score of 14.8 percent. The commercials are Bullish-Extreme with a score of 83.0 percent and the small traders (not shown in chart) are Bearish with a score of 32.6 percent.
Price Trend-Following Model: Downtrend
Our weekly trend-following model classifies the current market price position as: Downtrend. The current action for the model is considered to be: Hold – Maintain Short Position.
| SOYBEAN OIL Futures Statistics | SPECULATORS | COMMERCIALS | SMALL TRADERS |
| – Percent of Open Interest Longs: | 18.6 | 49.7 | 6.9 |
| – Percent of Open Interest Shorts: | 19.8 | 49.5 | 5.9 |
| – Net Position: | -5,804 | 699 | 5,105 |
| – Gross Longs: | 86,954 | 232,182 | 32,465 |
| – Gross Shorts: | 92,758 | 231,483 | 27,360 |
| – Long to Short Ratio: | 0.9 to 1 | 1.0 to 1 | 1.2 to 1 |
| NET POSITION TREND: | | | |
| – Strength Index Score (3 Year Range Pct): | 14.8 | 83.0 | 32.6 |
| – Strength Index Reading (3 Year Range): | Bearish-Extreme | Bullish-Extreme | Bearish |
| NET POSITION MOVEMENT INDEX: | | | |
| – 6-Week Change in Strength Index: | -17.9 | 16.1 | -0.8 |
SOYBEAN MEAL Futures:
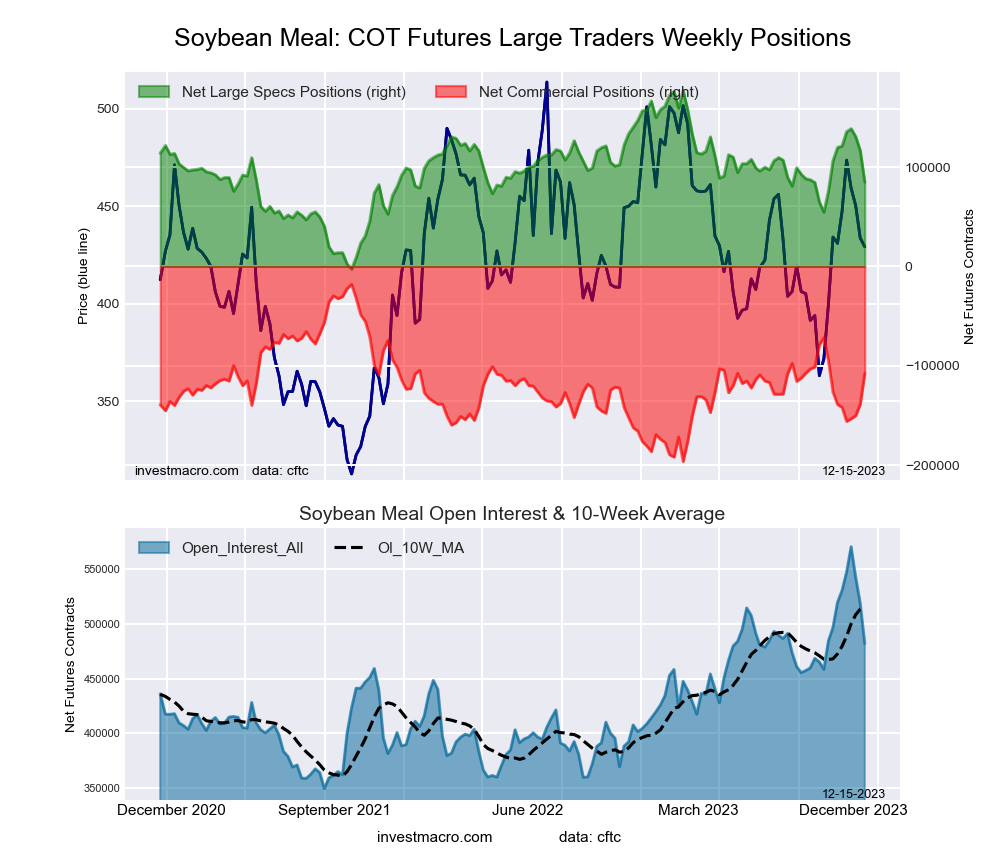 The SOYBEAN MEAL large speculator standing this week totaled a net position of 84,744 contracts in the data reported through Tuesday. This was a weekly decrease of -31,907 contracts from the previous week which had a total of 116,651 net contracts.
This week’s current strength score (the trader positioning range over the past three years, measured from 0 to 100) shows the speculators are currently Bearish with a score of 48.6 percent. The commercials are Bearish with a score of 49.8 percent and the small traders (not shown in chart) are Bullish with a score of 57.0 percent.
Price Trend-Following Model: Uptrend
Our weekly trend-following model classifies the current market price position as: Uptrend. The current action for the model is considered to be: Hold – Maintain Long Position.
| SOYBEAN MEAL Futures Statistics | SPECULATORS | COMMERCIALS | SMALL TRADERS |
| – Percent of Open Interest Longs: | 28.3 | 38.0 | 10.9 |
| – Percent of Open Interest Shorts: | 10.7 | 60.3 | 6.2 |
| – Net Position: | 84,744 | -107,389 | 22,645 |
| – Gross Longs: | 136,307 | 183,339 | 52,503 |
| – Gross Shorts: | 51,563 | 290,728 | 29,858 |
| – Long to Short Ratio: | 2.6 to 1 | 0.6 to 1 | 1.8 to 1 |
| NET POSITION TREND: | | | |
| – Strength Index Score (3 Year Range Pct): | 48.6 | 49.8 | 57.0 |
| – Strength Index Reading (3 Year Range): | Bearish | Bearish | Bullish |
| NET POSITION MOVEMENT INDEX: | | | |
| – 6-Week Change in Strength Index: | -19.4 | 17.7 | 15.5 |
LIVE CATTLE Futures:
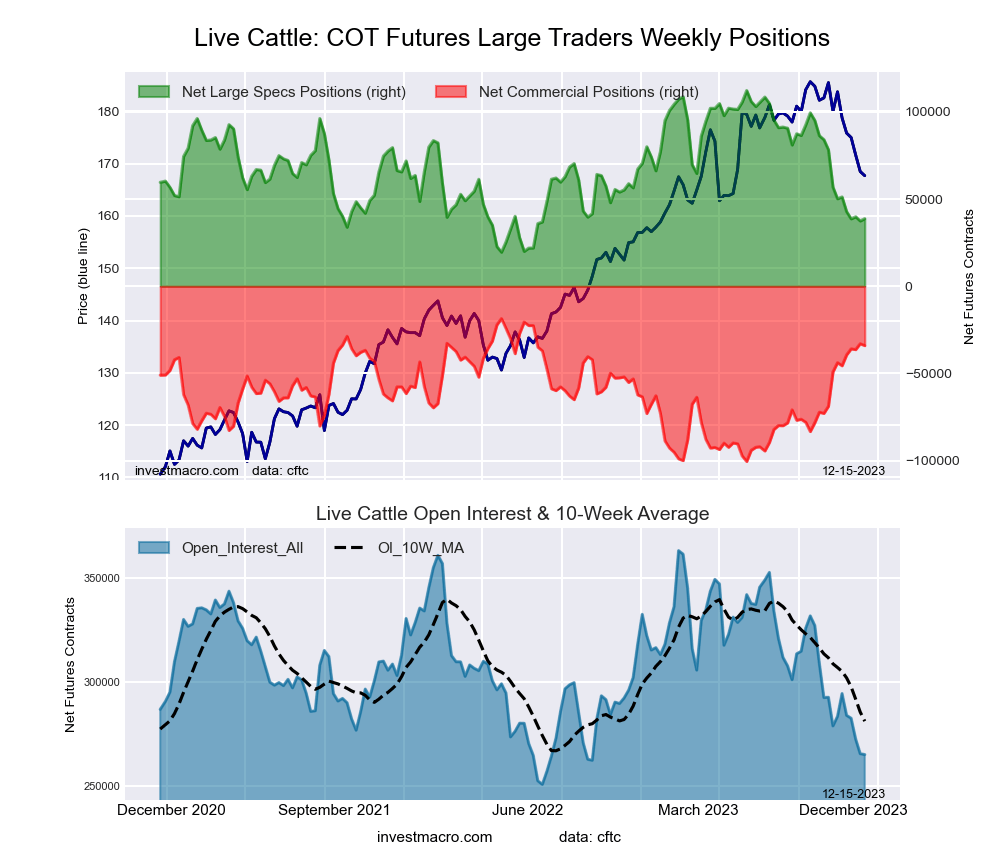 The LIVE CATTLE large speculator standing this week totaled a net position of 38,758 contracts in the data reported through Tuesday. This was a weekly advance of 1,300 contracts from the previous week which had a total of 37,458 net contracts.
This week’s current strength score (the trader positioning range over the past three years, measured from 0 to 100) shows the speculators are currently Bearish with a score of 20.7 percent. The commercials are Bullish-Extreme with a score of 81.1 percent and the small traders (not shown in chart) are Bullish with a score of 64.6 percent.
Price Trend-Following Model: Strong Downtrend
Our weekly trend-following model classifies the current market price position as: Strong Downtrend. The current action for the model is considered to be: Hold – Maintain Short Position.
| LIVE CATTLE Futures Statistics | SPECULATORS | COMMERCIALS | SMALL TRADERS |
| – Percent of Open Interest Longs: | 26.8 | 38.9 | 11.4 |
| – Percent of Open Interest Shorts: | 12.2 | 51.8 | 13.2 |
| – Net Position: | 38,758 | -34,044 | -4,714 |
| – Gross Longs: | 71,116 | 103,176 | 30,336 |
| – Gross Shorts: | 32,358 | 137,220 | 35,050 |
| – Long to Short Ratio: | 2.2 to 1 | 0.8 to 1 | 0.9 to 1 |
| NET POSITION TREND: | | | |
| – Strength Index Score (3 Year Range Pct): | 20.7 | 81.1 | 64.6 |
| – Strength Index Reading (3 Year Range): | Bearish | Bullish-Extreme | Bullish |
| NET POSITION MOVEMENT INDEX: | | | |
| – 6-Week Change in Strength Index: | -12.3 | 12.0 | 8.7 |
LEAN HOGS Futures:
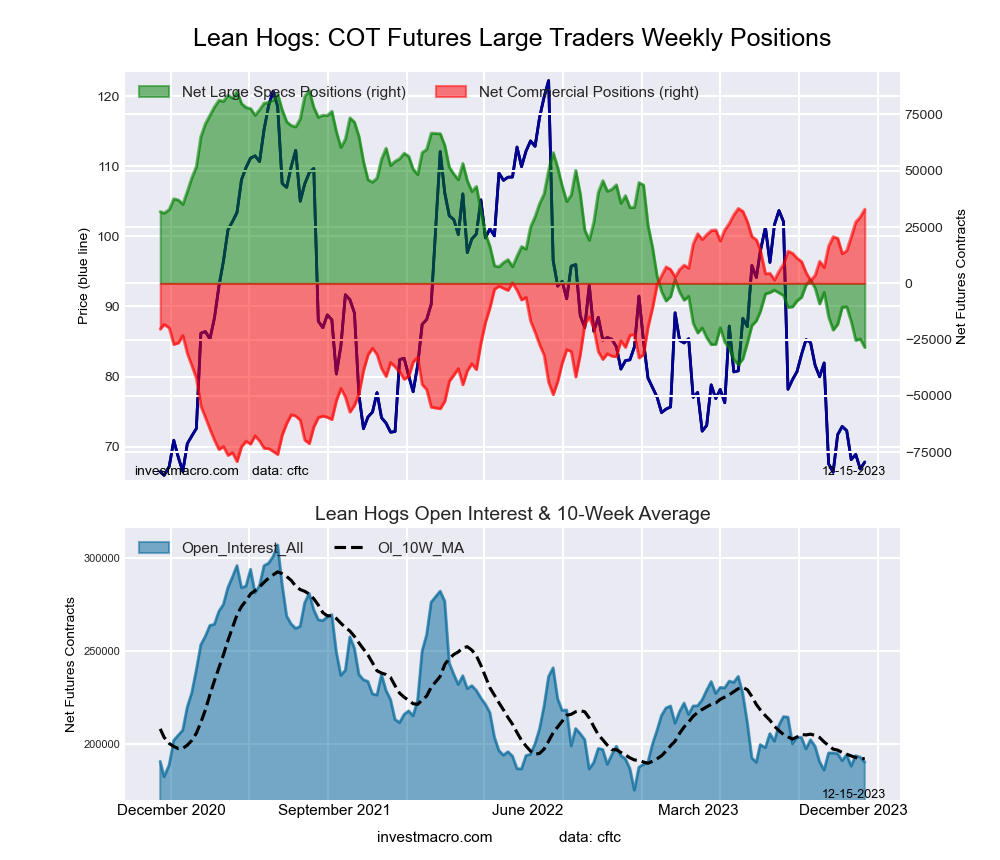 The LEAN HOGS large speculator standing this week totaled a net position of -28,455 contracts in the data reported through Tuesday. This was a weekly fall of -3,765 contracts from the previous week which had a total of -24,690 net contracts.
This week’s current strength score (the trader positioning range over the past three years, measured from 0 to 100) shows the speculators are currently Bearish-Extreme with a score of 6.3 percent. The commercials are Bullish-Extreme with a score of 99.7 percent and the small traders (not shown in chart) are Bullish with a score of 63.5 percent.
Price Trend-Following Model: Downtrend
Our weekly trend-following model classifies the current market price position as: Downtrend. The current action for the model is considered to be: Hold – Maintain Short Position.
| LEAN HOGS Futures Statistics | SPECULATORS | COMMERCIALS | SMALL TRADERS |
| – Percent of Open Interest Longs: | 28.5 | 40.8 | 8.5 |
| – Percent of Open Interest Shorts: | 43.5 | 23.5 | 10.8 |
| – Net Position: | -28,455 | 32,876 | -4,421 |
| – Gross Longs: | 54,212 | 77,622 | 16,150 |
| – Gross Shorts: | 82,667 | 44,746 | 20,571 |
| – Long to Short Ratio: | 0.7 to 1 | 1.7 to 1 | 0.8 to 1 |
| NET POSITION TREND: | | | |
| – Strength Index Score (3 Year Range Pct): | 6.3 | 99.7 | 63.5 |
| – Strength Index Reading (3 Year Range): | Bearish-Extreme | Bullish-Extreme | Bullish |
| NET POSITION MOVEMENT INDEX: | | | |
| – 6-Week Change in Strength Index: | -8.4 | 11.5 | -11.7 |
COTTON Futures:
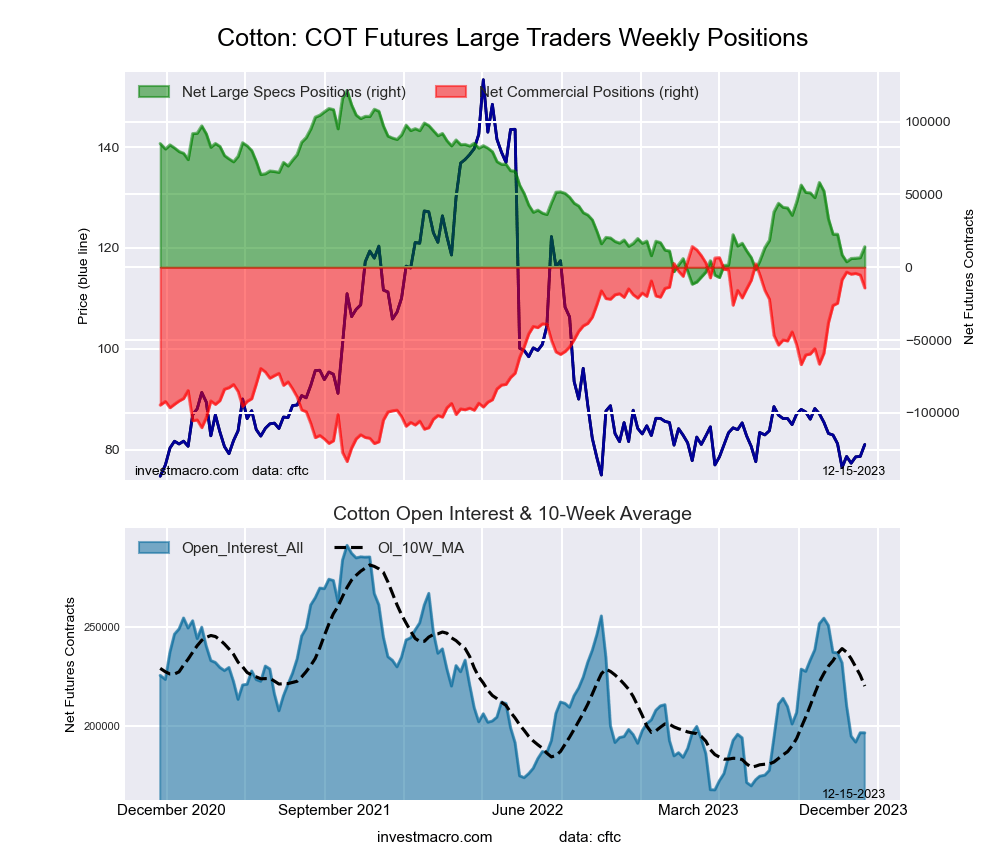 The COTTON large speculator standing this week totaled a net position of 14,104 contracts in the data reported through Tuesday. This was a weekly lift of 7,547 contracts from the previous week which had a total of 6,557 net contracts.
This week’s current strength score (the trader positioning range over the past three years, measured from 0 to 100) shows the speculators are currently Bearish-Extreme with a score of 19.3 percent. The commercials are Bullish-Extreme with a score of 80.8 percent and the small traders (not shown in chart) are Bearish-Extreme with a score of 16.3 percent.
Price Trend-Following Model: Downtrend
Our weekly trend-following model classifies the current market price position as: Downtrend. The current action for the model is considered to be: Hold – Maintain Short Position.
| COTTON Futures Statistics | SPECULATORS | COMMERCIALS | SMALL TRADERS |
| – Percent of Open Interest Longs: | 33.7 | 44.7 | 5.6 |
| – Percent of Open Interest Shorts: | 26.5 | 51.9 | 5.6 |
| – Net Position: | 14,104 | -14,147 | 43 |
| – Gross Longs: | 66,280 | 88,023 | 11,017 |
| – Gross Shorts: | 52,176 | 102,170 | 10,974 |
| – Long to Short Ratio: | 1.3 to 1 | 0.9 to 1 | 1.0 to 1 |
| NET POSITION TREND: | | | |
| – Strength Index Score (3 Year Range Pct): | 19.3 | 80.8 | 16.3 |
| – Strength Index Reading (3 Year Range): | Bearish-Extreme | Bullish-Extreme | Bearish-Extreme |
| NET POSITION MOVEMENT INDEX: | | | |
| – 6-Week Change in Strength Index: | -6.4 | 7.1 | -12.0 |
COCOA Futures:
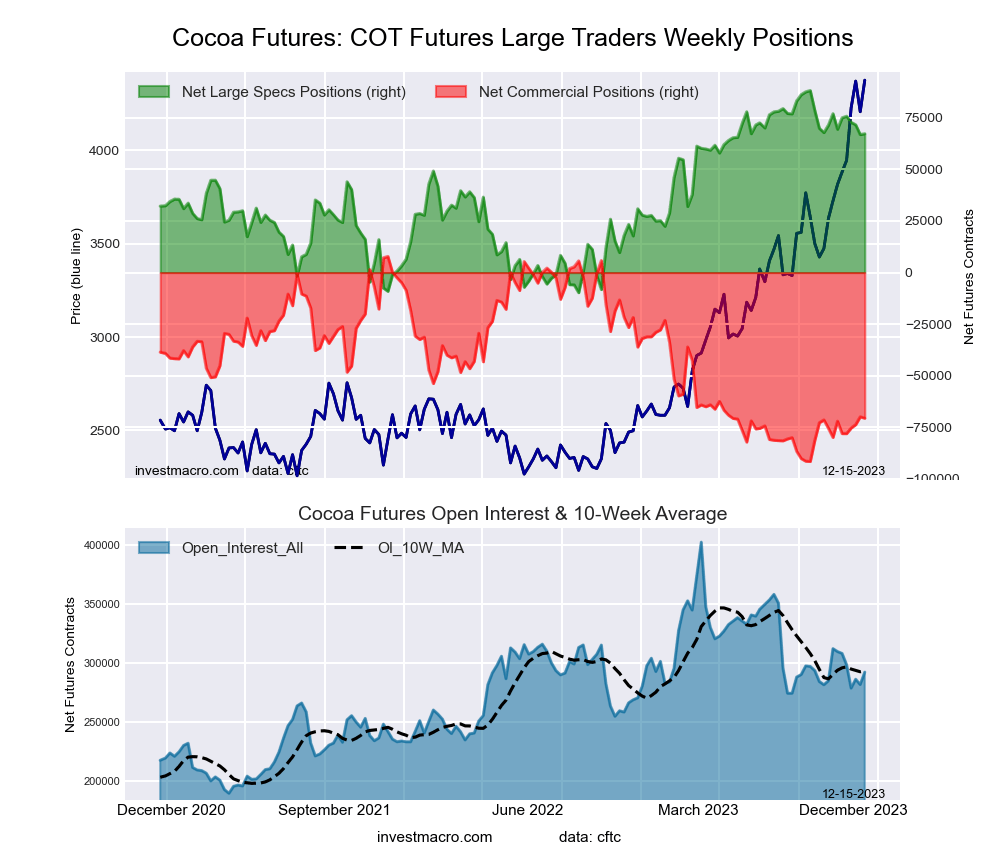 The COCOA large speculator standing this week totaled a net position of 67,303 contracts in the data reported through Tuesday. This was a weekly lift of 392 contracts from the previous week which had a total of 66,911 net contracts.
This week’s current strength score (the trader positioning range over the past three years, measured from 0 to 100) shows the speculators are currently Bullish with a score of 78.6 percent. The commercials are Bearish with a score of 21.1 percent and the small traders (not shown in chart) are Bearish with a score of 30.0 percent.
Price Trend-Following Model: Strong Uptrend
Our weekly trend-following model classifies the current market price position as: Strong Uptrend. The current action for the model is considered to be: Hold – Maintain Long Position.
| COCOA Futures Statistics | SPECULATORS | COMMERCIALS | SMALL TRADERS |
| – Percent of Open Interest Longs: | 40.6 | 27.0 | 5.5 |
| – Percent of Open Interest Shorts: | 17.6 | 51.2 | 4.4 |
| – Net Position: | 67,303 | -70,652 | 3,349 |
| – Gross Longs: | 118,747 | 79,020 | 16,150 |
| – Gross Shorts: | 51,444 | 149,672 | 12,801 |
| – Long to Short Ratio: | 2.3 to 1 | 0.5 to 1 | 1.3 to 1 |
| NET POSITION TREND: | | | |
| – Strength Index Score (3 Year Range Pct): | 78.6 | 21.1 | 30.0 |
| – Strength Index Reading (3 Year Range): | Bullish | Bearish | Bearish |
| NET POSITION MOVEMENT INDEX: | | | |
| – 6-Week Change in Strength Index: | -2.2 | 1.5 | 7.2 |
WHEAT Futures:
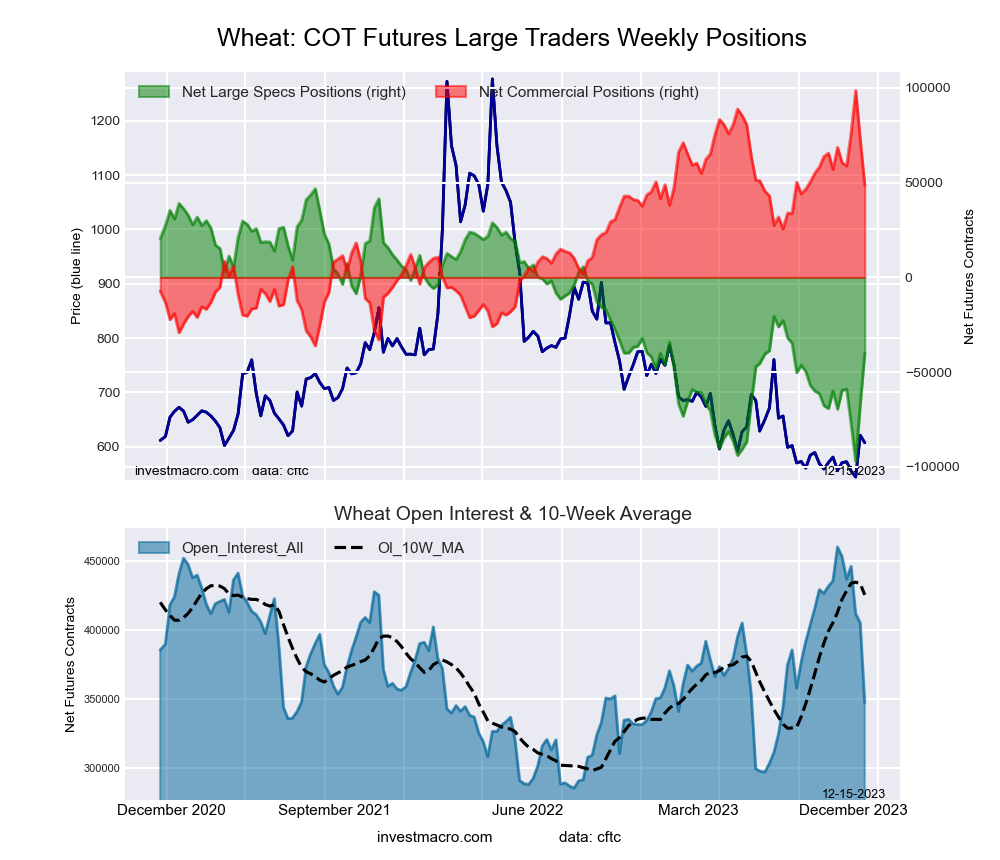 The WHEAT large speculator standing this week totaled a net position of -40,021 contracts in the data reported through Tuesday. This was a weekly gain of 27,046 contracts from the previous week which had a total of -67,067 net contracts.
This week’s current strength score (the trader positioning range over the past three years, measured from 0 to 100) shows the speculators are currently Bearish with a score of 39.7 percent. The commercials are Bullish with a score of 62.8 percent and the small traders (not shown in chart) are Bearish with a score of 29.1 percent.
Price Trend-Following Model: Weak Downtrend (Possible Trend Change)
Our weekly trend-following model classifies the current market price position as: Weak Downtrend. The current action for the model is considered to be: Hold – Maintain Short Position.
| WHEAT Futures Statistics | SPECULATORS | COMMERCIALS | SMALL TRADERS |
| – Percent of Open Interest Longs: | 31.2 | 38.9 | 8.1 |
| – Percent of Open Interest Shorts: | 42.7 | 25.0 | 10.5 |
| – Net Position: | -40,021 | 48,543 | -8,522 |
| – Gross Longs: | 108,383 | 135,276 | 28,033 |
| – Gross Shorts: | 148,404 | 86,733 | 36,555 |
| – Long to Short Ratio: | 0.7 to 1 | 1.6 to 1 | 0.8 to 1 |
| NET POSITION TREND: | | | |
| – Strength Index Score (3 Year Range Pct): | 39.7 | 62.8 | 29.1 |
| – Strength Index Reading (3 Year Range): | Bearish | Bullish | Bearish |
| NET POSITION MOVEMENT INDEX: | | | |
| – 6-Week Change in Strength Index: | 20.5 | -14.9 | -41.2 |
Article By InvestMacro – Receive our weekly COT Newsletter
*COT Report: The COT data, released weekly to the public each Friday, is updated through the most recent Tuesday (data is 3 days old) and shows a quick view of how large speculators or non-commercials (for-profit traders) were positioned in the futures markets.
The CFTC categorizes trader positions according to commercial hedgers (traders who use futures contracts for hedging as part of the business), non-commercials (large traders who speculate to realize trading profits) and nonreportable traders (usually small traders/speculators) as well as their open interest (contracts open in the market at time of reporting). See CFTC criteria here.


