Archive for Financial News – Page 17

USD/JPY to Quickly Return to Growth: Momentum Favours the US Dollar

By Analytical Department RoboForex

USD/JPY paused briefly midweek after a series of solid gains, currently trading at 157.59. The Japanese currency remains under pressure from a strengthening US dollar amid concerns that a prolonged conflict in the Middle East could keep energy prices elevated and heighten inflation risks.

The market has also revised its expectations for Federal Reserve rate cuts, shifting the likelihood of a reduction from July to September. Amid escalating geopolitical tensions, the dollar has emerged as a primary safe-haven asset, particularly as the US-Israel military operation against Iran enters its fifth phase.

US President Donald Trump suggested that the strikes could lead to a change of power in Iran. However, any new regime might prove equally problematic, underscoring the uncertainty surrounding the conflict’s outcome.

Japanese Finance Minister Satsuki Katayama reiterated that currency interventions remain a potential tool to support the yen. According to her, authorities are monitoring exchange rate dynamics with heightened urgency and are coordinating their actions with the US.

Technical Analysis

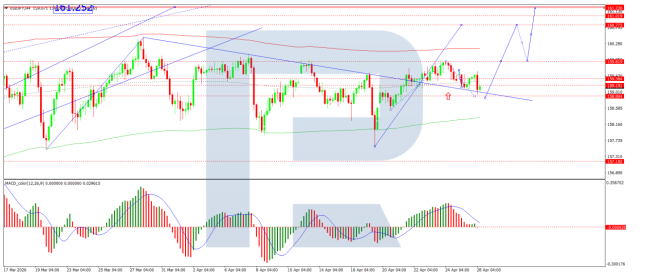
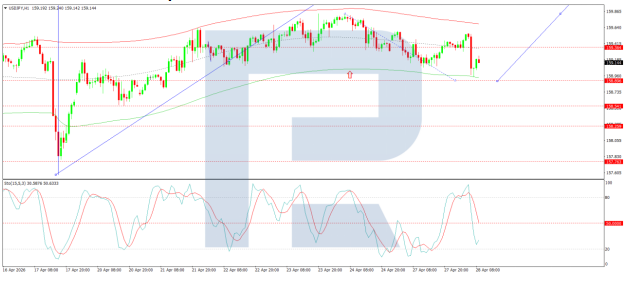
On the H4 USD/JPY chart, the market is forming a consolidation range around 157.00, which is currently extending to 157.92. A decline to test the 157.00 level from above is expected today. Following this, a potential growth leg towards 158.06 is likely. Technically, this scenario is supported by the MACD indicator, whose signal line is well above the zero line and pointing firmly downward.

On the H1 chart, USD/JPY is forming a downward wave pattern, targeting the 157.00 level, with a possible extension to 156.66, and further growth towards 158.38 anticipated thereafter. Technically, this scenario is confirmed by the Stochastic oscillator, with its signal line above the 20 level and pointing firmly downward.

Conclusion

USD/JPY’s brief consolidation appears temporary, with the broader trend favouring further upside for the dollar. Geopolitical tensions in the Middle East have reinforced the dollar’s safe-haven status, pushing back expectations for Fed rate cuts and creating a supportive backdrop for the pair. Despite verbal intervention warnings from Japanese officials, the technical outlook suggests USD/JPY is poised to resume its upward trajectory once the current correction runs its course.


Disclaimer

Any forecasts contained herein are based on the author’s particular opinion. This analysis may not be treated as trading advice. RoboForex bears no responsibility for trading results based on trading recommendations and reviews contained herein.

European equities plunge amid Persian Gulf military conflict

By JustMarkets 

The US stock market demonstrated impressive resilience on Monday: after a morning plunge, the indices almost completely recouped their losses. By the end of the day, the Dow Jones (US30) decreased by 0.15%. The S&P 500 (US500) gained 0.04%. The tech-heavy NASDAQ (US100) closed higher by 0.13%. The recovery was driven by a powerful wave of “buy-the-dip” activity focused on tech giants with massive liquidity reserves – Nvidia and Microsoft rose by 2.9% and 1.5%, respectively. Investors view “Big Tech” as a kind of “safe haven” within the technology sector, capable of weathering periods of high geopolitical turbulence.

Additional support came from the defense and energy sectors, which were direct beneficiaries of the escalation in the Middle East. Northrop Grumman shares soared 6% in response to the launch of Operation “Epic Fury,” while Exxon Mobil added 1.1% amid the oil rally caused by the blockade of the Strait of Hormuz.
The Canadian dollar (CAD) fell to 1.37 against the US dollar, testing a monthly low. The uniqueness of the situation lies in the fact that the “loonie” failed to benefit from the 8% spike in oil prices triggered by the blockade of the Strait of Hormuz and the death of Ayatollah Khamenei. Normally, the Canadian currency rises alongside energy prices, but the current dominance of the US dollar as the world’s primary haven and Canada’s internal economic issues have completely neutralized the “oil factor.” Fundamental pressure on the currency intensified following the release of Q4 GDP data, which confirmed a 0.6% contraction of the Canadian economy – the worst performance since the 2020 pandemic. Even the fact that the manufacturing PMI reached a 13-month high in February (51 points) failed to encourage investors.

Stock markets in Europe fell sharply. The German DAX (DE40) dropped 2.56%, the French CAC 40 (FR40) closed down 2.17%, the Spanish IBEX 35 (ES35) fell 2.64%, and the British FTSE 100 (UK100) closed down 1.20%. The German DAX 40 showed the worst performance among major European floors, crashing to 24,672 – the lowest closing level since early February. The decline affected almost all sectors of the German economy, as investors fear that the escalation of war in the Middle East and the blockade of the Strait of Hormuz will lead to a new round of inflation and indefinitely delay ECB interest rate cuts.

The most devastating blow hit the tourism and aviation sectors. Lufthansa shares plummeted 4.6% (with the drop exceeding 6% at one point) due to mass flight cancellations to the region and a sharp increase in jet fuel costs. The situation is even worse for the travel giant TUI, whose stock crashed nearly 9%. Investors are pricing in not only operational losses from tour disruptions but also the risk of a global decline in demand for long-haul travel under “wartime” uncertainty.
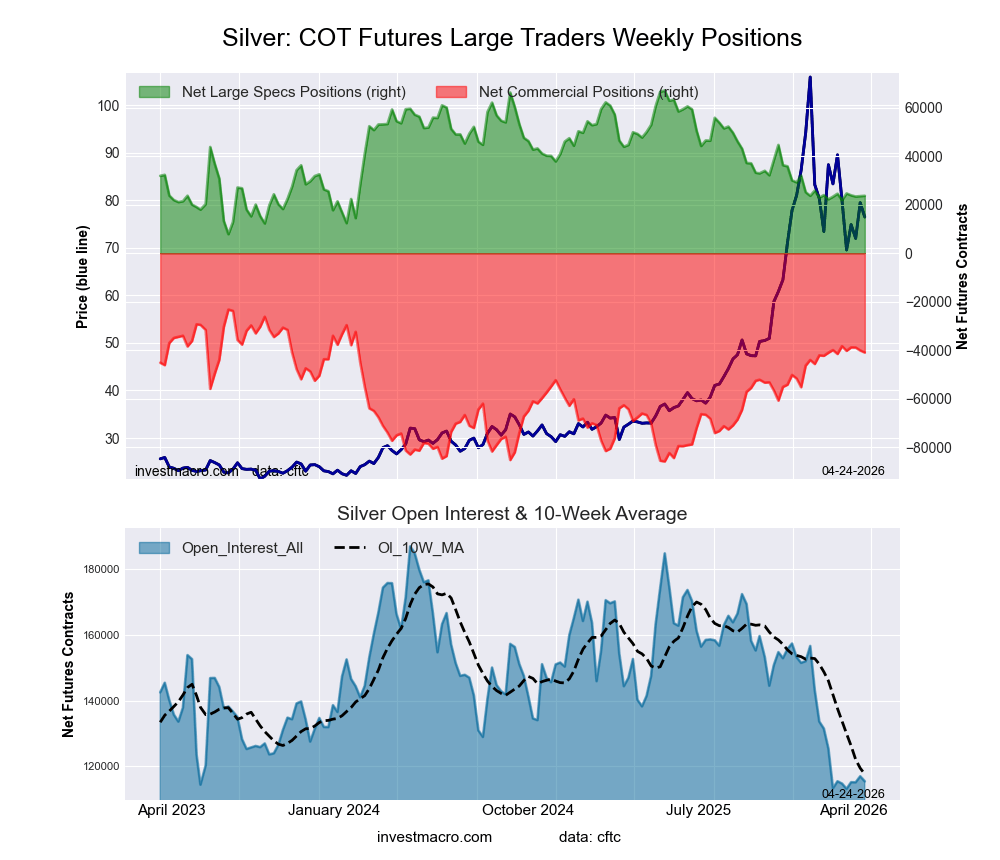
The silver (XAG) market saw a dramatic reversal: after a 3% rising morning surge, quotes collapsed by more than 6%, ending trade near $28. This “bearish” maneuver was caused by a sharp shift in market priorities. While gold maintained its safe-haven status, silver suffered due to its industrial nature. The blockade of the Strait of Hormuz and the death of Ayatollah Khamenei created a real threat of a global energy crisis. An additional blow came from US macroeconomic statistics: the jump in the ISM Manufacturing Prices Index to 70.5 (an 11.5-point increase) shocked markets, signaling a new wave of inflation. This triggered a spike in 10-year Treasury yields and pushed the US dollar Index to a five-week high.

WTI oil prices demonstrated explosive growth, soaring by more than 12% at one point to a high since June of last year. Although quotes stabilized around $71-$72 by the close of the session, the market remains in a state of unprecedented shock. The main trigger was the de facto halt of shipping through the Strait of Hormuz. Insurance companies began mass-canceling policies or raising premiums to prohibitive levels (up to 0.4% of the vessel’s value), forcing more than 150 tankers to anchor and wait for safety.

The situation was exacerbated by a direct attack on Saudi Arabia’s energy infrastructure. Drones struck the kingdom’s largest refinery in Ras Tanura (capacity 550,000 barrels per day). Although the fire was quickly localized, Saudi Aramco was forced to temporarily shut down the facility for safety reasons. This incident confirmed analysts’ worst fears: that Iranian retaliatory strikes would target not only US military logistics but also critical nodes of the world’s energy supply. With 20% of global oil passing through the closed strait, analysts at JPMorgan and Goldman Sachs warn: if the blockade lasts more than three weeks, oil prices will inevitably break the $100 per barrel level, creating an “inflationary tsunami” for the global economy.

Asian markets traded with mixed dynamics yesterday. The Japanese Nikkei 225 (JP225) decreased by 1.35% during the session, the FTSE China A50 (CHA50) rose by 0.30%, the Hong Kong Hang Seng (HK50) dropped 2.14%, and the Australian ASX 200 (AU200) showed a positive result of 0.03%.

The Australian dollar (AUD) recovered to $0.71, partially offsetting Monday’s sharp fall. The driver of this growth was the hawkish rhetoric of RBA Governor Michele Bullock, who, against the backdrop of the Middle East crisis, shifted from a policy of patience to a readiness for action. Bullock explicitly warned that the surge in oil prices due to the conflict surrounding Iran carries serious inflationary risks for Australia and confirmed that the regulator would consider a rate hike at the March meeting. This triggered a revision of market expectations: the probability of a 25-basis-point hike in March is now estimated at 28%, with full policy tightening expected by May.

S&P 500 (US500) 6,881.62 +2.74 (+0.04%)

Dow Jones (US30) 48,904.78 −73.14 (−0.15%)

DAX (DE40) 24,638.00 −646.26 (−2.56%)

FTSE 100 (UK100) 10,780.11 −130.44 (−1.20%)

USD Index 98.54 +0.93% (+0.95%)

News feed for: 2026.03.03

  • Japan Unemployment Rate (m/m) at 01:30 (GMT+2); – JPY (MED)
  • Japan BOJ Gov Ueda Speaks at 06:00 (GMT+2); – JPY (LOW)
  • Eurozone Consumer Price Index (m/m) at 12:00 (GMT+2); – EUR (MED)
  • UK Annual Budget Release at 14:30 (GMT+2). – GBP (MED)

By JustMarkets


This article reflects a personal opinion and should not be interpreted as an investment advice, and/or offer, and/or a persistent request for carrying out financial transactions, and/or a guarantee, and/or a forecast of future events.

Gold Rallies for Fifth Day, With External Risks Mounting

By Analytical Department RoboForex

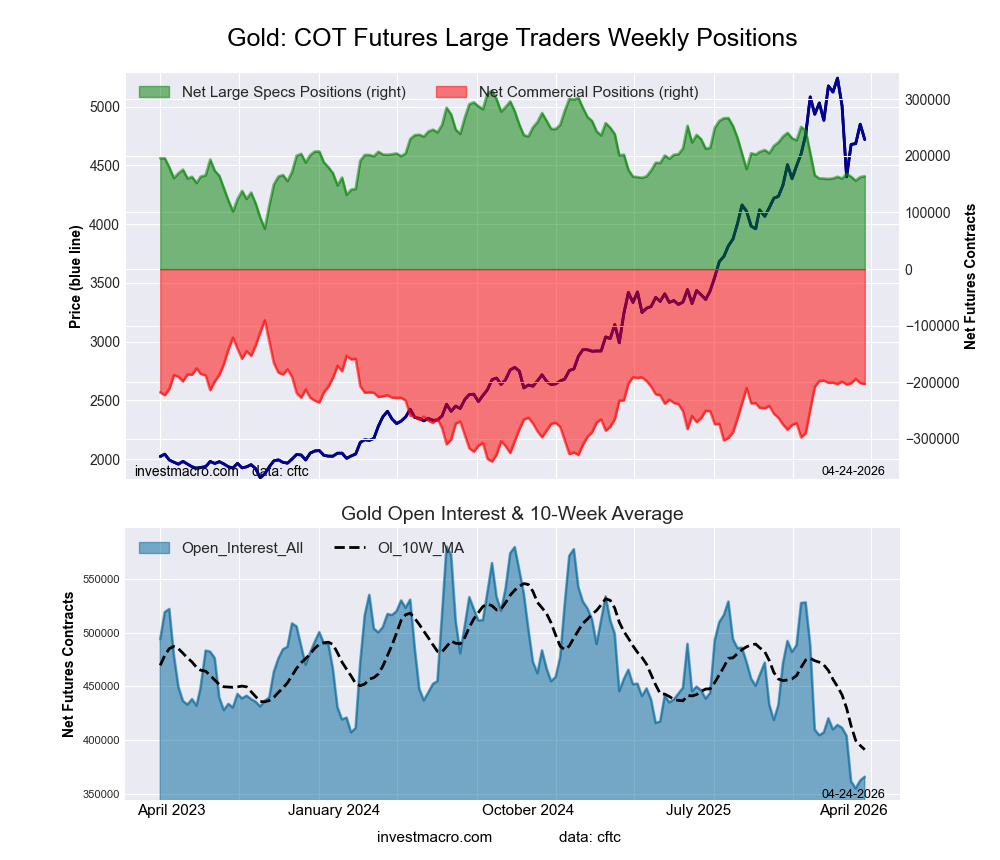
Gold rose to 5,350 USD per ounce on Tuesday, marking its fifth consecutive session of gains. Demand for safe-haven assets continues to grow amid the escalating conflict in the Middle East.

President Donald Trump stated that the United States will continue its strikes on Iran until the country loses its ability to pose a threat. According to him, the conflict could last a month or “much longer.” In response, Iran has announced the closure of the Strait of Hormuz and threatened attacks on ships passing through this strategically vital energy corridor.

The worsening conflict has triggered a sharp rise in oil prices and intensified fears of accelerating US inflation. This has led to selling in US government bonds and a reassessment of expectations for further Federal Reserve rate cuts.

The market is now shifting its forecast for the next Fed rate cut to September, later than previously anticipated.

Technical Analysis

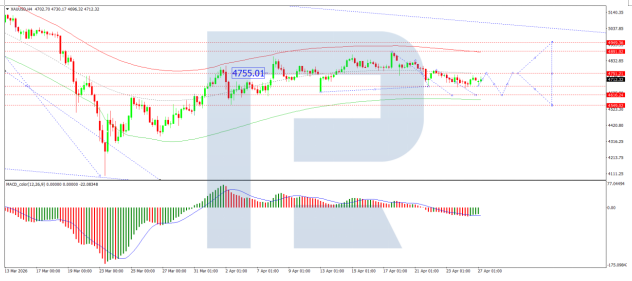
On the H4 XAU/USD chart, the market is forming a consolidation range around the 5,353 USD level. A downside breakout would open the way for a continuation of the correction towards 5,130 USD. Conversely, an upside breakout would open up potential for a wave towards the 5,599 USD level. The MACD indicator confirms the current momentum, with its signal line at highs and pointing strictly upwards.

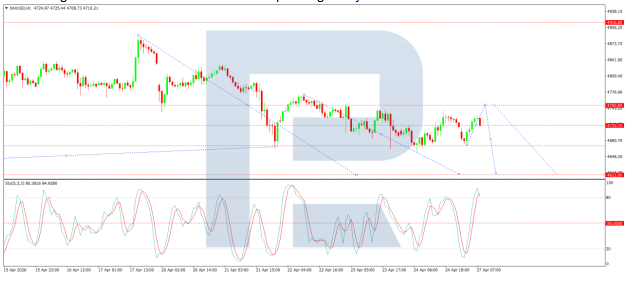
On the H1 chart, the market has broken below the 5,333 USD level, suggesting a continuation of the trend towards 5,166 USD, with the potential for the wave to extend further to 5,130 USD. The stochastic oscillator supports this scenario, with its signal line remaining above the 80 level and under pressure to turn lower towards the 20 level.

Conclusion

Gold’s rally to record highs reflects escalating demand for safe-haven assets amid intensifying geopolitical risks in the Middle East. The conflict has not only boosted bullion but also lifted oil prices and stoked concerns about inflation, prompting markets to push back expectations for Fed rate cuts. While the short-term technical outlook remains bullish, traders are watching for potential corrections following such a strong upward move.


Disclaimer

Any forecasts contained herein are based on the author’s particular opinion. This analysis may not be treated as trading advice. RoboForex bears no responsibility for trading results based on trading recommendations and reviews contained herein.

Iran Crisis: A Dangerous Turning Point

By ForexTime 

  • US-Israel strikes kill Iran’s supreme leader
  • Oil benchmarks surge over 10% on Sunday open
  • Safe-haven assets Gold/Silver also gap higher
  • Risk-off may be name of game ahead of packed week
  • Cheat sheet of potential winners and losers

Over the weekend, US–Israel strikes killed Iran’s Supreme Leader, Ayatollah Ali Khamenei – a dangerous turning point in an already distressed region.

Tehran fired back at Israel and hit US bases across the Gulf.

This explosive development came as a surprise, given there was an agreement to hold further talks over the coming weeks.

With missiles still flying, the risk of a full-blown regional escalation is growing by the minute.

And this was reflected on Sunday when markets opened with sharp gaps from Friday’s close amid the chaos.

  • BRENT: ↑ 8%
  • WTI: ↑7%
  • XAUUSD: ↑2%
  • XAGUSD: ↑1%

Note: Prices shown represent the gap from Friday’s close.

Here’s a cheat sheet of assets that could win/lose:


POTENTIAL WINNERS:

  • VIX (Volatility Index)

The primary beneficiary as market fear spikes; prices may surge as investors hedge against a wider regional conflict.

  • Safe-haven assets – (XAUUSD, XAGUSD, JPY, CHF, USD)

As risk aversion intensifies, investors may rush to safe-haven destinations.

  • Oil benchmarks – (WTI, Brent)

The US-Israeli war against Iran has plunged the global crude market into turmoil, with the effective closure of the critical Strait of Hormuz fuelling supply side fears.


POTENTIAL LOSERS:

  • Global equities – (CN50, EU50, UK100, US500, NAS100, US30)

As investors scramble for safety amid the chaos, global equities may face fresh selling pressure.

  • Bitcoin, Ethereum, Altcoins

Overall uncertainty and caution may repel investors from cryptos in favour of precious metals or safe-haven FX currencies.

There have been reports that Trump intends to engage in new talks with Iran’s new leadership.

Nevertheless, the Iran crisis has entered a new phase which could mean heightened levels of volatility over the next few days to weeks.

And with volatility comes opportunity.

Don’t miss out.


Forex-Time-LogoArticle by ForexTime


ForexTime Ltd (FXTM) is an award winning international online forex broker regulated by CySEC 185/12 www.forextime.com

Oil prices have seen their largest surge in 4 years amid the military conflict in the Persian Gulf.

By JustMarkets 

On Friday, trading on the US stock market ended with a decline. By the end of Friday, the Dow Jones (US30) Index fell by 1.05% (-1.15% for the week). The S&P 500 (US500) dropped by 0.43% (-0.38% for the week). The tech-heavy NASDAQ (US100) closed lower by 0.30% (+0.51% for the week). The primary blow was a “hot” Producer Price Index (PPI) report, where the core figure jumped by 0.8%, confirming that companies are actively passing increased tariff costs onto consumers. This sharply reduced the chances of Fed easing, and the escalation in the Persian Gulf added fuel to the fire, sending oil prices and inflation expectations skyrocketing.

Market tranquility was shattered over the weekend. On February 28, 2026, the United States and Israel launched a large-scale military operation, “Epic Fury,” against Iran. In response, Tehran launched missile strikes on US bases in the UAE, Qatar, and Kuwait, while the Islamic Revolutionary Guard Corps announced the closure of the Strait of Hormuz. As up to 30% of global seaborne oil trade passes through this route, experts predict oil prices could jump to $100 per barrel. This creates a risk of a new wave of stagflation for Europe and other nations.

European equity markets mostly rose. The German (DE40) fell 0.02% (+0.86% for the week), the French CAC 40 (FR40) closed down 0.47% (+1.29% for the week), the Spanish IBEX 35 (ES35) dropped 0.73% (+0.73% for the week), and the British FTSE 100 (UK100) closed up 0.59% (+2.31% for the week). However, European exchanges opened with a crash. Markets are reacting to the critical escalation in the Middle East: the death of Iran’s Supreme Leader Ayatollah Ali Khamenei and the de facto blockade of the Strait of Hormuz have threatened Europe’s energy security. Amid record-low gas reserves in underground storage facilities, the spike in energy prices intensifies stagflation risks, forcing investors to price in a more hawkish ECB policy. The macroeconomic backdrop remains concerning: while inflation in Germany slowed in February, its acceleration in France and Spain gives the regulator little cause for optimism. Money markets now price the probability of a rate cut by year-end at just 30%.

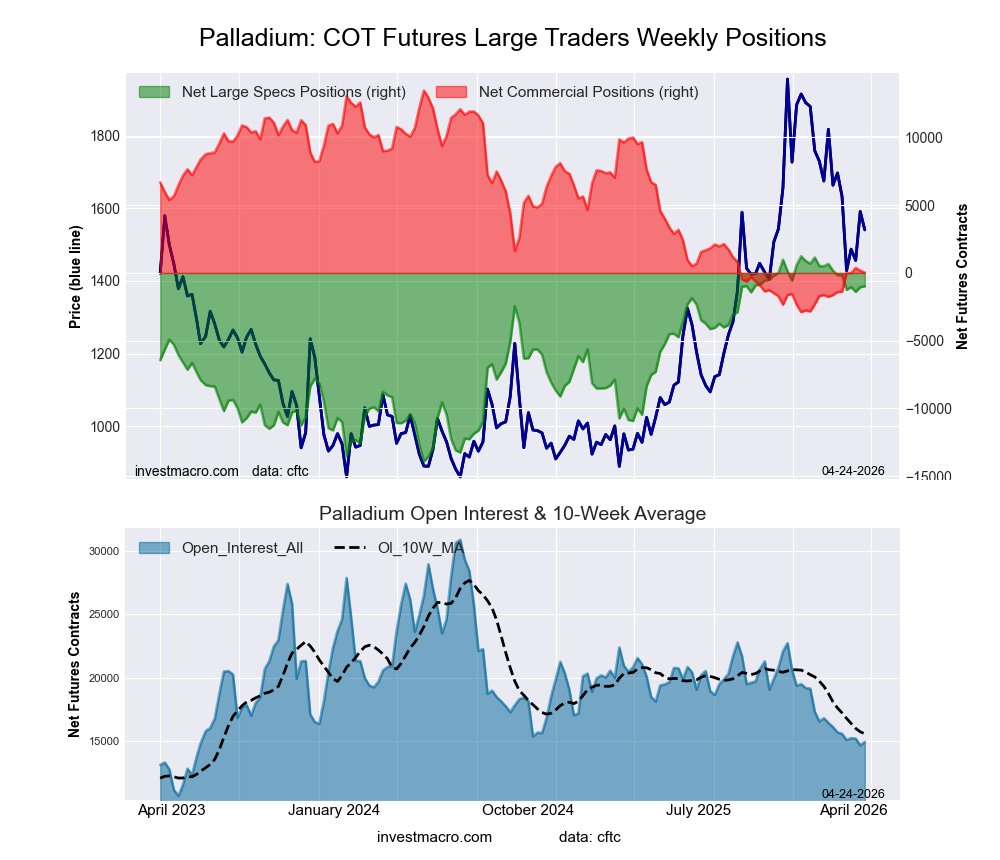
Palladium (XPD) prices jumped above $1,800 per ounce, reaching a monthly high amid the large-scale military conflict in the Middle East. The death of Iran’s Supreme Leader and Donald Trump’s tough rhetoric regarding the continuation of Operation “Epic Fury” triggered panic buying of precious metals. Geopolitical chaos has collided with an acute supply deficit: production disruptions in South Africa and the risk of new sanctions against Russian exports (which account for about 40% of the global market) threaten long-term supply chain ruptures for the automotive industry. Future price dynamics will depend on dollar stability and Friday’s Non-farm Payrolls report. If the US labor market remains strong, the dollar will continue to rise, potentially limiting the palladium rally.

WTI oil prices jumped over 6%, settling above $71 per barrel (after a brief 10% spike). This is an eight-month high triggered by the start of Operation “Epic Fury” – unprecedented strikes by the US and Israel on Iran on February 28. Markets are pricing in the risk of a total blockade of the Strait of Hormuz, through which approximately 20% of global oil supplies flow. Against the backdrop of the escalation, the OPEC+ decision made on Sunday appears extremely cautious: the alliance will increase production in April by only 206,000 barrels per day. This is half the previously discussed volume (up to 548,000 bpd) and clearly insufficient to offset the potential loss of Iranian exports. Investors await the US market open, where a supply deficit combined with a rising geopolitical premium could push quotes to the $80-85 level as early as this week.

Asian markets traded with mixed dynamics last week. The Japanese Nikkei 225 (JP225) rose 3.60% for the week, the Chinese FTSE China A50 (CHA50) fell 1.47%, the Hong Kong Hang Seng (HK50) dropped 1.30%, and the Australian ASX 200 (AU200) showed a positive 5-day result of 1.03%.

The Hang Seng Index plunged 667 points (-2.5%), hitting a six-week low. The sell-off was triggered by the sharp escalation of the war: following the deaths of three US service members, Donald Trump vowed “revenge” and pledged to continue Operation “Epic Fury” until Iran’s military potential is fully destroyed. The confirmed death of Ayatollah Khamenei and the blockade of the Strait of Hormuz threatened global oil supplies, causing a collapse in tech giants and airline stocks due to fuel crisis fears. Mainland Chinese indices served as a partial counterweight, showing moderate growth. Investors are betting on the “Two Sessions” of the NPC starting March 4: amidst a new major war in the Middle East, the market expects Beijing to sharply increase government spending on technological sovereignty and the launch of the 15th Five-Year Plan (2026-2030).

The Australian dollar (AUD) fell to $0.70, completely erasing last week’s gains. As a typical “risk-on” currency, the “aussie” suffered from a global flight to safety (US dollar and gold). Direct Iranian strikes on US bases in Gulf countries and Jordan, alongside the blockade of the Strait of Hormuz, have jeopardized global supply chains to which Australia’s economy is highly sensitive. Domestic statistics added pressure: Australia’s Manufacturing PMI was revised down to 51.0 – a four-month low.

S&P 500 (US500) 6,878.88 −29.98 (−0.43%)

Dow Jones (US30) 48,977.92 −521.28 (−1.05%)

DAX (DE40) 25,284.26 −4.76 (−0.02%)

FTSE 100 (UK100) 10,910.55 +63.85 (+0.59%)

USD Index 97.65 −0.15% (−0.15%)

News feed for: 2026.03.02

  • Australia Manufacturing PMI (m/m) at 00:00 (GMT+2); – AUD (MED)
  • Japan Manufacturing PMI (m/m) at 02:30 (GMT+2); – JPY (MED)
  • German Retail Sales (m/m) at 09:00 (GMT+2); – EUR (MED)
  • Switzerland Retail Sales (m/m) at 09:30 (GMT+2); – CHF (MED)
  • Switzerland Manufacturing PMI (m/m) at 09:30 (GMT+2); – CHF (LOW)
  • Eurozone Manufacturing PMI (m/m) at 11:00 (GMT+2); – EUR (MED)
  • UK Manufacturing PMI (m/m) at 11:30 (GMT+2); – GBP (MED)
  • Eurozone ECB President Lagarde Speaks at 16:00 (GMT+2); – EUR (LOW)
  • Canada Manufacturing PMI (m/m) at 16:30 (GMT+2); – CAD (MED)
  • US ISM Manufacturing PMI (m/m) at 17:00 (GMT+2); – USD (MED)
  • Australia RBA Gov Bullock Speaks at 23:10 (GMT+2). – AUD (LOW)

By JustMarkets


This article reflects a personal opinion and should not be interpreted as an investment advice, and/or offer, and/or a persistent request for carrying out financial transactions, and/or a guarantee, and/or a forecast of future events.

EUR/USD Reacts to Geopolitics and Data: Week Opens Nervously

By Analytical Department RoboForex

EUR/USD rose to 1.1790 on Monday. The US dollar attempted to strengthen, but part of its rally was subsequently pared back. Demand for safe-haven assets intensified over the weekend amid an escalation of the conflict in the Middle East.

The US and Israel conducted strikes on Iran, resulting in the death of the country’s supreme leader, Ayatollah Ali Khamenei. Reports also emerged of the effective closure of the Strait of Hormuz, a crucial route for global oil supplies. Tehran has responded with attacks on American targets in the region, fuelling fears of a broader conflict.

Additional support for the dollar came from US producer inflation data. January’s PPI rose more sharply than expected, suggesting that companies are passing on tariff-related costs to consumers, which complicates the outlook for a potential Federal Reserve rate cut.

Nevertheless, the market continues to price in two 25-basis-point rate cuts from the Fed this year. The prevailing sentiment is that volatility and geopolitical risks could eventually force the central bank to ease its monetary policy.

Technical Analysis

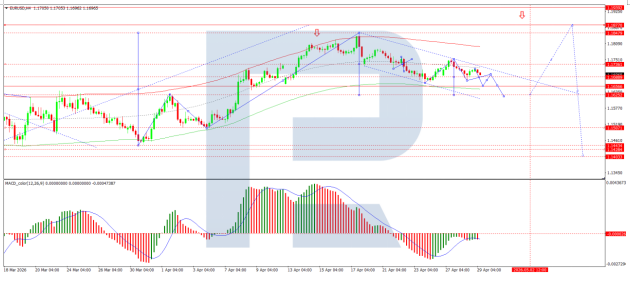
On the H4 chart of EUR/USD, the market is forming a consolidation range around the 1.1834 level. A downside breakout is expected, with the decline continuing to 1.1712, and the potential for the trend to extend further to 1.1590. Technically, this bearish scenario is confirmed by the MACD indicator, whose signal line is below zero and pointing firmly downwards, reflecting sustained bearish momentum.

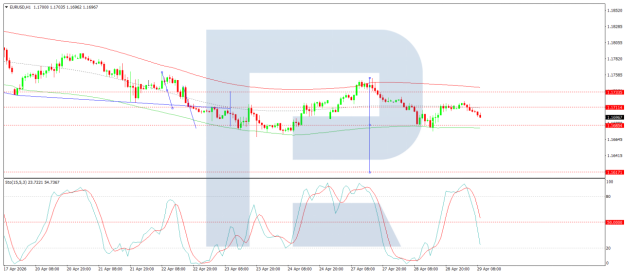
On the H1 chart, the market is forming the structure of the next downward wave towards 1.1712. After reaching this level, a corrective rise to 1.1768 is anticipated, followed by the start of a new downward wave to 1.1650. Technically, this scenario is supported by the Stochastic oscillator, with its signal line below 50 and pointing firmly downwards towards the 20 level.

Conclusion

The euro is navigating a complex landscape, with safe-haven flows and geopolitical tensions in the Middle East initially boosting the US dollar, while hotter-than-expected US PPI data adds another layer of uncertainty to Fed policy. Although the market still anticipates rate cuts later this year, the immediate technical outlook for EUR/USD appears bearish, suggesting further downside in the short term.


Disclaimer

Any forecasts contained herein are based on the author’s particular opinion. This analysis may not be treated as trading advice. RoboForex bears no responsibility for trading results based on trading recommendations and reviews contained herein.

US-Iran deal on the brink of collapse. Market prices geopolitical premium into oil

By JustMarkets 

The US stock market traded mixed on Thursday. By the end of trading, the Dow Jones (US30) rose by 0.03%, the S&P 500 (US500) decreased by 0.54%, and the technology-heavy NASDAQ (US100) closed lower by 1.18%. The primary event of the day was the paradoxical reaction to Nvidia’s earnings report: despite strong financial results, the company’s shares tumbled by 5.5%. Investors began to harbor serious doubts that massive capital investments in artificial intelligence would pay off in the long term, triggering a chain reaction and a decline across other chipmakers. Amid the flight from the overheated AI sector, a notable rotation of capital toward more stable and defensive assets was observed.

Mexican peso (MXN) weakened to 17.2 per dollar. The main blow came from new US tariffs: following the Supreme Court’s February 20 decision, the Trump administration introduced a 15% global import surcharge. This sharply reduced the peso’s attractiveness, as Mexico is the United States’ largest trading partner with deeply integrated supply chains. The situation was exacerbated by weak labor market data: in January 2026, Mexico lost 8,100 formal jobs, marking the worst start to a year since 2014.

Equity markets in Europe rose sharply. The German DAX (DE40) increased by 0.45%, the French CAC 40 (FR40) closed up 0.72%, the Spanish IBEX 35 (ES35) rose by 0.19%, and the British FTSE 100 (UK100) finished 0.37% higher.

WTI oil prices demonstrated a sharp reversal, climbing 1.5% to the $66.30 per barrel level. Earlier in the session, prices had fallen nearly 3% amid optimistic comments from Omani mediators; however, market sentiment shifted abruptly following a harsh statement from Tehran. Iranian state media reported that the country would not allow the removal of enriched uranium, a key US demand, placing the Geneva negotiations on the brink of collapse. The situation is heating up as the deadline set by Donald Trump approaches: the President gave only a few days to reach a deal, threatening military action otherwise. The market immediately priced in a geopolitical premium, fearing supply disruptions from a major OPEC producer. At the same time, fundamental factors remain bearish: Saudi Arabian exports hit a three-year high, and on Sunday, March 1, OPEC+ countries will discuss increasing production by 137,000 barrels per day starting in April.

US natural gas (XNG) prices fell by more than 1.5%, dropping to the $2.82 per MMBtu mark. This is the lowest price level since last September. The primary bearish factor was the weekly report from the EIA, which showed an extremely weak inventory reduction of only 52 billion cubic feet (BCF). For comparison, in the same period in 2025, the withdrawal was 252 bcf, while the five-year average stands at 168 BCF. This dynamic led to a sharp shift in the market balance.
Asian markets traded with mixed results yesterday. The Japanese Nikkei 225 (JP225) rose by 0.29%, the Chinese FTSE China A50 (CHA50) showed a decline of 0.38%, the Hong Kong Hang Seng (HK50) fell by 1.44%, and the Australian ASX 200 (AU200) posted a positive result of 0.51%.

Investors moved into wait-and-see mode ahead of the “Two Sessions” in Beijing (March 4-11), where economic targets for 2026 will be established. The main event will be the presentation of the 15th Five-Year Plan (2026-2030), which will define China’s strategy for achieving technological independence and supporting domestic demand. The market is pricing in a budget deficit of 4% of GDP and a growth target of around 5%, which is keeping quotes from a deep correction.

On Friday, the Australian dollar (AUD) was holding near $0.711, approaching a three-year high. The “aussie” has become the top performer among G10 currencies in 2026 (+6% year-to-date), driven by the aggressive stance of the Reserve Bank of Australia (RBA). Following an unexpected jump in inflation, the market prices in an 80% probability of a rate hike in May, expecting it to peak at 4.10%. Next week, traders’ attention will shift to GDP data and manufacturing PMI indices. If the economy proves resilient to high rates, the Australian dollar could consolidate above the 0.72 level.

S&P 500 (US500) 6,908.86 −37.27 (−0.54%)

Dow Jones (US30) 49,499.20 +17.05 (+0.034%)

DAX (DE40) 25,289.02 +113.08 (+0.45%)

FTSE 100 (UK100) 10,846.70 +40.29 +(0.37%)

USD Index 97.76 +0.06% (+0.06%)

News feed for: 2026.02.27

  • Japan Tokyo Core CPI (m/m) at 01:30 (GMT+2); – JPY (MED)
  • Japan Industrial Production (m/m) at 01:50 (GMT+2); – JPY (LOW)
  • Japan Retail Sales (m/m) at 01:50 (GMT+2); – JPY (MED)
  • Switzerland Retal Sales (m/m) at 09:30 (GMT+2); – CHF (LOW)
  • Switzerland GDP (q/q) at 10:00 (GMT+2); – CHF (MED)
  • Switzerland KOF Leading Indicators (m/m) at 10:00 (GMT+2); – CHF (LOW)
  • German Unemployment Rate (m/m) at 10:55 (GMT+2); – EUR (LOW)
  • German Consumer Price Index (m/m) at 15:00 (GMT+2); – EUR (MED)
  • Canada GDP (q/q) at 15:30 (GMT+2); – CAD (MED)
  • US Producer Price Index (m/m) at 15:30 (GMT+2); – USD (HIGH)
  • US Chicago PMI (m/m) at 16:45 (GMT+2). – USD (MED)

By JustMarkets


This article reflects a personal opinion and should not be interpreted as an investment advice, and/or offer, and/or a persistent request for carrying out financial transactions, and/or a guarantee, and/or a forecast of future events.

USD/JPY Declines, but the Overall Outlook for the Yen Remains Hazy

By Analytical Department RoboForex

USD/JPY is trading lower at 155.79 on Friday. Meanwhile, the yen remains under pressure at the end of the week. It is on track to record a second consecutive weekly decline amid ongoing uncertainty surrounding Bank of Japan (BoJ) policy.

This week, the Japanese government nominated two academics known for favouring loose monetary policy to the BoJ board. Prime Minister Sanae Takaichi, following a meeting with BoJ Governor Kazuo Ueda, expressed concerns about the possibility of further interest rate hikes.

In contrast, board member Hajime Takata, who holds a more hawkish stance, has called for additional policy tightening. He also indicated that the bank’s price stability target is nearly achieved.

Governor Ueda himself noted that the BoJ will carefully assess incoming economic data at its March and April meetings, leaving the door open to a potential short-term rate hike.

Economic statistics are also influencing market expectations. Inflation in Tokyo has slowed to its lowest level in over a year, partly due to government subsidies for utilities. This has reinforced expectations that the central bank may refrain from tightening policy in the near term.

Technical Analysis

On the H4 chart, USD/JPY is forming a consolidation range around the 156.15 level. A decline towards 155.50 is expected today, after which a corrective move back towards 156.15 may follow. A breakout above this range could open the way to further gains towards 157.50. Conversely, a break below the range would signal a continuation of the downward move, initially towards 154.18, with scope to extend towards 151.82. Technically, this bearish scenario is supported by the MACD indicator, whose signal line remains above zero but is pointing firmly lower.

On the H1 chart, the pair has broken below the 156.15 level and is forming a downward wave towards 155.40. A subsequent correction back to 156.15 cannot be ruled out. This short-term bearish bias is confirmed by the Stochastic oscillator, with its signal line below 50 and pointing lower.

Conclusion

USD/JPY is declining amid persistent uncertainty regarding the Bank of Japan’s next policy move. Market expectations are being pulled between hawkish signals from some board members and more cautious communication from the leadership, reinforced by softer Tokyo inflation data. Technical analysis suggests scope for further short-term downside, although a corrective bounce remains possible.


Disclaimer

Any forecasts contained herein are based on the author’s particular opinion. This analysis may not be treated as trading advice. RoboForex bears no responsibility for trading results based on trading recommendations and reviews contained herein.

British FTSE 100 hits new record. AUD emerges as G10 currency favorite

By JustMarkets 

The US stock market demonstrated steady growth on Wednesday. By the close of trading, the Dow Jones (US30) rose by 0.76%, the S&P 500 (US500) gained 0.77%, and the technology-heavy Nasdaq (US100) finished 1.09% higher. The highlight of the day was the Nvidia earnings report, which exceeded expectations for both profit and revenue. This served as a vital signal for investors: the “AI bubble,” much discussed in recent weeks, has not burst, and real demand for chips remains consistently high.

Equity markets in Europe surged on Wednesday. The German DAX (DE40) rose by 0.76%, the French CAC 40 (FR40) closed up 0.47%, and the Spanish IBEX 35 (ES35) climbed 1.49%. The British FTSE 100 (UK100) gained 1.18%, reaching a new all-time high. The primary driver of the rally was the banking sector, led by HSBC, whose shares skyrocketed 7.6% following a strong financial report. The commodities sector also significantly contributed to the index’s growth amid rising prices for copper and metals.

Banking analysts predict stability for the Swiss franc (CHF) in the short term, viewing it as the ultimate safe-haven asset amid trade wars and geopolitical chaos. Switzerland’s strong fiscal indicators and current account surplus make the franc resilient to market shocks. However, this strength poses serious challenges for the domestic economy. Inflation in Switzerland sits at a critically low level (0.1%), effectively signaling a risk of deflation. Consequently, the SNB may either move to cut rates into negative territory or, more likely, conduct currency interventions by selling the franc to curb its exchange rate.

On Wednesday, silver prices (XAG) jumped more than 3%, closely approaching the psychological mark of $90 per ounce. The growth was driven by a confluence of factors: the implementation of the US 10% tariff, threats to raise it to 15%, and preparations for the decisive round of nuclear negotiations in Geneva. Investors returned to silver as a hedge against trade war risks and potential escalation in the Middle East.

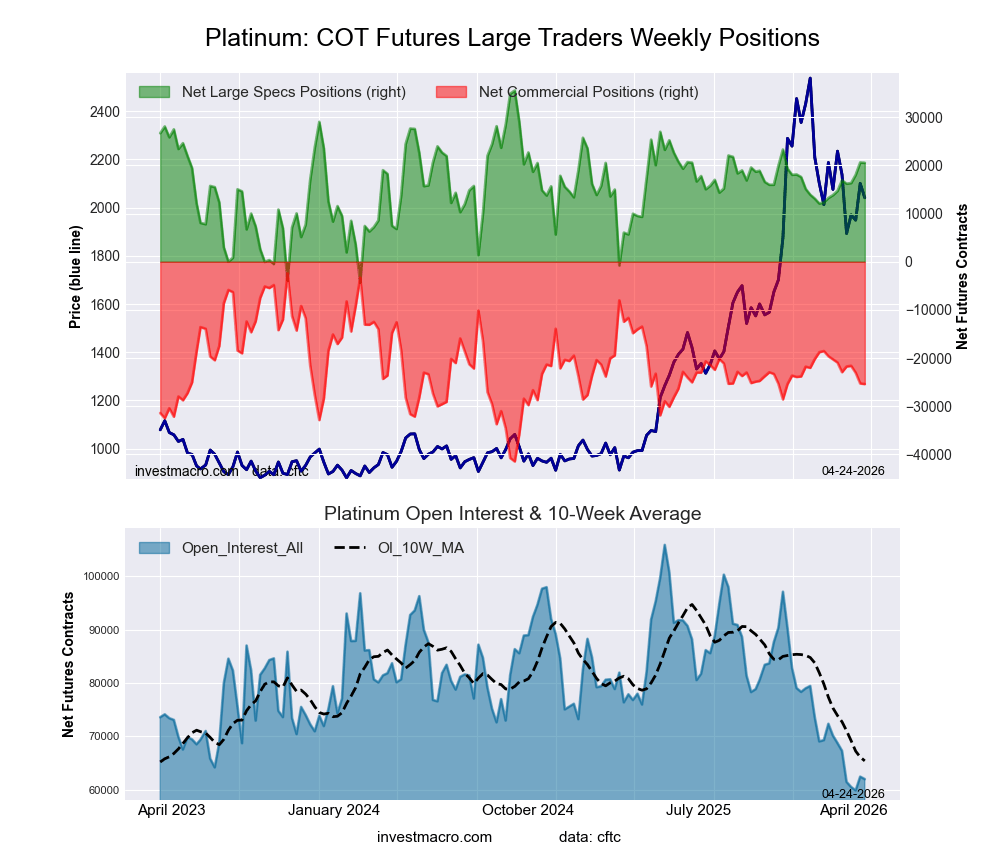
Platinum prices (XPT) are trading above $2,300 per ounce on Thursday, hitting a four-week high. The precious metals market remains on edge due to large-scale US sanctions against 30 Iranian entities and the largest US military buildup in the Persian Gulf since 2003. Investors are utilizing platinum as a defensive asset ahead of the crucial Geneva talks, fearing that a diplomatic failure could lead to direct military conflict. Fundamentally, platinum is supported by the “substitution effect” for palladium and a chronic supply deficit from South Africa.

WTI oil prices accelerated their decline on Wednesday, dropping to $65.35 per barrel. The primary bearish factor was the EIA report, which recorded a shocking increase in crude oil inventories of 15.99 million barrels for the week. This is the largest build in three years, exceeding analyst expectations tenfold and neutralizing concerns regarding a supply deficit.

Asian markets traded with mixed results yesterday. The Japanese Nikkei 225 (JP225) surged by 2.20%, the Chinese FTSE China A50 (CHA50) rose by 0.65%, and the Hong Kong Hang Seng (HK50) gained 0.66%. The Australian ASX 200 (AU200) posted a positive result of 1.17%.

On Thursday, the Australian dollar (AUD) made a powerful move to 0.713 USD, reaching its highest levels since August 2022. Markets are nearly certain of an RBA rate hike to 4.10% (with an 80% probability for a May move) after January inflation figures unpleasantly surprised the regulator. The “aussie” currently looks like the favorite among G10 currencies as Australian government bond yields are rising faster than their US counterparts.

The New Zealand dollar (NZD) climbed above the 0.60 USD mark on Thursday, marking its third consecutive session of gains. The primary driver of the “kiwi’s” strength was a localized weakening of the US dollar: investors began to doubt the sustainability of Trump’s trade strategy after the Supreme Court blocked some of his initiatives, prompting temporary profit-taking on long USD positions. Nevertheless, the upside potential for the NZD is limited by the RBNZ’s dovish stance. Governor Anna Breman has signaled that the economy can recover without overheating, depriving the RBNZ of incentives to hike rates in the near future.

S&P 500 (US500) 6,946.14 +56.07 (+0.81%)

Dow Jones (US30) 49,482.27 +307.77 (+0.63%)

DAX (DE40) 25,175.94 +189.69 (+0.76%)

FTSE 100 (UK100) 10,806.41 +125.82 (+1.18%)

USD Index 97.69 -0.15% (-0.16%)

News feed for: 2026.02.26

  • Eurozone ECB President Lagarde Speaks at 10:30 (GMT+2); – EUR (LOW)
  • US Initial Jobless Claims (w/w) at 15:30 (GMT+2); – USD (MED)
  • US Natural Gas Storage (w/w) at 17:30 (GMT+2). – XNG (HIGH)

By JustMarkets


This article reflects a personal opinion and should not be interpreted as an investment advice, and/or offer, and/or a persistent request for carrying out financial transactions, and/or a guarantee, and/or a forecast of future events.

EUR/USD in Positive Territory: Dollar Weakness Presents Opportunities for Investors

By RoboForex Analytical Department

EUR/USD rose for the second consecutive day and is approaching 1.1819. Sentiment towards the US dollar remains under pressure amid uncertainty over US tariff policy, which is eroding confidence in the American currency.

US Trade Representative Jamieson Greer stated that tariff rates for individual countries could be increased from the current 10% to 15% or higher, but did not specify the criteria for such changes.

President Donald Trump adopted a measured tone on tariffs in his annual address to Congress. At the same time, he made it clear that he would not change his strategy, despite the Supreme Court’s decision to cancel his large-scale “reciprocal” duties.

In terms of monetary policy, the market expects the Fed to keep interest rates unchanged at its next meeting.

Additional caution stems from ongoing negotiations between the US and Iran on the nuclear program, the next round of which is taking place today in Geneva.

Technical Analysis

On the H4 chart, EUR/USD is forming a consolidation range around 1.1818. An upward move towards 1.1862 appears likely, with scope for an extension towards 1.1888. Technically, this scenario is supported by the MACD indicator: its signal line remains above zero and is pointing higher, reflecting sustained bullish momentum.

On the H1 chart, the pair is developing the next upward wave towards 1.1860. After reaching this level, a pullback towards 1.1818 could follow, before a renewed advance towards 1.1888. Technically, this scenario is supported by the Stochastic oscillator, with its signal line above 50 and rising towards 80.

Conclusion

In summary, EUR/USD continues its gradual recovery as persistent uncertainty surrounding US tariff policy weighs on dollar sentiment. While Trump’s Congressional address offered no clarity on the trade front, and ongoing US-Iran negotiations add a layer of geopolitical caution, the technical picture remains constructive. The pair is building momentum within a consolidation range, with upside targets at 1.1862 and 1.1888. Both MACD and Stochastic indicators support the bullish bias, suggesting further gains are likely in the near term. The key level to watch is 1.1818 – holding above this support keeps the upward trajectory intact, while a break below could signal a temporary pause. For now, the path of least resistance appears higher.


Disclaimer

Any forecasts contained herein are based on the author’s particular opinion. This analysis may not be treated as trading advice. RoboForex bears no responsibility for trading results based on trading recommendations and reviews contained herein.