
By InvestMacro
Here are the latest charts and statistics for the Commitment of Traders (COT) reports data published by the Commodities Futures Trading Commission (CFTC).
The latest COT data is updated through Tuesday April 21st and shows a quick view of how large traders (for-profit speculators and commercial hedgers) were positioned in the futures markets.
Weekly Speculator Changes led by 5-Year Bonds & 10-Year Bonds
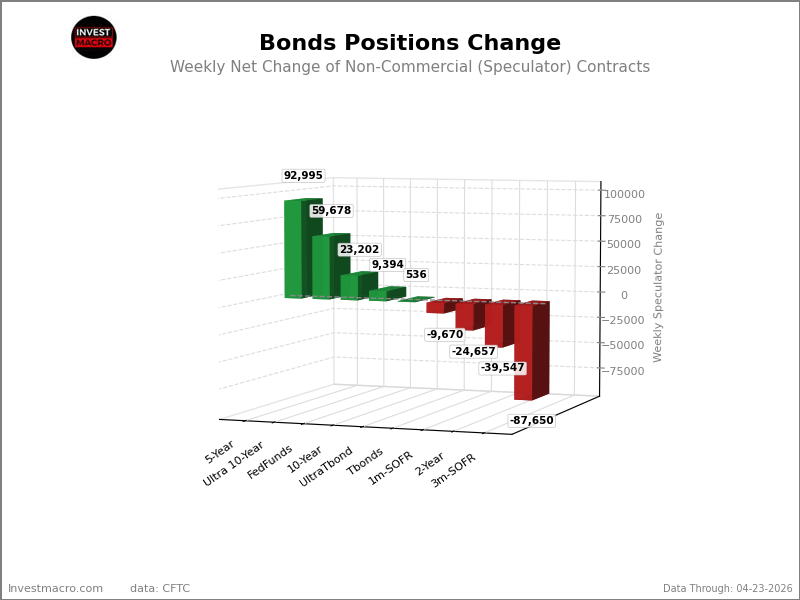
The COT bond market speculator bets were slightly higher overall this week as five out of the nine bond markets we cover had higher positioning while the other four markets had lower speculator contracts.
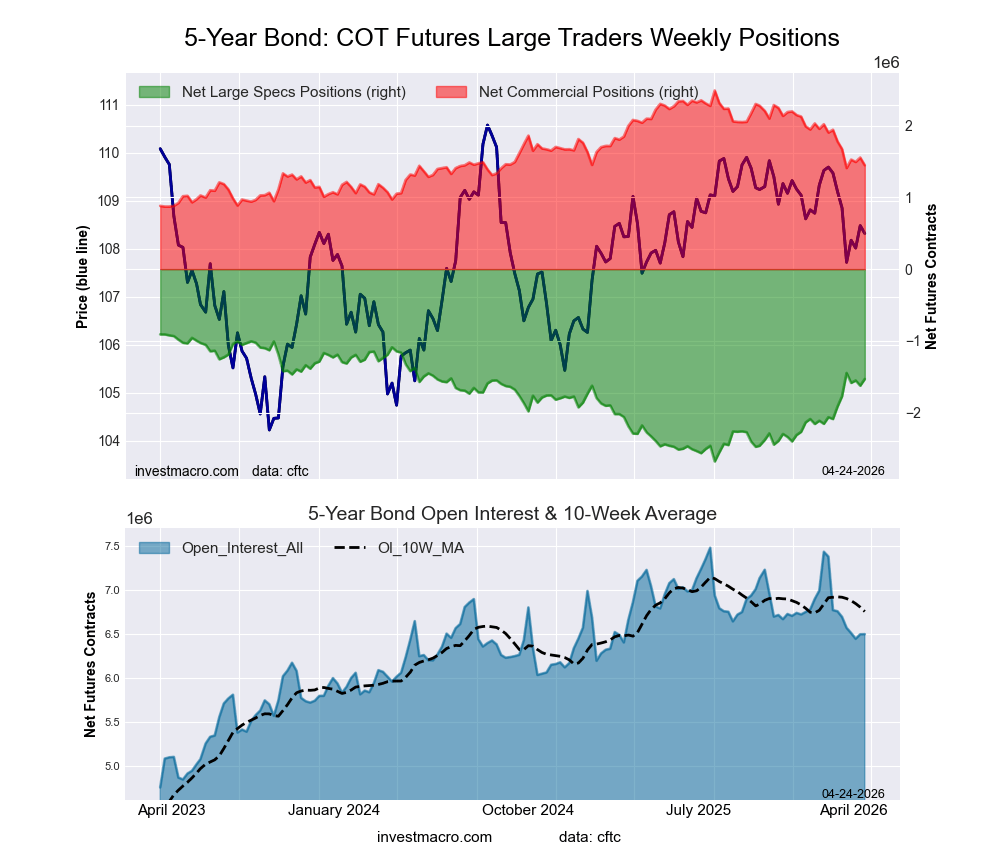
Leading the gains for the bond markets was the 5-Year Bonds (92,995 contracts) with the Ultra 10-Year Bonds (59,678 contracts), the Fed Funds (23,202 contracts), the 10-Year Bonds (9,394 contracts) and the Ultra Treasury Bonds (536 contracts) also showing positive weeks.
Free Reports:
 Download Our Metatrader 4 Indicators – Put Our Free MetaTrader 4 Custom Indicators on your charts when you join our Weekly Newsletter
 Get our Weekly Commitment of Traders Reports - See where the biggest traders (Hedge Funds and Commercial Hedgers) are positioned in the futures markets on a weekly basis.
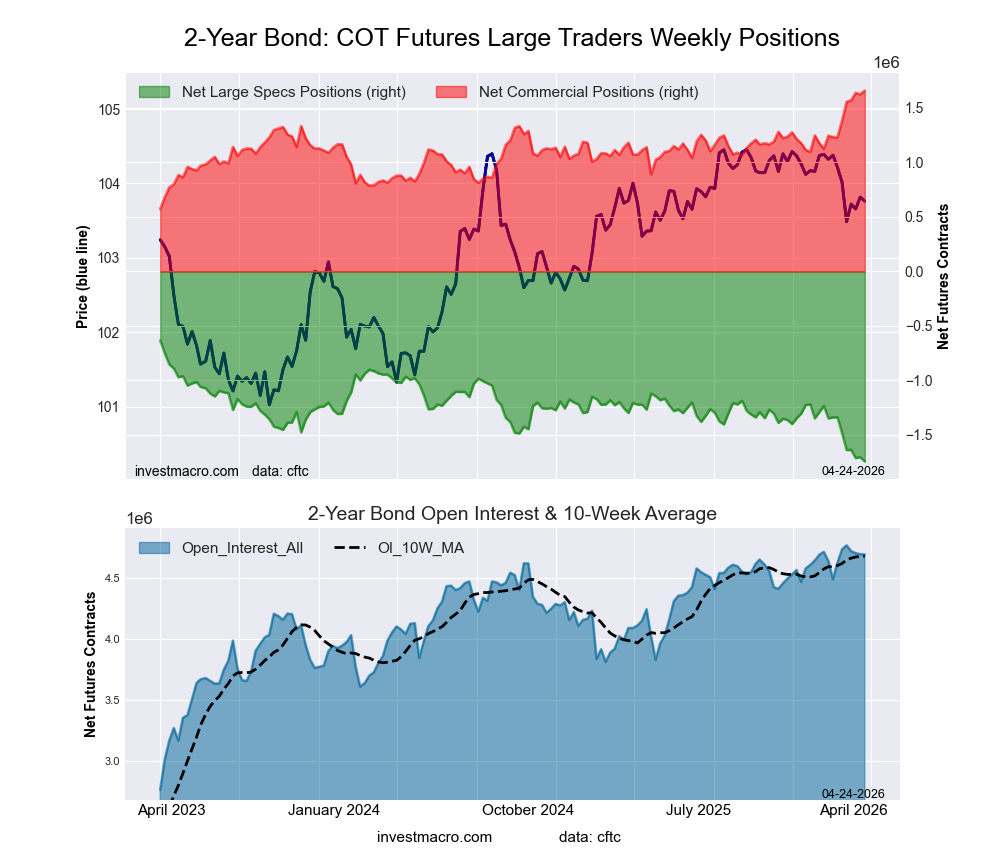
The bond markets with declines in speculator bets for the week were the SOFR 3-Months (-87,650 contracts), the 2-Year Bonds (-39,547 contracts), the SOFR 1-Month (-24,657 contracts) and with the US Treasury Bonds (-9,670 contracts) also having lower bets on the week.
Major Bond Markets were mostly lower in price performance this week.
In the Major Bond Markets, the Fed Funds with a small edge higher by 0.01% was the only market that saw a positive return on the week.
The three-month SOFR and the one-month SOFR were virtually unchanged on the week – each with a -0.01% change, followed by the 2-year bond, which was lower by -0.08%. The 5-year bond declined by -0.22%, while the 10-year note saw a reduction by -0.28%, and the long US Treasury Bond was down by -0.30%.
Bonds Data:
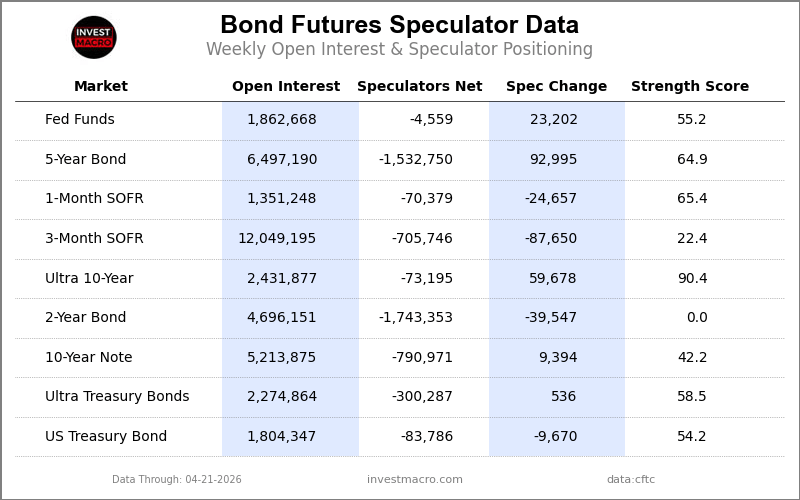
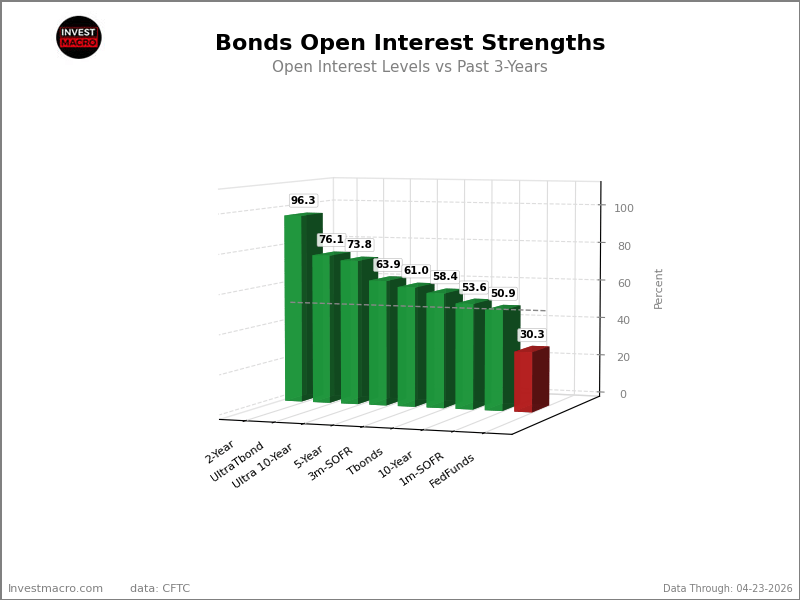
Legend: Open Interest | Speculators Current Net Position | Weekly Specs Change | Specs Strength Score compared to last 3-Years (0-100 range)
Strength Scores led by Ultra 10-Year Bonds & 5-Year Bonds
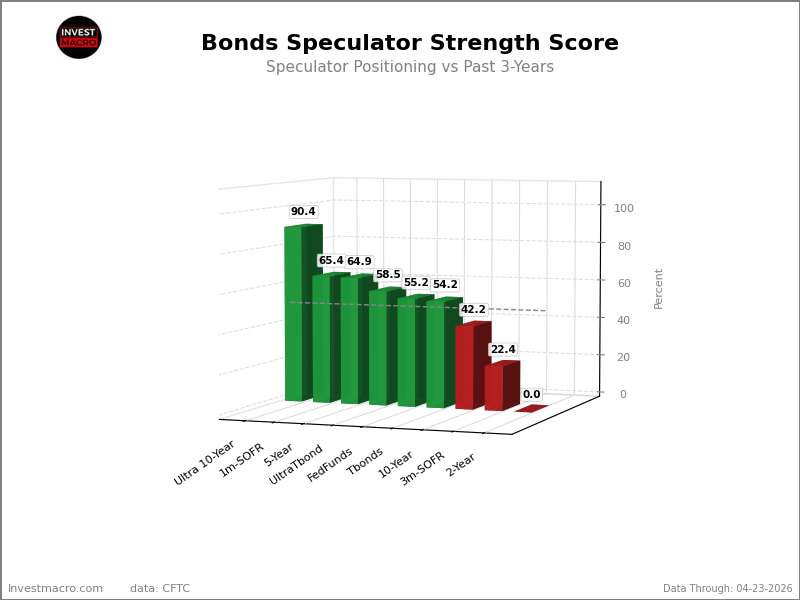
COT Strength Scores (a normalized measure of Speculator positions over a 3-Year range, from 0 to 100 where above 80 is Extreme-Bullish and below 20 is Extreme-Bearish) showed that the Ultra 10-Year Bonds (90 percent), the 5-Year Bonds (65 percent) and the SOFR 1-Month (65 percent) lead the bond markets this week.
On the downside, the 2-Year Bond (0.0 percent) comes in at the lowest strength level currently and is in Bearish-Extreme territory. The next lowest strength scores were the SOFR 3-Months (22 percent) and the 10-Year Bonds (42 percent).
Strength Statistics:
Fed Funds (55.2 percent) vs Fed Funds previous week (51.9 percent)
2-Year Bond (0.0 percent) vs 2-Year Bond previous week (3.6 percent)
5-Year Bond (64.9 percent) vs 5-Year Bond previous week (59.6 percent)
10-Year Bond (42.2 percent) vs 10-Year Bond previous week (41.1 percent)
Ultra 10-Year Bond (90.4 percent) vs Ultra 10-Year Bond previous week (74.3 percent)
US Treasury Bond (54.2 percent) vs US Treasury Bond previous week (57.6 percent)
Ultra US Treasury Bond (58.5 percent) vs Ultra US Treasury Bond previous week (58.3 percent)
SOFR 1-Month (65.4 percent) vs SOFR 1-Month previous week (69.7 percent)
SOFR 3-Months (22.4 percent) vs SOFR 3-Months previous week (27.0 percent)
Ultra 10-Year Bonds & 5-Year Bonds top the 6-Week Strength Trends
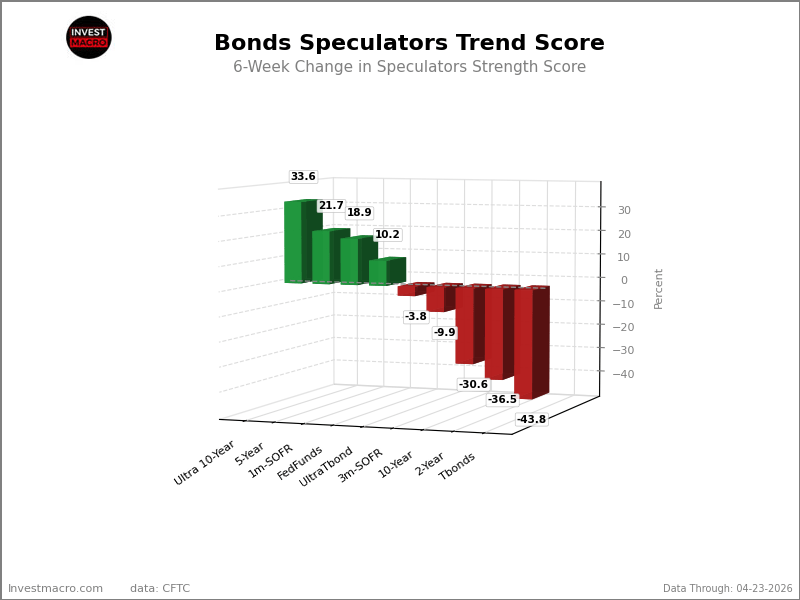
COT Strength Score Trends (or move index, calculates the 6-week changes in strength scores) showed that the Ultra 10-Year Bonds (34 percent) and the 5-Year Bonds (22 percent) lead the past six weeks trends for bonds. The SOFR 1-Month (19 percent) are the next highest positive movers in the latest trends data.
The US Treasury Bond (-43.8 percent) leads the downside trend scores currently with the 10-Year Bonds (-31 percent) and the 2-Year Bonds (-37 percent) following next with lower trend scores.
Strength Trend Statistics:
Fed Funds (10.2 percent) vs Fed Funds previous week (18.8 percent)
2-Year Bond (-36.5 percent) vs 2-Year Bond previous week (-32.9 percent)
5-Year Bond (21.7 percent) vs 5-Year Bond previous week (26.2 percent)
10-Year Bond (-30.6 percent) vs 10-Year Bond previous week (-17.4 percent)
Ultra 10-Year Bond (33.6 percent) vs Ultra 10-Year Bond previous week (3.3 percent)
US Treasury Bond (-43.8 percent) vs US Treasury Bond previous week (-32.8 percent)
Ultra US Treasury Bond (-3.8 percent) vs Ultra US Treasury Bond previous week (-16.9 percent)
SOFR 1-Month (18.9 percent) vs SOFR 1-Month previous week (22.9 percent)
SOFR 3-Months (-9.9 percent) vs SOFR 3-Months previous week (8.4 percent)
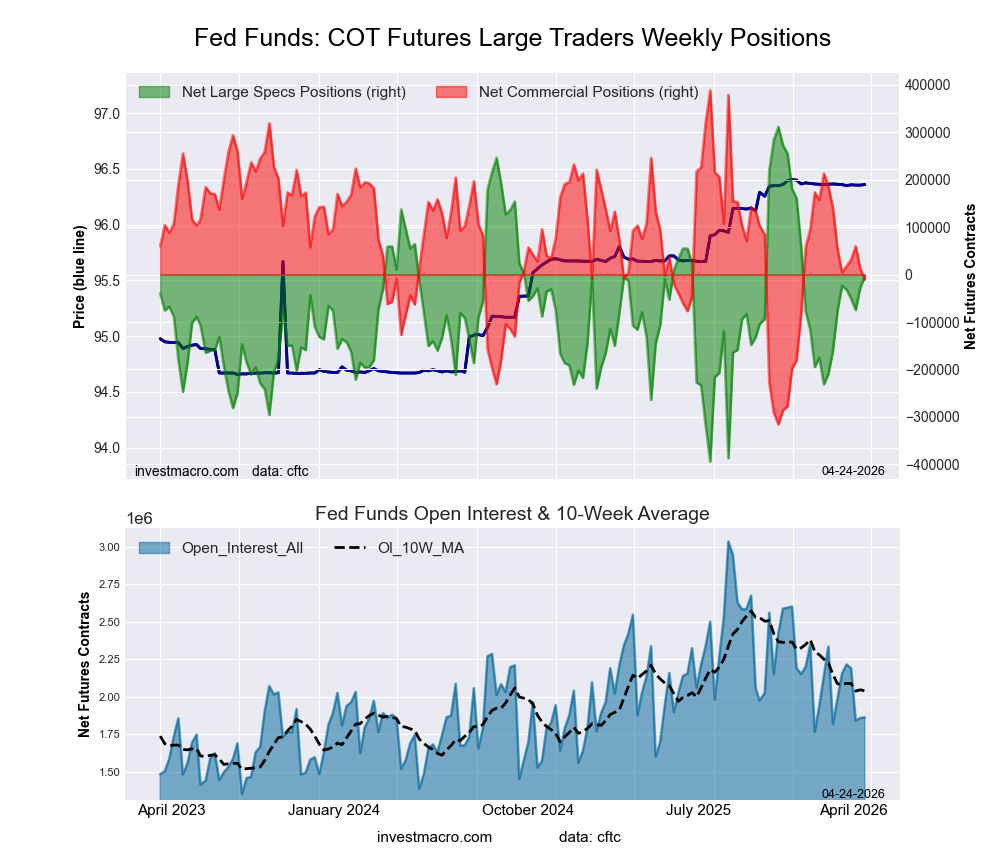
30-Day Federal Funds Futures:
 Positioning Notes:
- 30-Day Federal Funds large speculator standing this week equaled a net position of -4,559 contracts in the data reported through Tuesday.
- Weekly Speculator position rise of 23,202 contracts from the previous week which had a total of -27,761 net contracts.
- This week’s current strength score (range over the past 3 years, measured from 0 to 100) shows the speculators are currently Bullish with a score of 55.2 percent.
- The Commercials are Bearish with a score of 43.4 percent.
- The Small Traders (not shown in chart) are Bullish with a score of 76.0 percent.
Price Trend-Following Model: Weak Uptrend
Our weekly trend-following model classifies the current market price position as: Weak Uptrend.
| 30-Day Federal Funds Statistics | SPECULATORS | COMMERCIALS | SMALL TRADERS |
| – Percent of Open Interest Longs: | 19.0 | 63.0 | 2.7 |
| – Percent of Open Interest Shorts: | 19.2 | 63.6 | 1.9 |
| – Net Position: | -4,559 | -10,325 | 14,884 |
| – Gross Longs: | 353,274 | 1,174,148 | 49,750 |
| – Gross Shorts: | 357,833 | 1,184,473 | 34,866 |
| – Long to Short Ratio: | 1.0 to 1 | 1.0 to 1 | 1.4 to 1 |
| NET POSITION TREND: | |||
| – Strength Index Score (3 Year Range Pct): | 55.2 | 43.4 | 76.0 |
| – Strength Index Reading (3 Year Range): | Bullish | Bearish | Bullish |
| NET POSITION MOVEMENT INDEX: | |||
| – 6-Week Change in Strength Index: | 10.2 | -9.1 | -14.5 |
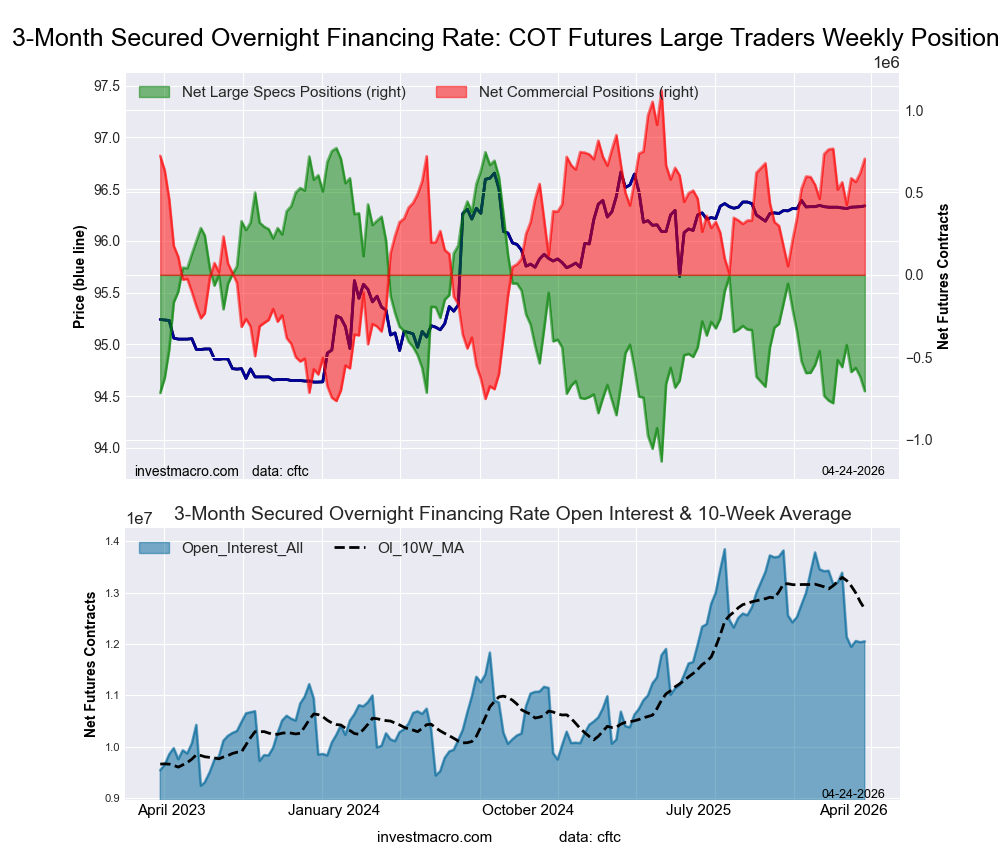
Secured Overnight Financing Rate (3-Month) Futures:
 Positioning Notes:
- Secured Overnight Financing Rate (3-Month) large speculator standing this week equaled a net position of -705,746 contracts in the data reported through Tuesday.
- Weekly Speculator position lowering of -87,650 contracts from the previous week which had a total of -618,096 net contracts.
- This week’s current strength score (range over the past 3 years, measured from 0 to 100) shows the speculators are currently Bearish with a score of 22.4 percent.
- The Commercials are Bullish with a score of 78.0 percent.
- The Small Traders (not shown in chart) are Bearish with a score of 41.9 percent.
Price Trend-Following Model: Weak Uptrend
Our weekly trend-following model classifies the current market price position as: Weak Uptrend.
| SOFR 3-Months Statistics | SPECULATORS | COMMERCIALS | SMALL TRADERS |
| – Percent of Open Interest Longs: | 15.3 | 59.0 | 1.2 |
| – Percent of Open Interest Shorts: | 21.1 | 53.2 | 1.1 |
| – Net Position: | -705,746 | 704,566 | 1,180 |
| – Gross Longs: | 1,839,720 | 7,114,389 | 139,054 |
| – Gross Shorts: | 2,545,466 | 6,409,823 | 137,874 |
| – Long to Short Ratio: | 0.7 to 1 | 1.1 to 1 | 1.0 to 1 |
| NET POSITION TREND: | |||
| – Strength Index Score (3 Year Range Pct): | 22.4 | 78.0 | 41.9 |
| – Strength Index Reading (3 Year Range): | Bearish | Bullish | Bearish |
| NET POSITION MOVEMENT INDEX: | |||
| – 6-Week Change in Strength Index: | -9.9 | 9.9 | 3.3 |
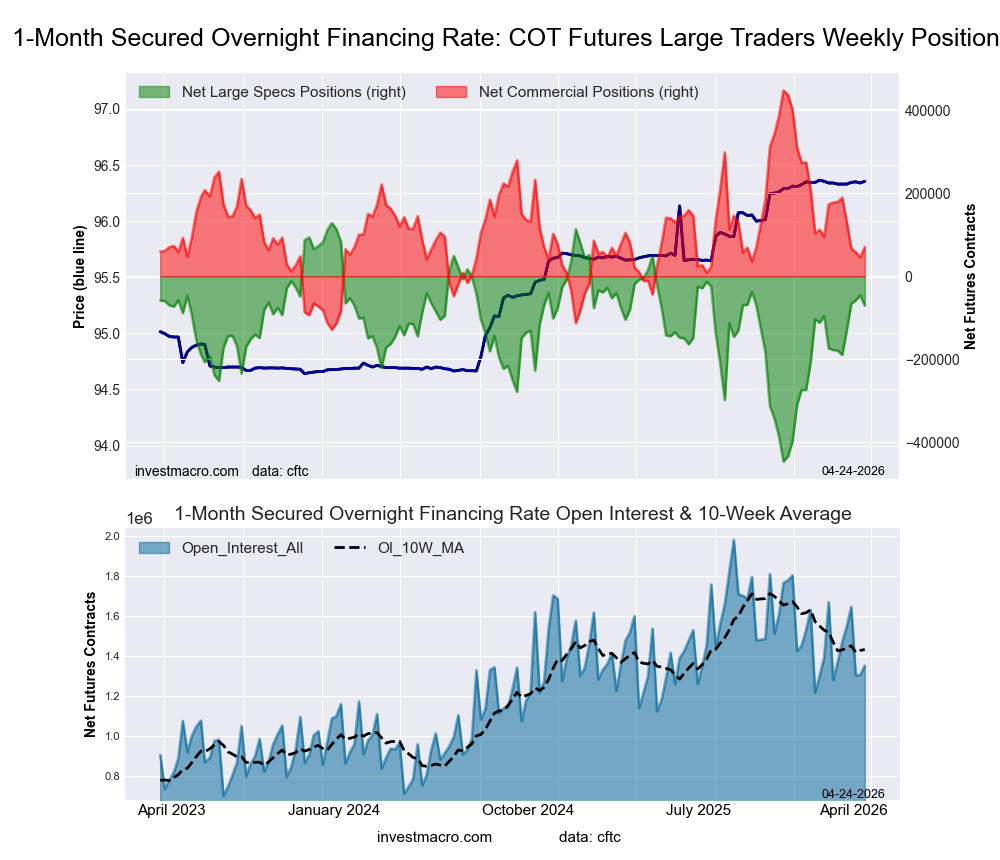
Secured Overnight Financing Rate (1-Month) Futures:
 Positioning Notes:
- Secured Overnight Financing Rate (1-Month) large speculator standing this week equaled a net position of -70,379 contracts in the data reported through Tuesday.
- Weekly Speculator position lowering of -24,657 contracts from the previous week which had a total of -45,722 net contracts.
- This week’s current strength score (range over the past 3 years, measured from 0 to 100) shows the speculators are currently Bullish with a score of 65.4 percent.
- The Commercials are Bearish with a score of 34.6 percent.
- The Small Traders (not shown in chart) are Bullish with a score of 66.9 percent.
Price Trend-Following Model: Uptrend
Our weekly trend-following model classifies the current market price position as: Uptrend.
| SOFR 1-Month Statistics | SPECULATORS | COMMERCIALS | SMALL TRADERS |
| – Percent of Open Interest Longs: | 22.9 | 58.8 | 2.8 |
| – Percent of Open Interest Shorts: | 28.1 | 53.6 | 2.8 |
| – Net Position: | -70,379 | 70,342 | 37 |
| – Gross Longs: | 308,764 | 794,605 | 37,285 |
| – Gross Shorts: | 379,143 | 724,263 | 37,248 |
| – Long to Short Ratio: | 0.8 to 1 | 1.1 to 1 | 1.0 to 1 |
| NET POSITION TREND: | |||
| – Strength Index Score (3 Year Range Pct): | 65.4 | 34.6 | 66.9 |
| – Strength Index Reading (3 Year Range): | Bullish | Bearish | Bullish |
| NET POSITION MOVEMENT INDEX: | |||
| – 6-Week Change in Strength Index: | 18.9 | -18.9 | 0.1 |
2-Year Treasury Note Futures:
 Positioning Notes:
- 2-Year Treasury Note large speculator standing this week equaled a net position of -1,743,353 contracts in the data reported through Tuesday.
- Weekly Speculator position decline of -39,547 contracts from the previous week which had a total of -1,703,806 net contracts.
- This week’s current strength score (range over the past 3 years, measured from 0 to 100) shows the speculators are currently Bearish-Extreme with a score of 0.0 percent.
- The Commercials are Bullish-Extreme with a score of 100.0 percent.
- The Small Traders (not shown in chart) are Bearish-Extreme with a score of 13.6 percent.
Price Trend-Following Model: Downtrend
Our weekly trend-following model classifies the current market price position as: Downtrend.
| 2-Year Treasury Note Statistics | SPECULATORS | COMMERCIALS | SMALL TRADERS |
| – Percent of Open Interest Longs: | 10.5 | 81.2 | 5.2 |
| – Percent of Open Interest Shorts: | 47.6 | 45.8 | 3.4 |
| – Net Position: | -1,743,353 | 1,660,126 | 83,227 |
| – Gross Longs: | 493,350 | 3,811,446 | 242,922 |
| – Gross Shorts: | 2,236,703 | 2,151,320 | 159,695 |
| – Long to Short Ratio: | 0.2 to 1 | 1.8 to 1 | 1.5 to 1 |
| NET POSITION TREND: | |||
| – Strength Index Score (3 Year Range Pct): | 0.0 | 100.0 | 13.6 |
| – Strength Index Reading (3 Year Range): | Bearish-Extreme | Bullish-Extreme | Bearish-Extreme |
| NET POSITION MOVEMENT INDEX: | |||
| – 6-Week Change in Strength Index: | -36.5 | 39.5 | -14.1 |
5-Year Treasury Note Futures:
 Positioning Notes:
- 5-Year Treasury Note large speculator standing this week equaled a net position of -1,532,750 contracts in the data reported through Tuesday.
- Weekly Speculator position advance of 92,995 contracts from the previous week which had a total of -1,625,745 net contracts.
- This week’s current strength score (range over the past 3 years, measured from 0 to 100) shows the speculators are currently Bullish with a score of 64.9 percent.
- The Commercials are Bearish with a score of 35.6 percent.
- The Small Traders (not shown in chart) are Bearish with a score of 32.7 percent.
Price Trend-Following Model: Downtrend
Our weekly trend-following model classifies the current market price position as: Downtrend.
| 5-Year Treasury Note Statistics | SPECULATORS | COMMERCIALS | SMALL TRADERS |
| – Percent of Open Interest Longs: | 10.7 | 79.9 | 6.2 |
| – Percent of Open Interest Shorts: | 34.2 | 57.6 | 4.9 |
| – Net Position: | -1,532,750 | 1,448,728 | 84,022 |
| – Gross Longs: | 692,330 | 5,191,123 | 405,515 |
| – Gross Shorts: | 2,225,080 | 3,742,395 | 321,493 |
| – Long to Short Ratio: | 0.3 to 1 | 1.4 to 1 | 1.3 to 1 |
| NET POSITION TREND: | |||
| – Strength Index Score (3 Year Range Pct): | 64.9 | 35.6 | 32.7 |
| – Strength Index Reading (3 Year Range): | Bullish | Bearish | Bearish |
| NET POSITION MOVEMENT INDEX: | |||
| – 6-Week Change in Strength Index: | 21.7 | -20.6 | -20.9 |
10-Year Treasury Note Futures:
 Positioning Notes:
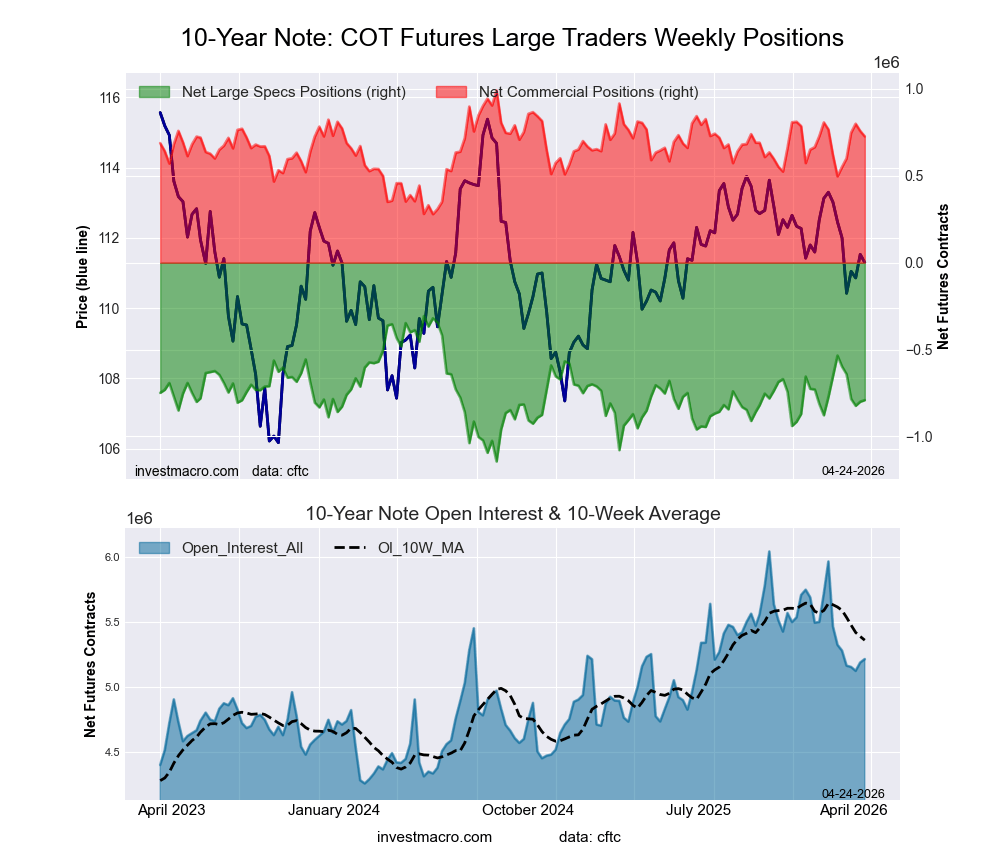
- 10-Year Treasury Note large speculator standing this week equaled a net position of -790,971 contracts in the data reported through Tuesday.
- Weekly Speculator position lift of 9,394 contracts from the previous week which had a total of -800,365 net contracts.
- This week’s current strength score (range over the past 3 years, measured from 0 to 100) shows the speculators are currently Bearish with a score of 42.2 percent.
- The Commercials are Bullish with a score of 62.9 percent.
- The Small Traders (not shown in chart) are Bearish with a score of 43.4 percent.
Price Trend-Following Model: Downtrend
Our weekly trend-following model classifies the current market price position as: Downtrend.
| 10-Year Treasury Note Statistics | SPECULATORS | COMMERCIALS | SMALL TRADERS |
| – Percent of Open Interest Longs: | 11.3 | 77.9 | 8.0 |
| – Percent of Open Interest Shorts: | 26.5 | 63.9 | 6.8 |
| – Net Position: | -790,971 | 726,889 | 64,082 |
| – Gross Longs: | 591,103 | 4,060,023 | 416,177 |
| – Gross Shorts: | 1,382,074 | 3,333,134 | 352,095 |
| – Long to Short Ratio: | 0.4 to 1 | 1.2 to 1 | 1.2 to 1 |
| NET POSITION TREND: | |||
| – Strength Index Score (3 Year Range Pct): | 42.2 | 62.9 | 43.4 |
| – Strength Index Reading (3 Year Range): | Bearish | Bullish | Bearish |
| NET POSITION MOVEMENT INDEX: | |||
| – 6-Week Change in Strength Index: | -30.6 | 32.3 | 13.0 |
Ultra 10-Year Notes Futures:
 Positioning Notes:
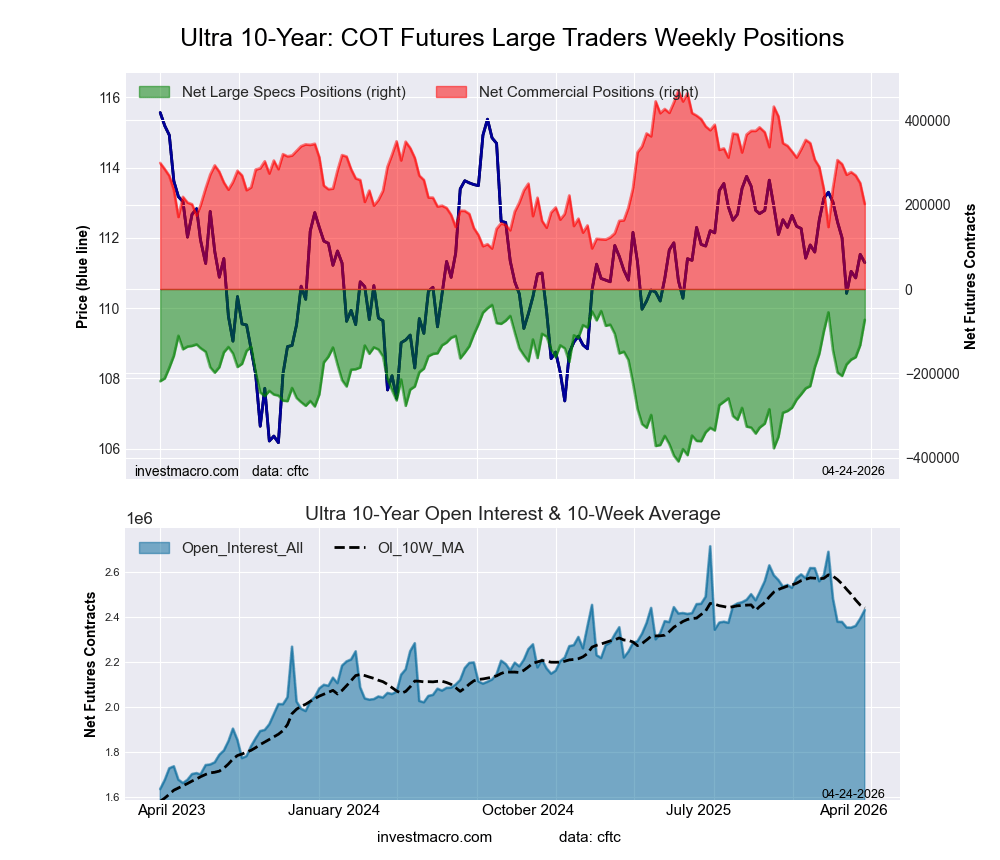
- Ultra 10-Year Notes large speculator standing this week equaled a net position of -73,195 contracts in the data reported through Tuesday.
- Weekly Speculator position increase of 59,678 contracts from the previous week which had a total of -132,873 net contracts.
- This week’s current strength score (range over the past 3 years, measured from 0 to 100) shows the speculators are currently Bullish-Extreme with a score of 90.4 percent.
- The Commercials are Bearish with a score of 28.2 percent.
- The Small Traders (not shown in chart) are Bearish-Extreme with a score of 6.6 percent.
Price Trend-Following Model: Weak Uptrend
Our weekly trend-following model classifies the current market price position as: Weak Uptrend. The current action for the model is considered to be: Hold – Maintain Long Position.
| Ultra 10-Year Notes Statistics | SPECULATORS | COMMERCIALS | SMALL TRADERS |
| – Percent of Open Interest Longs: | 10.2 | 80.6 | 8.2 |
| – Percent of Open Interest Shorts: | 13.2 | 72.3 | 13.5 |
| – Net Position: | -73,195 | 201,369 | -128,174 |
| – Gross Longs: | 247,885 | 1,960,151 | 200,473 |
| – Gross Shorts: | 321,080 | 1,758,782 | 328,647 |
| – Long to Short Ratio: | 0.8 to 1 | 1.1 to 1 | 0.6 to 1 |
| NET POSITION TREND: | |||
| – Strength Index Score (3 Year Range Pct): | 90.4 | 28.2 | 6.6 |
| – Strength Index Reading (3 Year Range): | Bullish-Extreme | Bearish | Bearish-Extreme |
| NET POSITION MOVEMENT INDEX: | |||
| – 6-Week Change in Strength Index: | 33.6 | -27.7 | -16.1 |
US Treasury Bonds Futures:
 Positioning Notes:
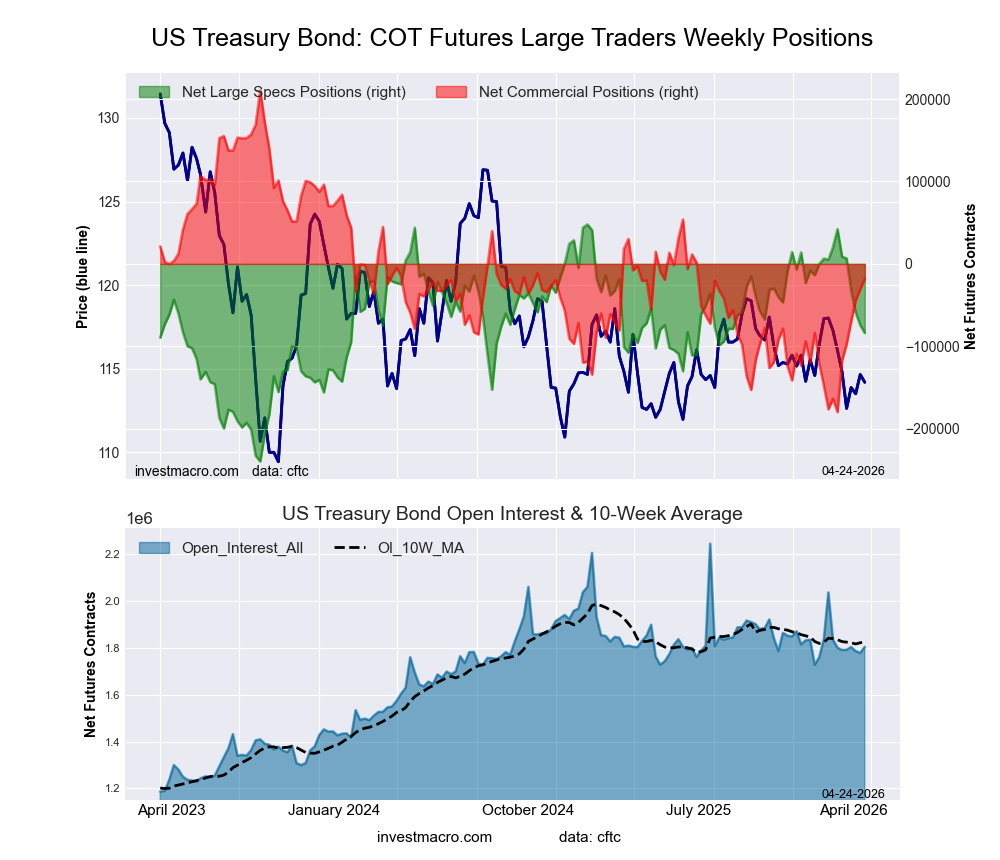
- US Treasury Bonds large speculator standing this week equaled a net position of -83,786 contracts in the data reported through Tuesday.
- Weekly Speculator position decline of -9,670 contracts from the previous week which had a total of -74,116 net contracts.
- This week’s current strength score (range over the past 3 years, measured from 0 to 100) shows the speculators are currently Bullish with a score of 54.2 percent.
- The Commercials are Bearish with a score of 41.4 percent.
- The Small Traders (not shown in chart) are Bullish with a score of 51.7 percent.
Price Trend-Following Model: Strong Downtrend
Our weekly trend-following model classifies the current market price position as: Strong Downtrend.
| US Treasury Bonds Statistics | SPECULATORS | COMMERCIALS | SMALL TRADERS |
| – Percent of Open Interest Longs: | 10.3 | 75.1 | 13.1 |
| – Percent of Open Interest Shorts: | 14.9 | 76.1 | 7.5 |
| – Net Position: | -83,786 | -18,086 | 101,872 |
| – Gross Longs: | 185,732 | 1,354,174 | 236,593 |
| – Gross Shorts: | 269,518 | 1,372,260 | 134,721 |
| – Long to Short Ratio: | 0.7 to 1 | 1.0 to 1 | 1.8 to 1 |
| NET POSITION TREND: | |||
| – Strength Index Score (3 Year Range Pct): | 54.2 | 41.4 | 51.7 |
| – Strength Index Reading (3 Year Range): | Bullish | Bearish | Bullish |
| NET POSITION MOVEMENT INDEX: | |||
| – 6-Week Change in Strength Index: | -43.8 | 41.4 | -25.0 |
Ultra US Treasury Bonds Futures:
 Positioning Notes:
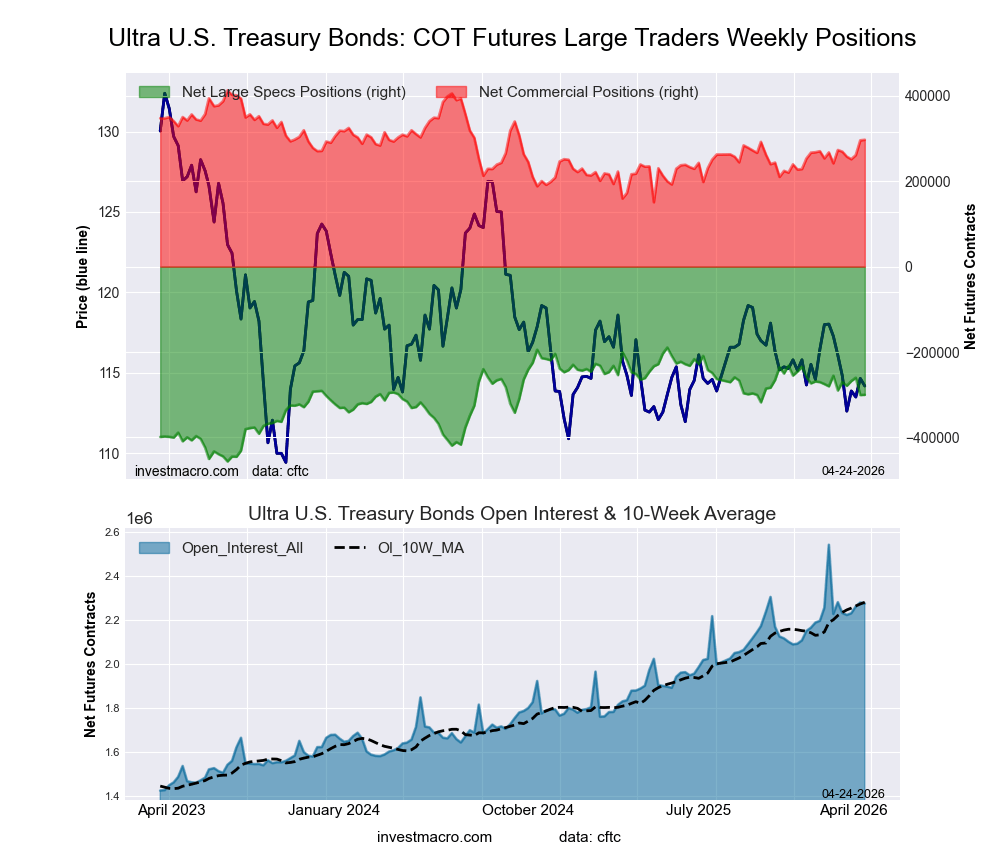
- Ultra US Treasury Bonds large speculator standing this week equaled a net position of -300,287 contracts in the data reported through Tuesday.
- Weekly Speculator position advance of 536 contracts from the previous week which had a total of -300,823 net contracts.
- This week’s current strength score (range over the past 3 years, measured from 0 to 100) shows the speculators are currently Bullish with a score of 58.5 percent.
- The Commercials are Bullish with a score of 55.9 percent.
- The Small Traders (not shown in chart) are Bearish-Extreme with a score of 18.2 percent.
Price Trend-Following Model: Strong Downtrend
Our weekly trend-following model classifies the current market price position as: Strong Downtrend.
| Ultra US Treasury Bonds Statistics | SPECULATORS | COMMERCIALS | SMALL TRADERS |
| – Percent of Open Interest Longs: | 5.8 | 85.7 | 8.0 |
| – Percent of Open Interest Shorts: | 19.0 | 72.7 | 7.8 |
| – Net Position: | -300,287 | 297,249 | 3,038 |
| – Gross Longs: | 132,191 | 1,950,217 | 181,384 |
| – Gross Shorts: | 432,478 | 1,652,968 | 178,346 |
| – Long to Short Ratio: | 0.3 to 1 | 1.2 to 1 | 1.0 to 1 |
| NET POSITION TREND: | |||
| – Strength Index Score (3 Year Range Pct): | 58.5 | 55.9 | 18.2 |
| – Strength Index Reading (3 Year Range): | Bullish | Bullish | Bearish-Extreme |
| NET POSITION MOVEMENT INDEX: | |||
| – 6-Week Change in Strength Index: | -3.8 | 9.2 | -14.3 |
Article By InvestMacro – Receive our weekly COT Newsletter
*COT Report: The COT data, released weekly to the public each Friday, is updated through the most recent Tuesday (data is 3 days old) and shows a quick view of how large speculators or non-commercials (for-profit traders) were positioned in the futures markets.
The CFTC categorizes trader positions according to commercial hedgers (traders who use futures contracts for hedging as part of the business), non-commercials (large traders who speculate to realize trading profits) and nonreportable traders (usually small traders/speculators) as well as their open interest (contracts open in the market at time of reporting). See CFTC criteria here.

- COT Metals Charts: Weekly Speculator Bets led by Copper & Steel Jul 18, 2026
- COT Bonds Charts: Weekly Speculator Bets led by 2-Year, SOFR 3M & 5-Year Bonds Jul 18, 2026
- COT Energy Charts: Weekly Speculator Bets led by Brent Oil & Heating Oil Jul 18, 2026
- COT Soft Commodities Charts: Weekly Speculator Bets led by Wheat, Corn & Soybean Meal Jul 18, 2026
- The Bank of Canada kept its interest rate unchanged. Platinum prices reached a three‑week high Jul 16, 2026
- Stock indices rose after the release of US inflation data. China’s GDP slowed sharply Jul 15, 2026
- GBP/USD Awaits Political News: What Will Happen Next Jul 15, 2026
- USD/JPY Holds at Highs: Pressure Lingers on Yen Jul 14, 2026
- Oil prices jumped 4% amid a new wave of escalation between the US and Iran Jul 13, 2026
- EUR/USD: US Inflation Will Determine Everything Jul 13, 2026