By InvestMacro

Here are the latest charts and statistics for the Commitment of Traders (COT) reports data published by the Commodities Futures Trading Commission (CFTC).
The latest COT data is updated through Tuesday March 12th and shows a quick view of how large traders (for-profit speculators and commercial hedgers) were positioned in the futures markets.
Weekly Speculator Changes led by SOFR 3-Months & 10-Year Bonds
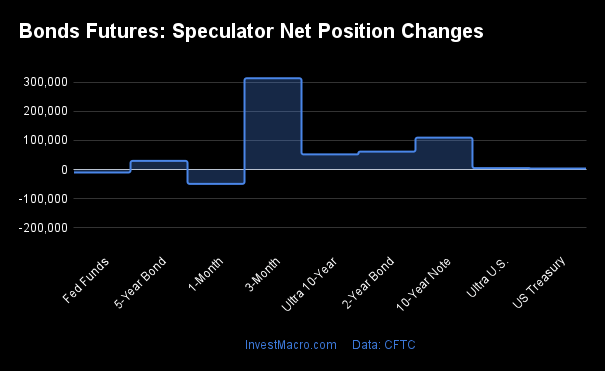
The COT bond market speculator bets were higher this week as seven out of the eight bond markets we cover had higher positioning while only one market had lower speculator contracts.
Leading the gains for the bond markets was the SOFR 3-Months (313,749 contracts) with the 10-Year Bonds (109,712 contracts), the 2-Year Bonds (61,465 contracts), the Ultra 10-Year Bonds (51,988 contracts), the 5-Year Bonds (29,753 contracts), the Ultra Treasury Bonds (4,866 contracts) and the US Treasury Bonds (3,503 contracts) also showing positive weeks.
The only bond market with a decline in speculator bets was the Fed Funds with a decrease of -10,180 contracts for the week.
Bonds Net Speculators Leaderboard
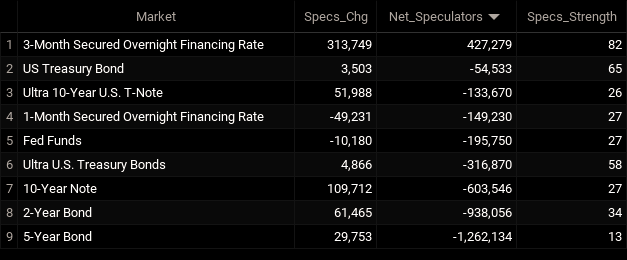
Legend: Weekly Speculators Change | Speculators Current Net Position | Speculators Strength Score compared to last 3-Years (0-100 range)
Strength Scores led by SOFR 3-Months & US Treasury Bonds
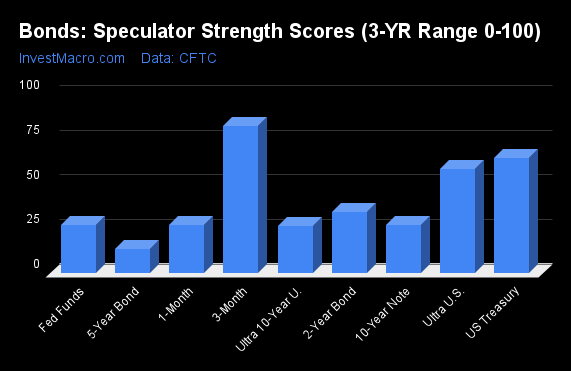
COT Strength Scores (a normalized measure of Speculator positions over a 3-Year range, from 0 to 100 where above 80 is Extreme-Bullish and below 20 is Extreme-Bearish) showed that the SOFR 3-Months (82 percent) and the US Treasury Bonds (64 percent) lead the bond markets this week. The Ultra Treasury Bonds (58 percent) comes in as the next highest in the weekly strength scores.
On the downside, the 5-Year Bonds (13 percent) comes in at the lowest strength level currently and is the only market in Extreme-Bearish territory (below 20 percent). The next lowest strength scores were the Ultra 10-Year Bonds (26 percent), the 10-Year Bonds (27 percent) and the Fed Funds (27 percent).
Strength Statistics:
Fed Funds (26.7 percent) vs Fed Funds previous week (28.9 percent)
2-Year Bond (34.4 percent) vs 2-Year Bond previous week (30.5 percent)
5-Year Bond (13.2 percent) vs 5-Year Bond previous week (11.3 percent)
10-Year Bond (26.7 percent) vs 10-Year Bond previous week (16.5 percent)
Ultra 10-Year Bond (26.2 percent) vs Ultra 10-Year Bond previous week (16.7 percent)
US Treasury Bond (64.5 percent) vs US Treasury Bond previous week (63.3 percent)
Ultra US Treasury Bond (58.1 percent) vs Ultra US Treasury Bond previous week (56.1 percent)
SOFR 3-Months (82.3 percent) vs SOFR 3-Months previous week (66.1 percent)
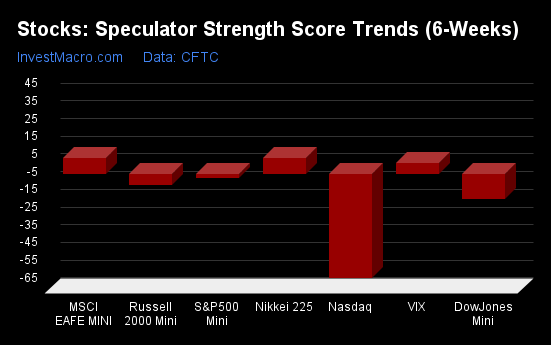
US Treasury Bonds & 2-Year Bonds top the 6-Week Strength Trends
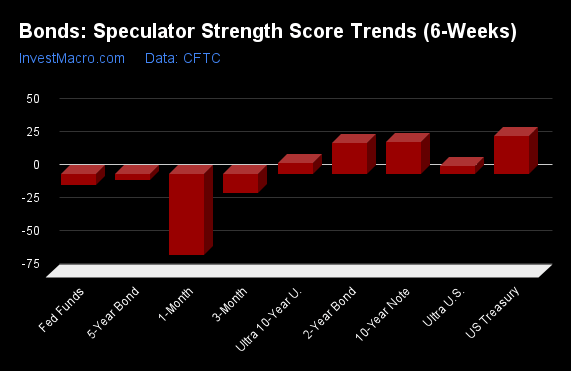
COT Strength Score Trends (or move index, calculates the 6-week changes in strength scores) showed that the US Treasury Bonds (29 percent), the 2-Year Bonds (24 percent) and the 10-Year Bonds (24 percent) lead the past six weeks trends for bonds.
The SOFR 3-Months (-14 percent), the Fed Funds (-9 percent) and the 5-Year Bonds (-4 percent) lead the downside trend scores currently.
Strength Trend Statistics:
Fed Funds (-8.5 percent) vs Fed Funds previous week (-23.5 percent)
2-Year Bond (23.6 percent) vs 2-Year Bond previous week (17.2 percent)
5-Year Bond (-4.4 percent) vs 5-Year Bond previous week (-3.9 percent)
10-Year Bond (23.9 percent) vs 10-Year Bond previous week (6.7 percent)
Ultra 10-Year Bond (8.2 percent) vs Ultra 10-Year Bond previous week (-8.5 percent)
US Treasury Bond (28.9 percent) vs US Treasury Bond previous week (24.7 percent)
Ultra US Treasury Bond (5.7 percent) vs Ultra US Treasury Bond previous week (3.9 percent)
SOFR 3-Months (-14.4 percent) vs SOFR 3-Months previous week (-33.9 percent)
Secured Overnight Financing Rate (3-Month) Futures:
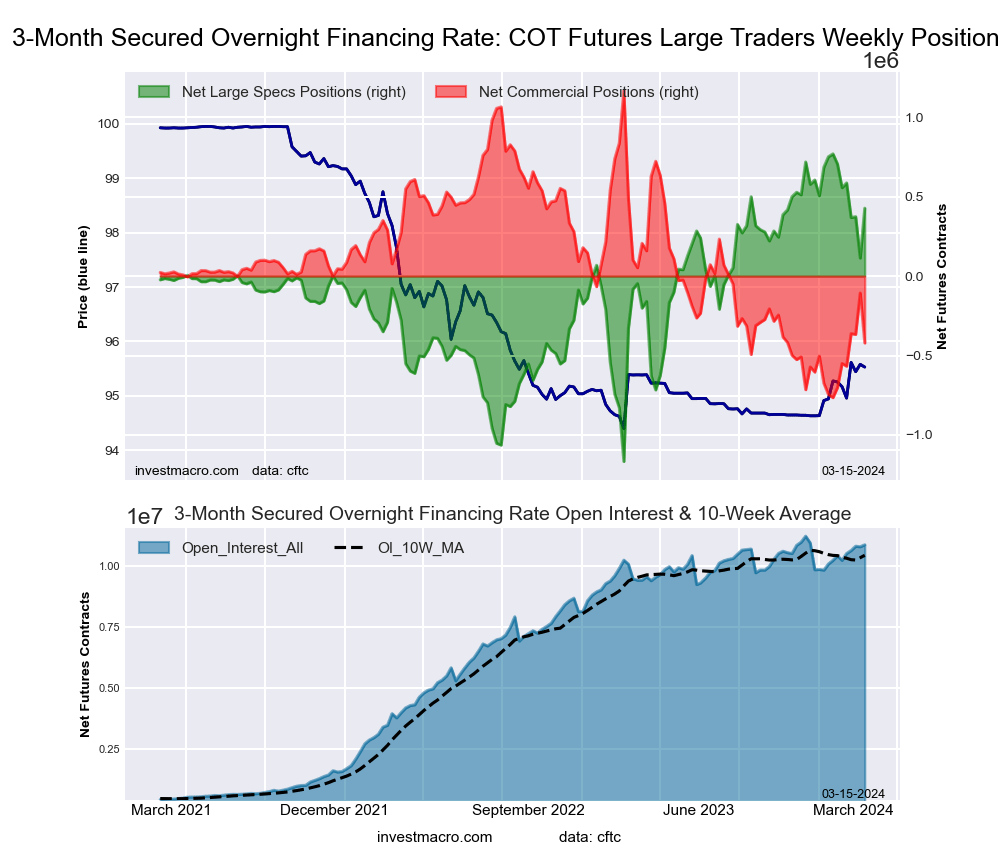 The Secured Overnight Financing Rate (3-Month) large speculator standing this week was a net position of 427,279 contracts in the data reported through Tuesday. This was a weekly gain of 313,749 contracts from the previous week which had a total of 113,530 net contracts.
This week’s current strength score (the trader positioning range over the past three years, measured from 0 to 100) shows the speculators are currently Bullish-Extreme with a score of 82.3 percent. The commercials are Bearish-Extreme with a score of 17.8 percent and the small traders (not shown in chart) are Bullish-Extreme with a score of 84.4 percent.
Price Trend-Following Model: Weak Uptrend
Our weekly trend-following model classifies the current market price position as: Weak Uptrend. The current action for the model is considered to be: Hold – Maintain Long Position.
| SOFR 3-Months Statistics | SPECULATORS | COMMERCIALS | SMALL TRADERS |
| – Percent of Open Interest Longs: | 17.6 | 54.9 | 0.3 |
| – Percent of Open Interest Shorts: | 13.7 | 58.8 | 0.3 |
| – Net Position: | 427,279 | -420,998 | -6,281 |
| – Gross Longs: | 1,915,030 | 5,967,032 | 28,910 |
| – Gross Shorts: | 1,487,751 | 6,388,030 | 35,191 |
| – Long to Short Ratio: | 1.3 to 1 | 0.9 to 1 | 0.8 to 1 |
| NET POSITION TREND: | |||
| – Strength Index Score (3 Year Range Pct): | 82.3 | 17.8 | 84.4 |
| – Strength Index Reading (3 Year Range): | Bullish-Extreme | Bearish-Extreme | Bullish-Extreme |
| NET POSITION MOVEMENT INDEX: | |||
| – 6-Week Change in Strength Index: | -14.4 | 14.5 | -1.3 |
30-Day Federal Funds Futures:
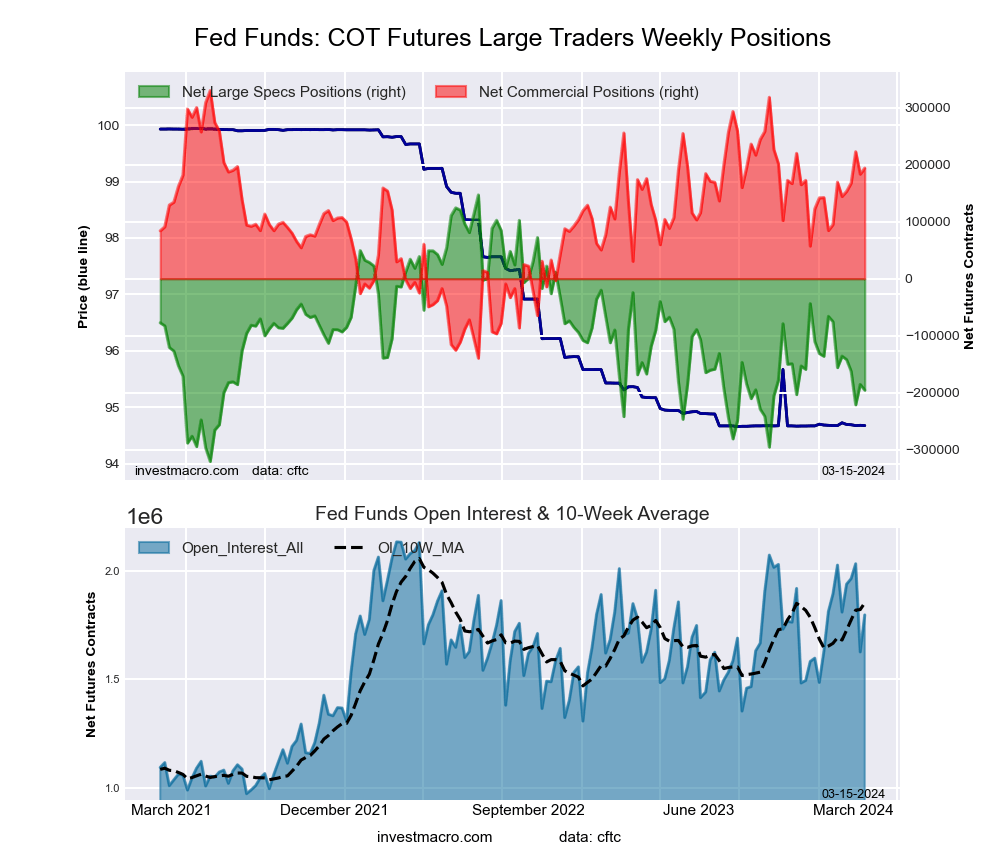 The 30-Day Federal Funds large speculator standing this week was a net position of -195,750 contracts in the data reported through Tuesday. This was a weekly decrease of -10,180 contracts from the previous week which had a total of -185,570 net contracts.
This week’s current strength score (the trader positioning range over the past three years, measured from 0 to 100) shows the speculators are currently Bearish with a score of 26.7 percent. The commercials are Bullish with a score of 71.0 percent and the small traders (not shown in chart) are Bullish-Extreme with a score of 93.9 percent.
Price Trend-Following Model: Downtrend
Our weekly trend-following model classifies the current market price position as: Downtrend. The current action for the model is considered to be: Hold – Maintain Short Position.
| 30-Day Federal Funds Statistics | SPECULATORS | COMMERCIALS | SMALL TRADERS |
| – Percent of Open Interest Longs: | 7.2 | 75.8 | 2.1 |
| – Percent of Open Interest Shorts: | 18.1 | 65.0 | 2.0 |
| – Net Position: | -195,750 | 194,281 | 1,469 |
| – Gross Longs: | 130,033 | 1,361,057 | 37,516 |
| – Gross Shorts: | 325,783 | 1,166,776 | 36,047 |
| – Long to Short Ratio: | 0.4 to 1 | 1.2 to 1 | 1.0 to 1 |
| NET POSITION TREND: | |||
| – Strength Index Score (3 Year Range Pct): | 26.7 | 71.0 | 93.9 |
| – Strength Index Reading (3 Year Range): | Bearish | Bullish | Bullish-Extreme |
| NET POSITION MOVEMENT INDEX: | |||
| – 6-Week Change in Strength Index: | -8.5 | 5.3 | 29.3 |
2-Year Treasury Note Futures:
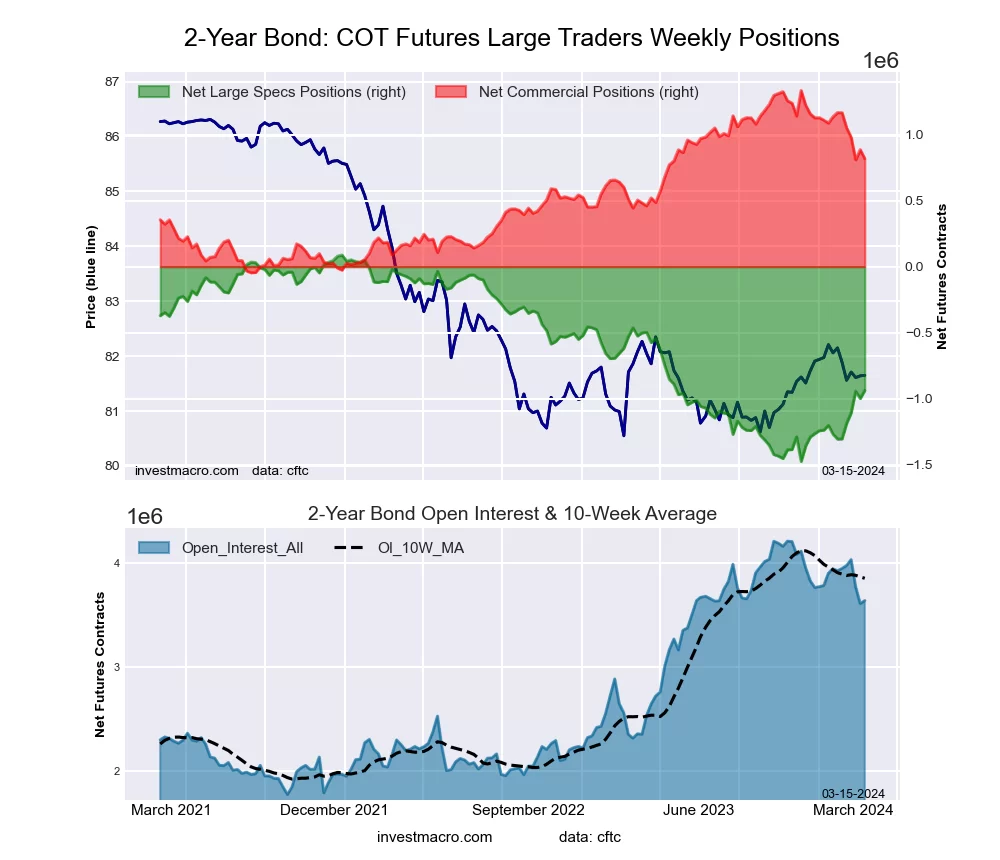 The 2-Year Treasury Note large speculator standing this week was a net position of -938,056 contracts in the data reported through Tuesday. This was a weekly advance of 61,465 contracts from the previous week which had a total of -999,521 net contracts.
This week’s current strength score (the trader positioning range over the past three years, measured from 0 to 100) shows the speculators are currently Bearish with a score of 34.4 percent. The commercials are Bullish with a score of 62.6 percent and the small traders (not shown in chart) are Bullish-Extreme with a score of 89.5 percent.
Price Trend-Following Model: Weak Uptrend
Our weekly trend-following model classifies the current market price position as: Weak Uptrend. The current action for the model is considered to be: Hold – Maintain Long Position.
| 2-Year Treasury Note Statistics | SPECULATORS | COMMERCIALS | SMALL TRADERS |
| – Percent of Open Interest Longs: | 11.7 | 80.0 | 6.9 |
| – Percent of Open Interest Shorts: | 37.5 | 57.5 | 3.6 |
| – Net Position: | -938,056 | 818,498 | 119,558 |
| – Gross Longs: | 426,089 | 2,908,549 | 251,836 |
| – Gross Shorts: | 1,364,145 | 2,090,051 | 132,278 |
| – Long to Short Ratio: | 0.3 to 1 | 1.4 to 1 | 1.9 to 1 |
| NET POSITION TREND: | |||
| – Strength Index Score (3 Year Range Pct): | 34.4 | 62.6 | 89.5 |
| – Strength Index Reading (3 Year Range): | Bearish | Bullish | Bullish-Extreme |
| NET POSITION MOVEMENT INDEX: | |||
| – 6-Week Change in Strength Index: | 23.6 | -25.3 | -7.6 |
5-Year Treasury Note Futures:
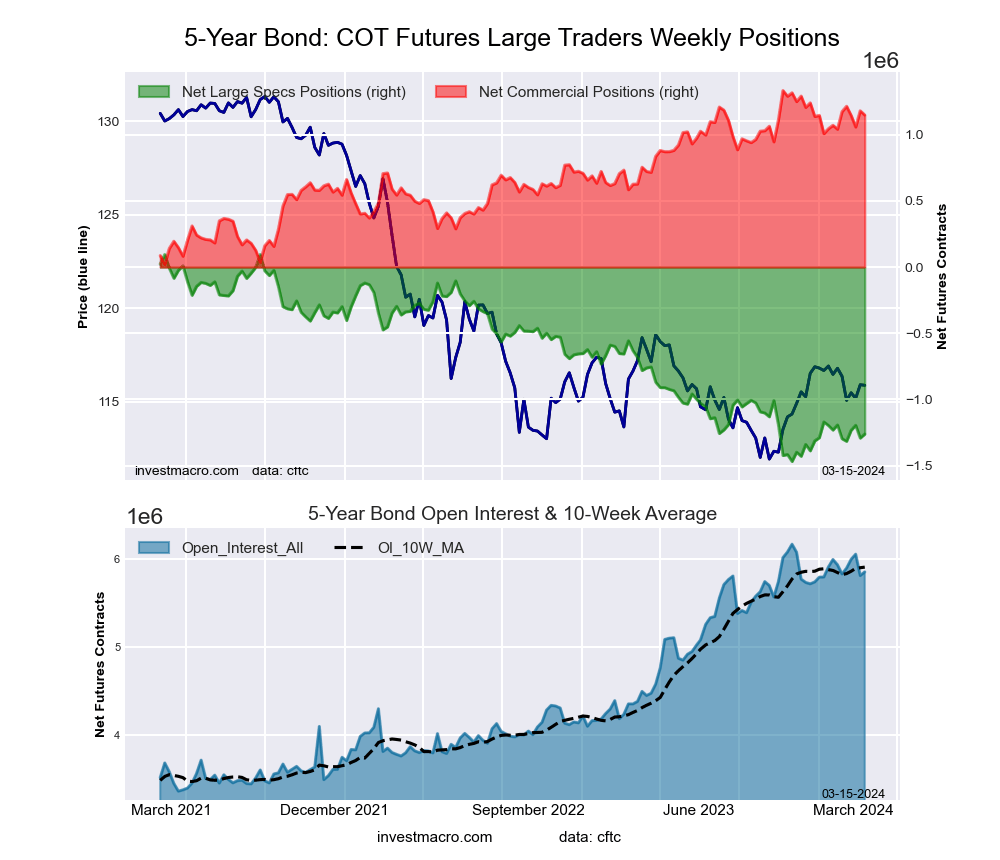 The 5-Year Treasury Note large speculator standing this week was a net position of -1,262,134 contracts in the data reported through Tuesday. This was a weekly boost of 29,753 contracts from the previous week which had a total of -1,291,887 net contracts.
This week’s current strength score (the trader positioning range over the past three years, measured from 0 to 100) shows the speculators are currently Bearish-Extreme with a score of 13.2 percent. The commercials are Bullish-Extreme with a score of 85.9 percent and the small traders (not shown in chart) are Bullish-Extreme with a score of 86.8 percent.
Price Trend-Following Model: Weak Uptrend
Our weekly trend-following model classifies the current market price position as: Weak Uptrend. The current action for the model is considered to be: Hold – Maintain Long Position.
| 5-Year Treasury Note Statistics | SPECULATORS | COMMERCIALS | SMALL TRADERS |
| – Percent of Open Interest Longs: | 6.1 | 85.2 | 6.9 |
| – Percent of Open Interest Shorts: | 27.6 | 65.6 | 5.0 |
| – Net Position: | -1,262,134 | 1,149,142 | 112,992 |
| – Gross Longs: | 355,674 | 4,992,128 | 404,802 |
| – Gross Shorts: | 1,617,808 | 3,842,986 | 291,810 |
| – Long to Short Ratio: | 0.2 to 1 | 1.3 to 1 | 1.4 to 1 |
| NET POSITION TREND: | |||
| – Strength Index Score (3 Year Range Pct): | 13.2 | 85.9 | 86.8 |
| – Strength Index Reading (3 Year Range): | Bearish-Extreme | Bullish-Extreme | Bullish-Extreme |
| NET POSITION MOVEMENT INDEX: | |||
| – 6-Week Change in Strength Index: | -4.4 | 8.2 | -8.1 |
10-Year Treasury Note Futures:
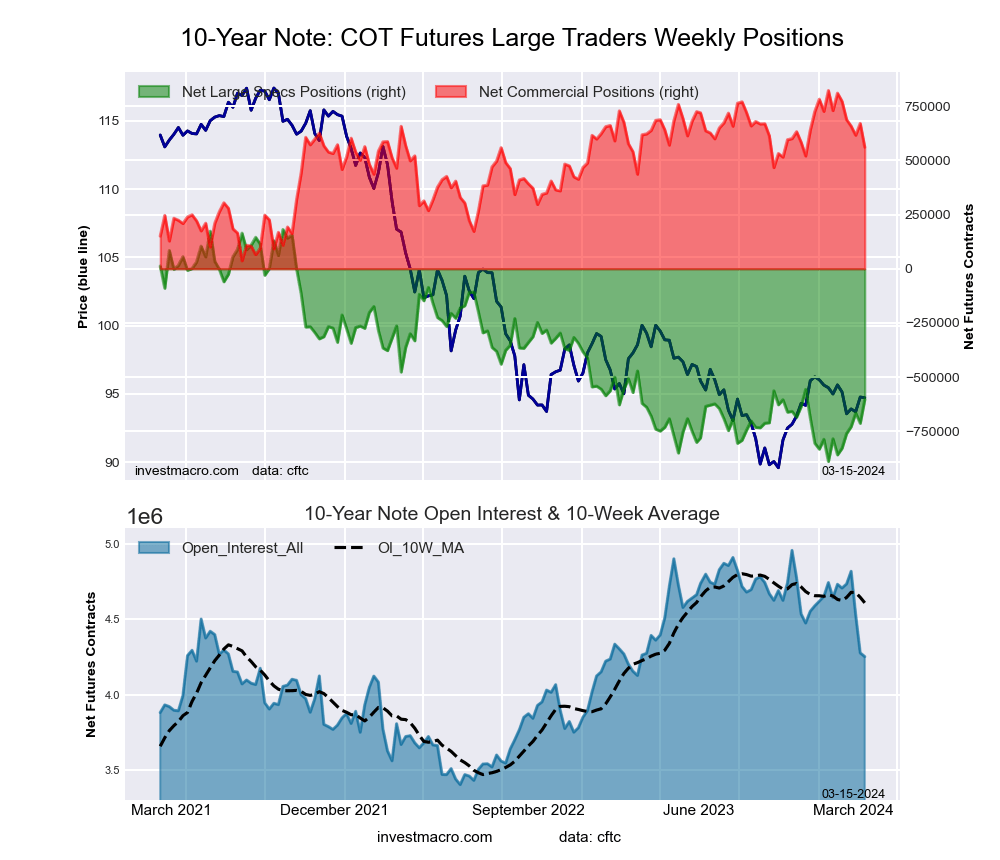 The 10-Year Treasury Note large speculator standing this week was a net position of -603,546 contracts in the data reported through Tuesday. This was a weekly rise of 109,712 contracts from the previous week which had a total of -713,258 net contracts.
This week’s current strength score (the trader positioning range over the past three years, measured from 0 to 100) shows the speculators are currently Bearish with a score of 26.7 percent. The commercials are Bullish with a score of 66.7 percent and the small traders (not shown in chart) are Bullish-Extreme with a score of 82.7 percent.
Price Trend-Following Model: Weak Uptrend
Our weekly trend-following model classifies the current market price position as: Weak Uptrend. The current action for the model is considered to be: Hold – Maintain Long Position.
| 10-Year Treasury Note Statistics | SPECULATORS | COMMERCIALS | SMALL TRADERS |
| – Percent of Open Interest Longs: | 10.8 | 78.6 | 9.2 |
| – Percent of Open Interest Shorts: | 25.0 | 65.4 | 8.2 |
| – Net Position: | -603,546 | 561,179 | 42,367 |
| – Gross Longs: | 457,839 | 3,342,267 | 390,056 |
| – Gross Shorts: | 1,061,385 | 2,781,088 | 347,689 |
| – Long to Short Ratio: | 0.4 to 1 | 1.2 to 1 | 1.1 to 1 |
| NET POSITION TREND: | |||
| – Strength Index Score (3 Year Range Pct): | 26.7 | 66.7 | 82.7 |
| – Strength Index Reading (3 Year Range): | Bearish | Bullish | Bullish-Extreme |
| NET POSITION MOVEMENT INDEX: | |||
| – 6-Week Change in Strength Index: | 23.9 | -31.8 | -1.3 |
Ultra 10-Year Notes Futures:
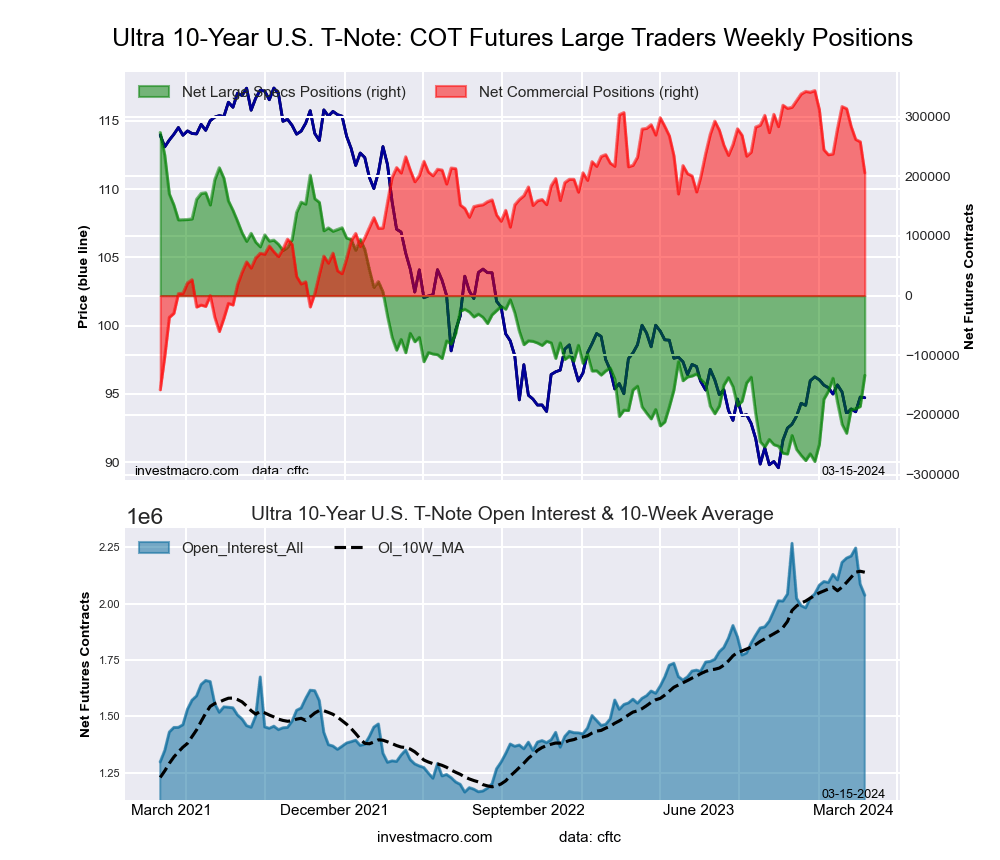 The Ultra 10-Year Notes large speculator standing this week was a net position of -133,670 contracts in the data reported through Tuesday. This was a weekly advance of 51,988 contracts from the previous week which had a total of -185,658 net contracts.
This week’s current strength score (the trader positioning range over the past three years, measured from 0 to 100) shows the speculators are currently Bearish with a score of 26.2 percent. The commercials are Bullish with a score of 72.5 percent and the small traders (not shown in chart) are Bullish with a score of 71.0 percent.
Price Trend-Following Model: Weak Uptrend
Our weekly trend-following model classifies the current market price position as: Weak Uptrend. The current action for the model is considered to be: Hold – Maintain Long Position.
| Ultra 10-Year Notes Statistics | SPECULATORS | COMMERCIALS | SMALL TRADERS |
| – Percent of Open Interest Longs: | 14.3 | 73.9 | 10.0 |
| – Percent of Open Interest Shorts: | 20.8 | 63.8 | 13.6 |
| – Net Position: | -133,670 | 206,104 | -72,434 |
| – Gross Longs: | 291,066 | 1,505,286 | 204,645 |
| – Gross Shorts: | 424,736 | 1,299,182 | 277,079 |
| – Long to Short Ratio: | 0.7 to 1 | 1.2 to 1 | 0.7 to 1 |
| NET POSITION TREND: | |||
| – Strength Index Score (3 Year Range Pct): | 26.2 | 72.5 | 71.0 |
| – Strength Index Reading (3 Year Range): | Bearish | Bullish | Bullish |
| NET POSITION MOVEMENT INDEX: | |||
| – 6-Week Change in Strength Index: | 8.2 | -14.8 | 17.0 |
US Treasury Bonds Futures:
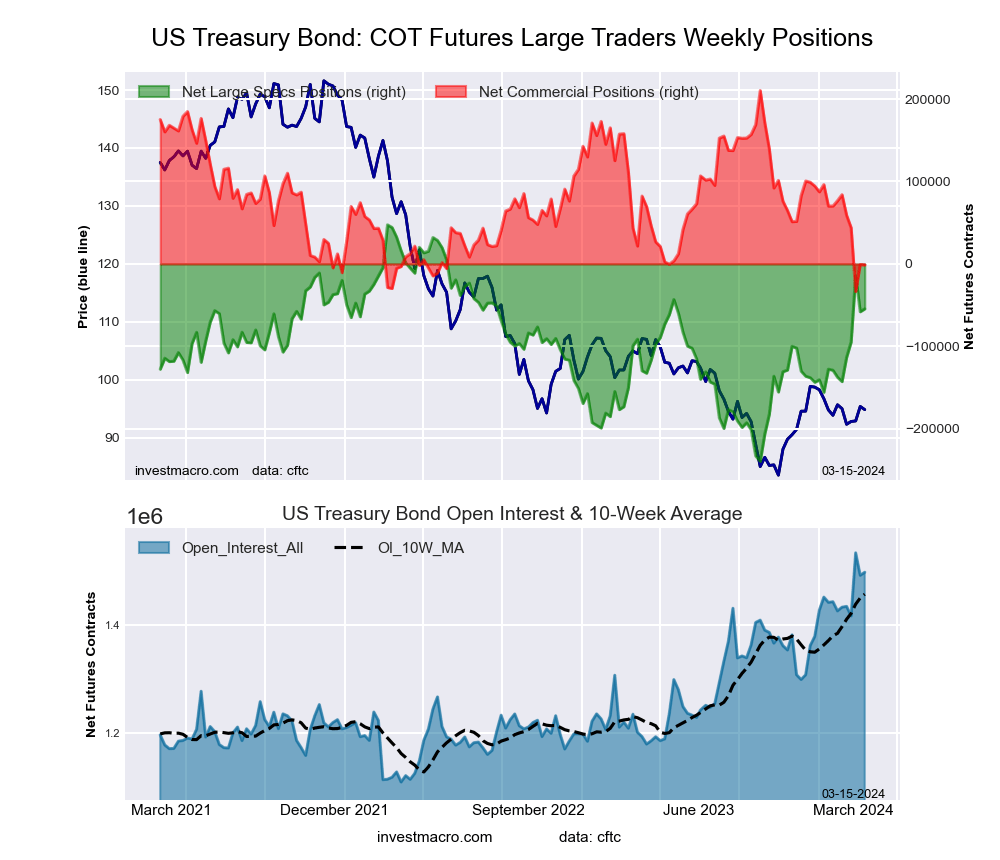 The US Treasury Bonds large speculator standing this week was a net position of -54,533 contracts in the data reported through Tuesday. This was a weekly lift of 3,503 contracts from the previous week which had a total of -58,036 net contracts.
This week’s current strength score (the trader positioning range over the past three years, measured from 0 to 100) shows the speculators are currently Bullish with a score of 64.5 percent. The commercials are Bearish-Extreme with a score of 13.2 percent and the small traders (not shown in chart) are Bullish-Extreme with a score of 89.1 percent.
Price Trend-Following Model: Weak Uptrend
Our weekly trend-following model classifies the current market price position as: Weak Uptrend. The current action for the model is considered to be: Hold – Maintain Long Position.
| US Treasury Bonds Statistics | SPECULATORS | COMMERCIALS | SMALL TRADERS |
| – Percent of Open Interest Longs: | 15.4 | 69.7 | 13.1 |
| – Percent of Open Interest Shorts: | 19.1 | 69.8 | 9.4 |
| – Net Position: | -54,533 | -1,317 | 55,850 |
| – Gross Longs: | 231,115 | 1,043,932 | 196,307 |
| – Gross Shorts: | 285,648 | 1,045,249 | 140,457 |
| – Long to Short Ratio: | 0.8 to 1 | 1.0 to 1 | 1.4 to 1 |
| NET POSITION TREND: | |||
| – Strength Index Score (3 Year Range Pct): | 64.5 | 13.2 | 89.1 |
| – Strength Index Reading (3 Year Range): | Bullish | Bearish-Extreme | Bullish-Extreme |
| NET POSITION MOVEMENT INDEX: | |||
| – 6-Week Change in Strength Index: | 28.9 | -32.0 | -3.7 |
Ultra US Treasury Bonds Futures:
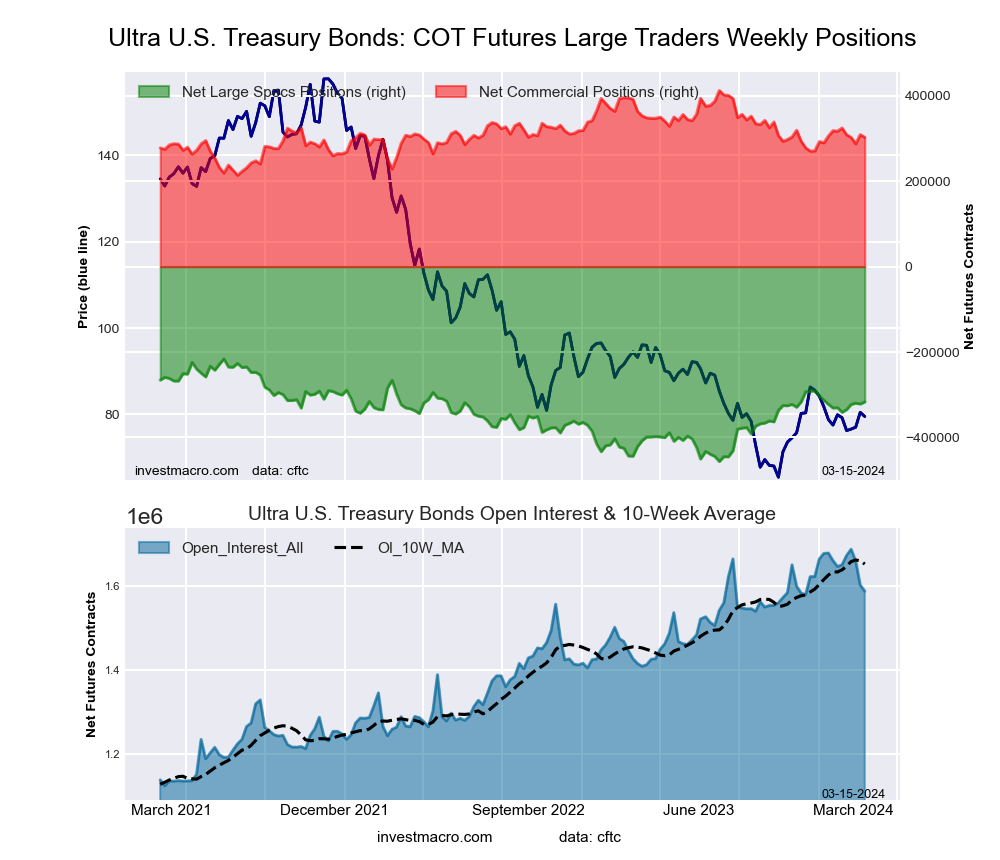 The Ultra US Treasury Bonds large speculator standing this week was a net position of -316,870 contracts in the data reported through Tuesday. This was a weekly lift of 4,866 contracts from the previous week which had a total of -321,736 net contracts.
This week’s current strength score (the trader positioning range over the past three years, measured from 0 to 100) shows the speculators are currently Bullish with a score of 58.1 percent. The commercials are Bearish with a score of 44.8 percent and the small traders (not shown in chart) are Bullish with a score of 50.2 percent.
Price Trend-Following Model: Weak Uptrend
Our weekly trend-following model classifies the current market price position as: Weak Uptrend. The current action for the model is considered to be: Hold – Maintain Long Position.
| Ultra US Treasury Bonds Statistics | SPECULATORS | COMMERCIALS | SMALL TRADERS |
| – Percent of Open Interest Longs: | 8.6 | 80.1 | 10.8 |
| – Percent of Open Interest Shorts: | 28.5 | 61.0 | 10.0 |
| – Net Position: | -316,870 | 303,111 | 13,759 |
| – Gross Longs: | 136,059 | 1,271,662 | 172,255 |
| – Gross Shorts: | 452,929 | 968,551 | 158,496 |
| – Long to Short Ratio: | 0.3 to 1 | 1.3 to 1 | 1.1 to 1 |
| NET POSITION TREND: | |||
| – Strength Index Score (3 Year Range Pct): | 58.1 | 44.8 | 50.2 |
| – Strength Index Reading (3 Year Range): | Bullish | Bearish | Bullish |
| NET POSITION MOVEMENT INDEX: | |||
| – 6-Week Change in Strength Index: | 5.7 | -7.2 | 0.6 |
Article By InvestMacro – Receive our weekly COT Newsletter
*COT Report: The COT data, released weekly to the public each Friday, is updated through the most recent Tuesday (data is 3 days old) and shows a quick view of how large speculators or non-commercials (for-profit traders) were positioned in the futures markets.
The CFTC categorizes trader positions according to commercial hedgers (traders who use futures contracts for hedging as part of the business), non-commercials (large traders who speculate to realize trading profits) and nonreportable traders (usually small traders/speculators) as well as their open interest (contracts open in the market at time of reporting). See CFTC criteria here.