By ForexTime
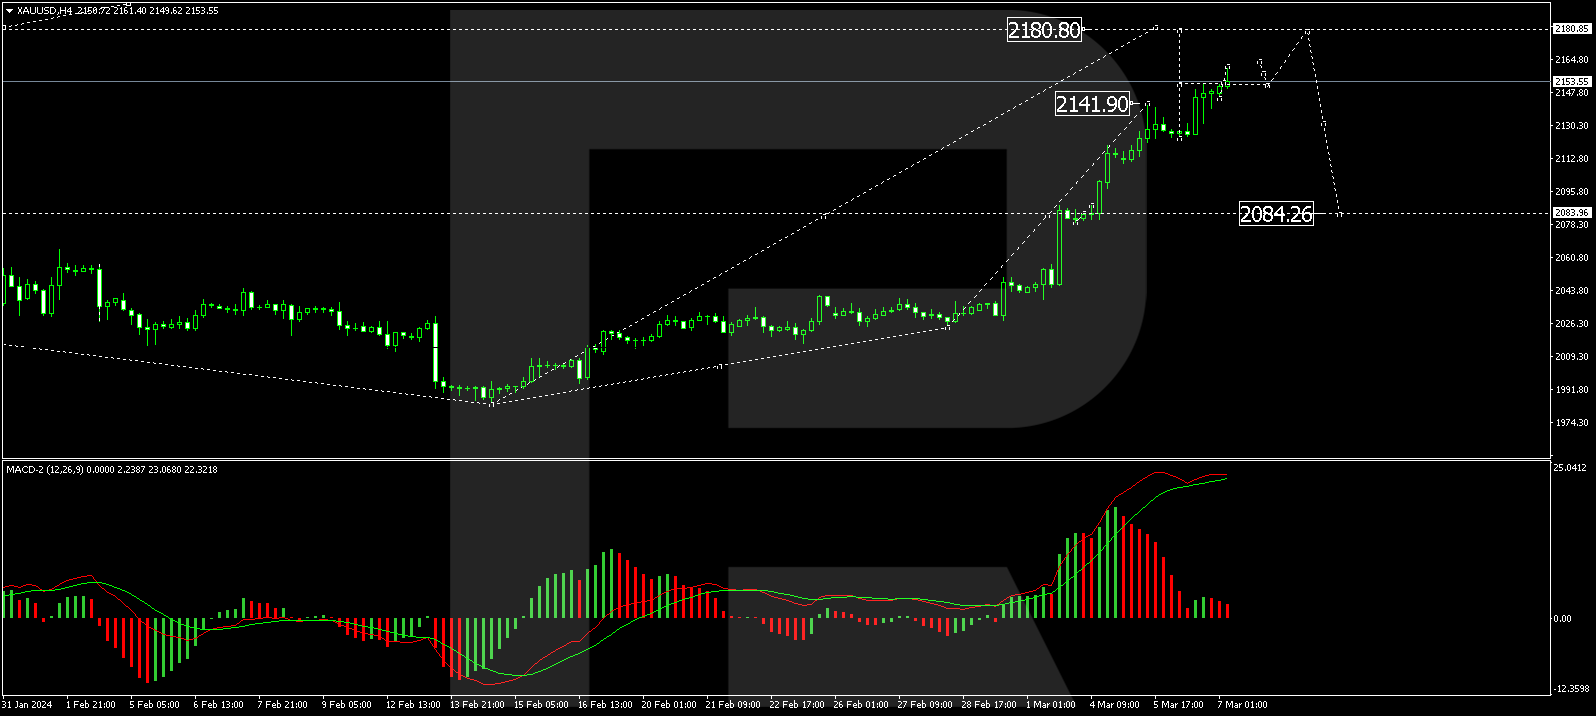
- H4/D1 upside momentum still in play
- Prices above 50 EMA & MACD bullish
- CCI indicator hints possible oversold situation
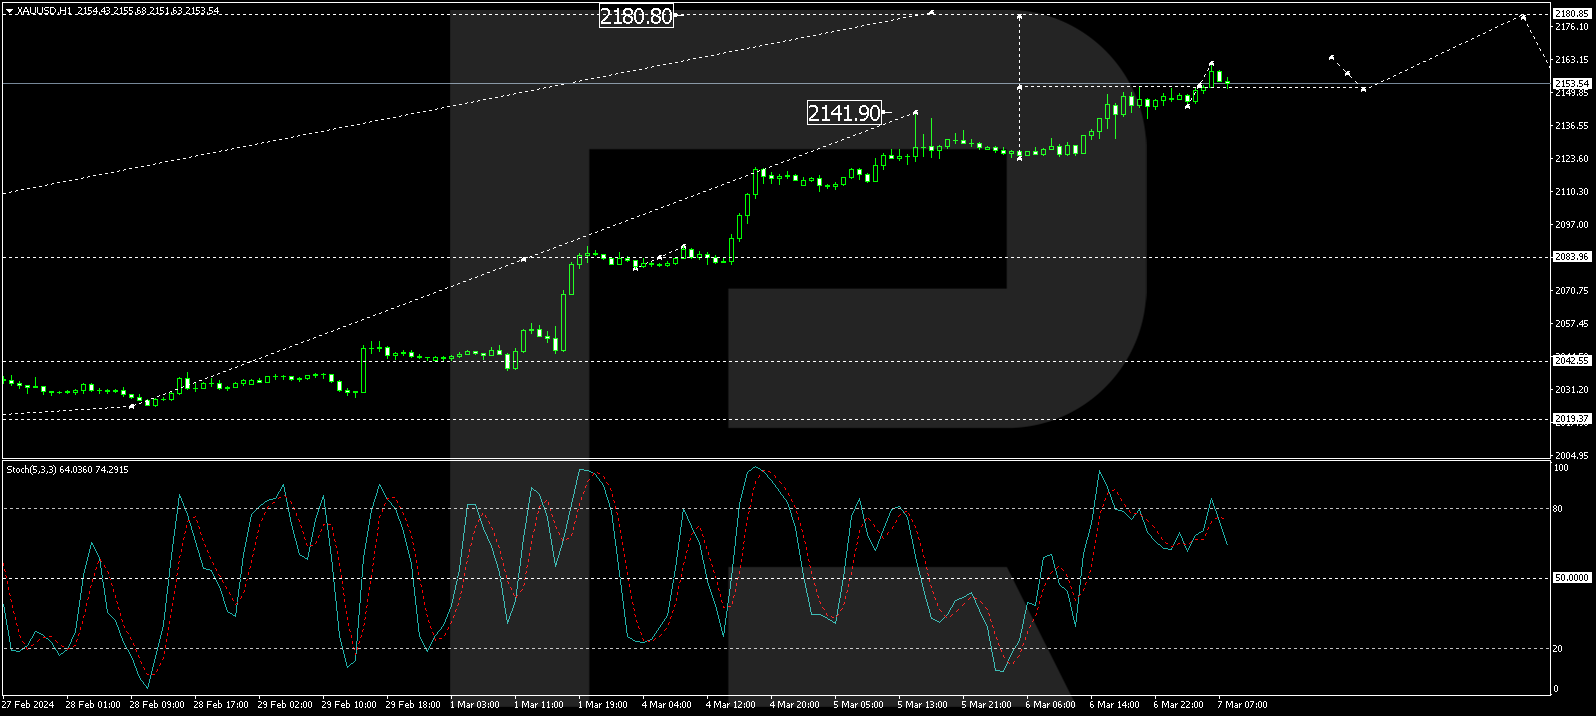
- 4 potential targets on H4 timeframe
- Bullish scenario void below 23.943
After closing over 1% lower in the previous session, Silver kicked off Wednesday on a positive note with bulls not going down without a fight!
The precious metal initially found itself under fresh selling pressure on Tuesday after hotter-than-expected US inflation data dampened hopes around the Fed cutting interest rates in the coming months. It is worth noting that silver often follows gold’s direction, with interest rate bets impacting appetite for non-yielding assets like silver.
Last Friday, traders fully priced in a Fed rate cut by June following the mixed US jobs report.
These odds have now dropped to 75% following the sticky inflation data for February.
Rate cut bets could fall even further if more incoming US data this week support the argument around US rates remaining higher for longer.
Given silver’s zero-yielding nature, such a development may create headwinds down the road for bulls.
Nevertheless, silver is currently in a daily uptrend after breaking out of a ranging period where the price oscillated around a weekly support level at 22.433.
The current price action confirms that a correction wave is presently in progress.

While the current larger economic scenarios may impact the metal’s trajectory, the bullish momentum might not be over yet with prices potentially hitting the next weekly resistance level at 25.919.
On the 4-hour chart an uptrend is also in progress. The consecutively higher top and bottom can clearly be seen, but there has been a flatting of the market structure, signifying a slowdown in momentum.
The price is however still above the 50 Exponential Moving Average and the longer price cycle Moving Average Convergence Divergence (MACD) Oscillators confirms the bullish sentiment by being above the zero base line. The Commodity Channel Index (CCI) gives a hint of a possible oversold situation with the potential of an increase in demand on the horizon.
If the price reaches the 24.676 level, a long scenario becomes feasible.
Attaching a modified Fibonacci tool to the trigger level at 24.676 and dragging it to just below the last bottom at 23.943, four conservative targets can be established:
Target 1: at 24.969
Target 2: at 25.116
Target 3: at 25.409
Target 4: at 25.776
If the price breaks past 23.943, this opportunity becomes invalid.

![]() Article by ForexTime
Article by ForexTime
ForexTime Ltd (FXTM) is an award winning international online forex broker regulated by CySEC 185/12 www.forextime.com