
By RoboForex Analytical Department
For the last month and a half, the crude oil market has been under a constant stress. Sentiment changes mostly because of the supply and demand forecasts. A Brent barrel price dropped to 75.65 USD yesterday.
The decline was triggered by the decision of Saudi Arabia to decrease prices for its buyers starting February, regardless of the region. The discount will amount to 2 USD, which is quite a lot.
The market thinks that the Saudis have either noticed a demand slump and are now trying to run ahead of it, or they have decided to shove away the competitors, such as the US crude oil producers.
Brent technical analysis
Free Reports:
 Get our Weekly Commitment of Traders Reports - See where the biggest traders (Hedge Funds and Commercial Hedgers) are positioned in the futures markets on a weekly basis.
 Download Our Metatrader 4 Indicators – Put Our Free MetaTrader 4 Custom Indicators on your charts when you join our Weekly Newsletter
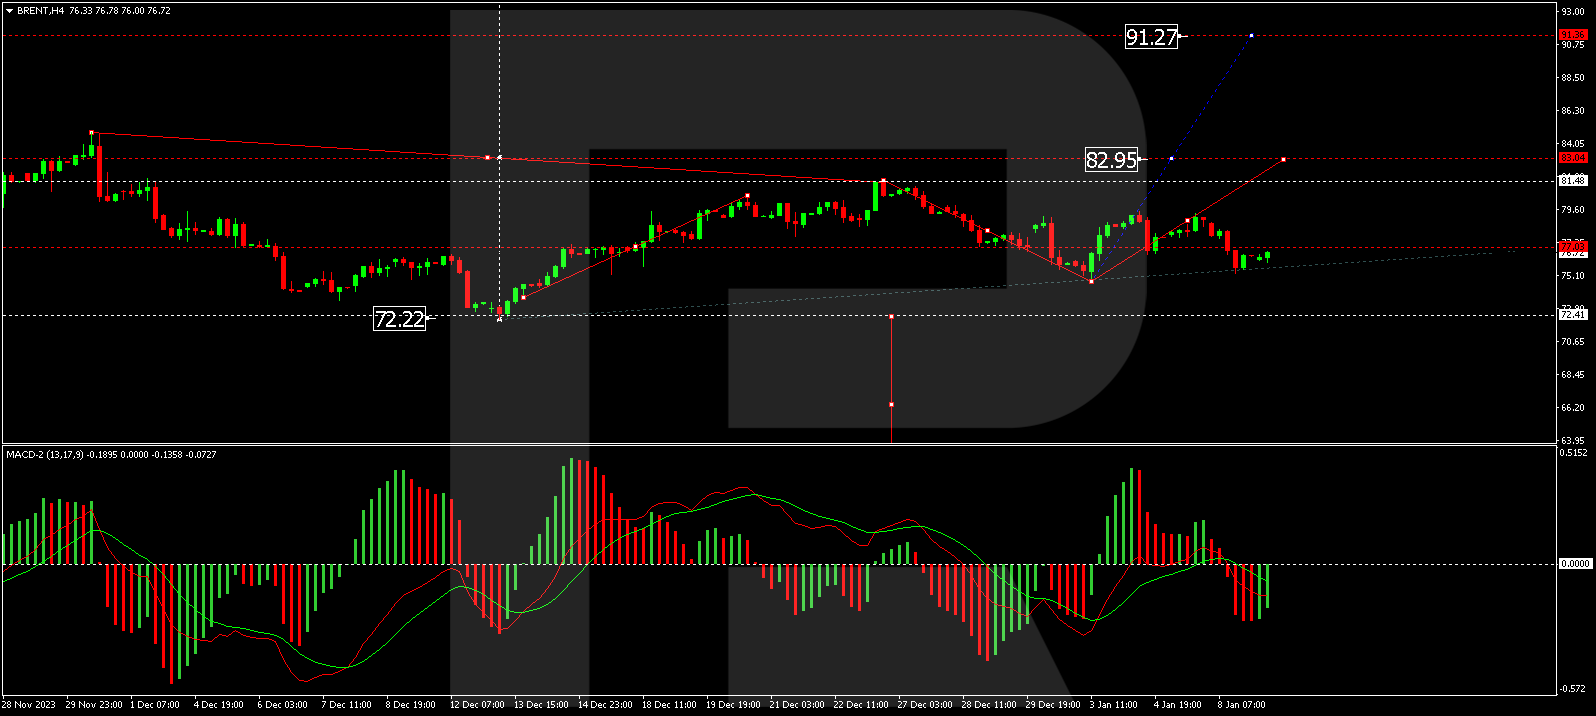
On the H4 Brent chart, the quotes have corrected to 74.74. A consolidation range is now forming around the 78.15 level. An escape from the range upwards might open the potential for a growth wave to 81.50. This is a local target. With an escape from the range downwards, the correction could continue to 70.00. Technically, this scenario is confirmed by the MACD, whose signal line is under zero, preparing to start growing.
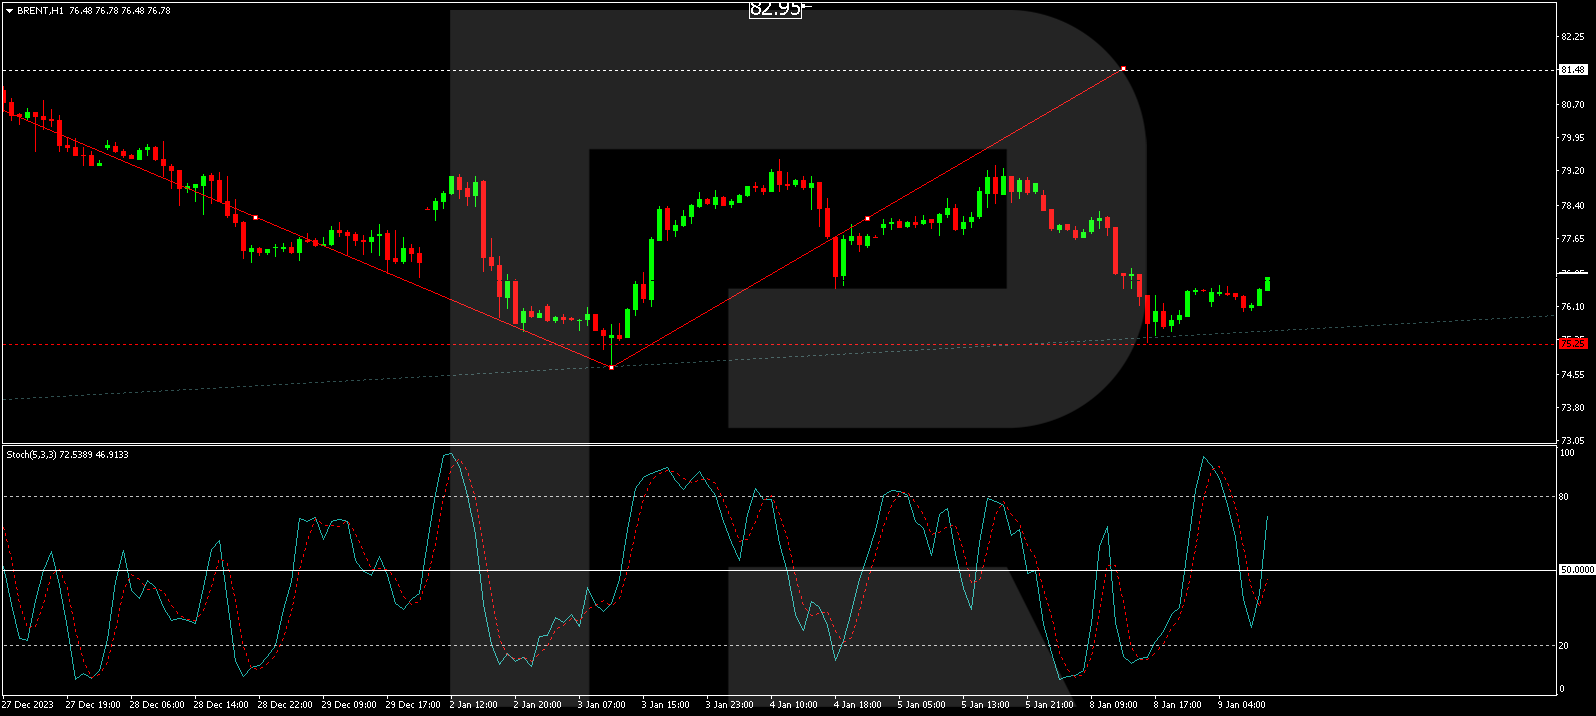
On the H1 Brent chart, the quotes have completed a growth wave to 79.45 and a correction to 75.25. Today a growth link to 80.00 is expected to develop. If this level breaks, the wave could continue to 81.50. Technically, this scenario is confirmed by the Stochastic oscillator: its signal line is under 50, aimed strictly upwards to 80.
Disclaimer
Any forecasts contained herein are based on the author’s particular opinion. This analysis may not be treated as trading advice. RoboForex bears no responsibility for trading results based on trading recommendations and reviews contained herein.

- Results in Line for Most Reporting Companies Aug 5, 2026
- Stock indices continue to break records. Oil is falling amid intensified diplomatic dialogue between the US and Iran Aug 5, 2026
- USD/JPY Holds Steady After Intervention: Outlook Remains Uncertain Aug 5, 2026
- EUR/USD: Busy Week Ahead Aug 3, 2026
- Positive sentiment in the AI sector supported stock indices. Oil prices remain volatile Aug 3, 2026
- The Tech‑heavy NASDAQ Index jumped by more than 3.3%. The offshore yuan is trading at its highest level since 2023 Jul 31, 2026
- USD/JPY After Volatility: Multiple Events in One Day Jul 31, 2026
- The US indices sell off amid renewed US-Iran clashes. Oil jumps by 7% Jul 30, 2026
- USD/JPY Temporary in Equilibrium: Multiple Factors in Focus Jul 30, 2026
- GBP/USD at Month’s Lows: The Outlook Remains Weak Jul 29, 2026
