By InvestMacro
Here are the latest charts and statistics for the Commitment of Traders (COT) reports data published by the Commodities Futures Trading Commission (CFTC).
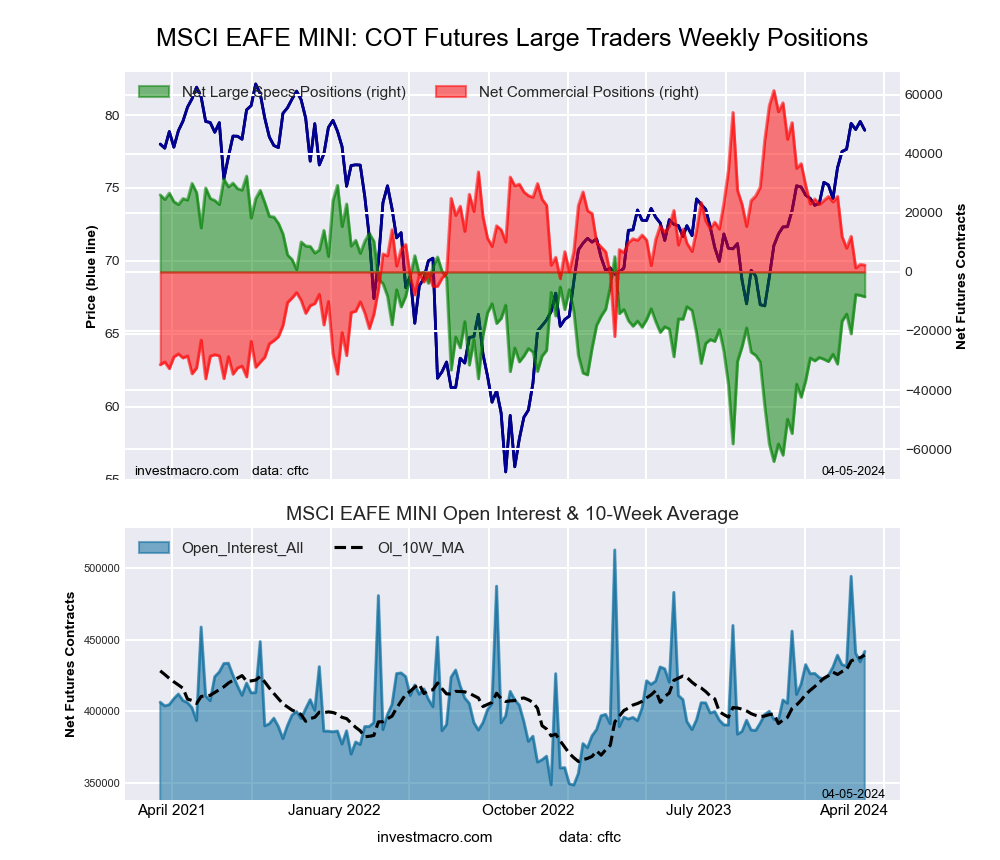
The latest COT data is updated through Tuesday April 2nd and shows a quick view of how large traders (for-profit speculators and commercial entities) were positioned in the futures markets.
Weekly Speculator Changes led by Sugar & Coffee
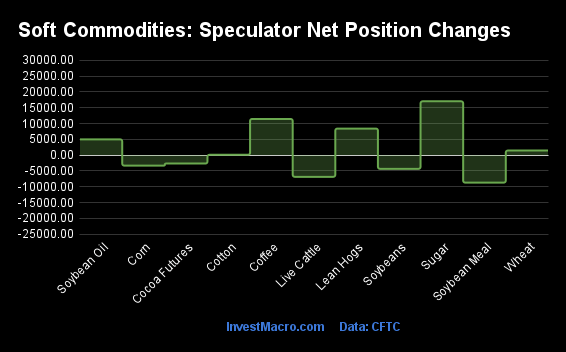
The COT soft commodities markets speculator bets were higher this week as six out of the eleven softs markets we cover had higher positioning while the other five markets had lower speculator contracts.
Leading the gains for the softs markets was Sugar (17,036 contracts) with Coffee (11,447 contracts), Lean Hogs (8,408 contracts), Soybean Oil (4,994 contracts), Wheat (1,465 contracts) and Cotton (126 contracts) also showing positive weeks.
The markets with the declines in speculator bets this week were Soybean Meal (-8,692 contracts), Live Cattle (-6,854 contracts), Soybeans (-4,326 contracts), Corn (-3,315 contracts) and Cocoa (-2,659 contracts) also registering lower bets on the week.
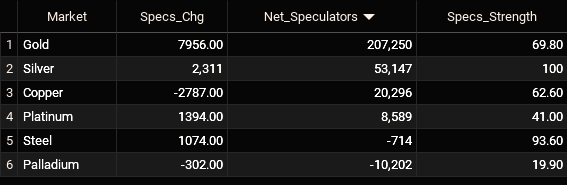
Soft Commodities Net Speculators Leaderboard
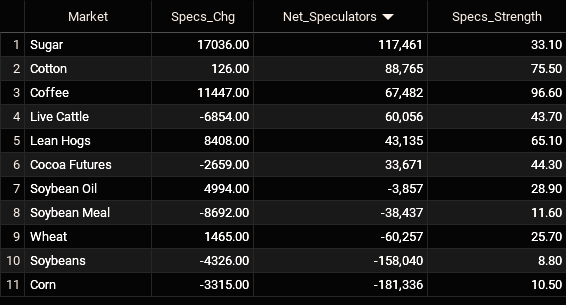
Legend: Weekly Speculators Change | Speculators Current Net Position | Speculators Strength Score compared to last 3-Years (0-100 range)
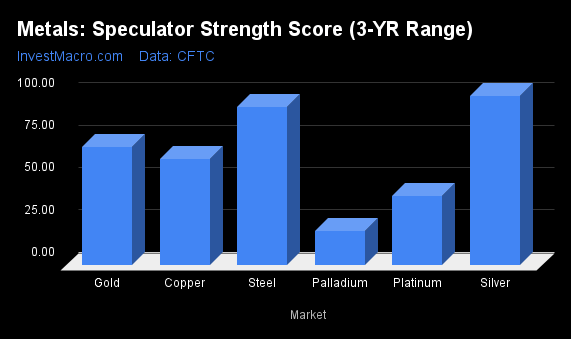
Strength Scores led by Coffee & Cotton
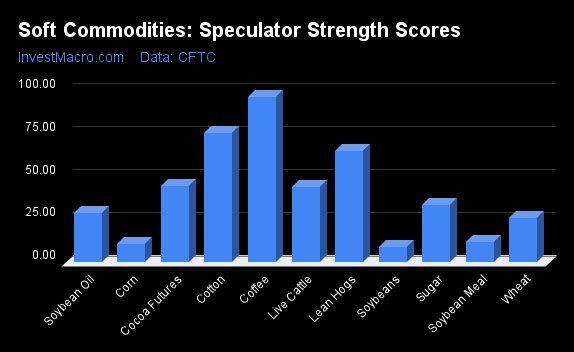
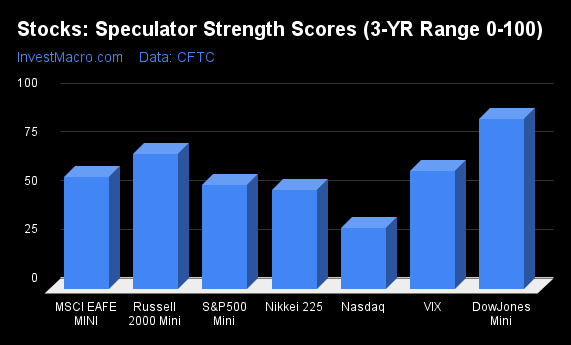
COT Strength Scores (a normalized measure of Speculator positions over a 3-Year range, from 0 to 100 where above 80 is Extreme-Bullish and below 20 is Extreme-Bearish) showed that Coffee (97 percent) and Cotton (76 percent) lead the softs markets this week. Lean Hogs (65 percent), Cocoa (44 percent) and Live Cattle (44 percent) come in as the next highest in the weekly strength scores.
On the downside, Soybeans (9 percent), Corn (10 percent) and Soybean Meal (12 percent) come in at the lowest strength levels currently and are in Extreme-Bearish territory (below 20 percent). The next lowest strength score is in Wheat (26 percent).
Strength Statistics:
Corn (10.5 percent) vs Corn previous week (10.9 percent)
Sugar (33.1 percent) vs Sugar previous week (26.9 percent)
Coffee (96.6 percent) vs Coffee previous week (84.9 percent)
Soybeans (8.8 percent) vs Soybeans previous week (9.7 percent)
Soybean Oil (28.9 percent) vs Soybean Oil previous week (25.7 percent)
Soybean Meal (11.6 percent) vs Soybean Meal previous week (15.2 percent)
Live Cattle (43.7 percent) vs Live Cattle previous week (51.1 percent)
Lean Hogs (65.1 percent) vs Lean Hogs previous week (58.2 percent)
Cotton (75.5 percent) vs Cotton previous week (75.4 percent)
Cocoa (44.3 percent) vs Cocoa previous week (47.0 percent)
Wheat (25.7 percent) vs Wheat previous week (24.6 percent)
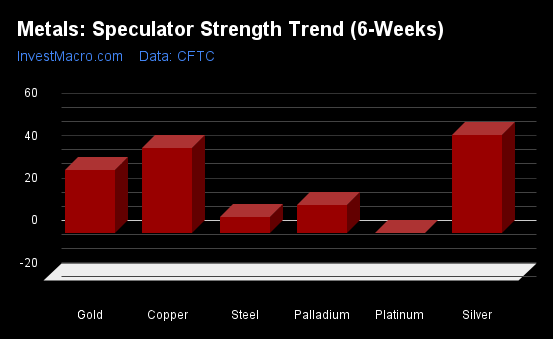
Lean Hogs & Soybean Oil top the 6-Week Strength Trends
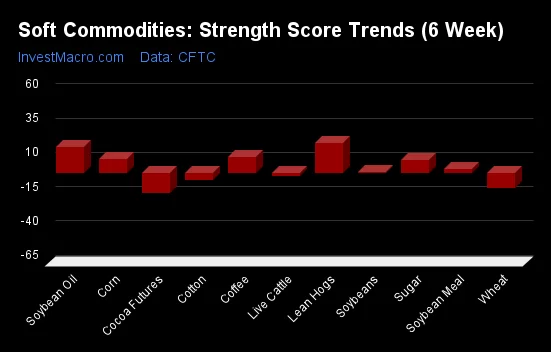
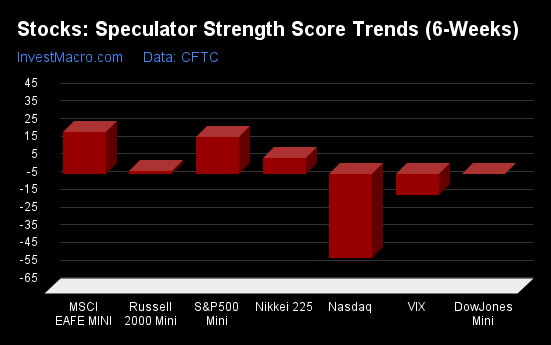
COT Strength Score Trends (or move index, calculates the 6-week changes in strength scores) showed that Lean Hogs (22 percent) and Soybean Oil (19 percent) lead the past six weeks trends for soft commodities. Coffee (12 percent), Corn (10 percent) and Sugar (9 percent) are the next highest positive movers in the latest trends data.
Cocoa (-15 percent) leads the downside trend scores currently with Wheat (-11 percent), Cotton (-5 percent) and Live Cattle (-2 percent) following next with lower trend scores.
Strength Trend Statistics:
Corn (10.5 percent) vs Corn previous week (8.4 percent)
Sugar (9.3 percent) vs Sugar previous week (3.0 percent)
Coffee (11.9 percent) vs Coffee previous week (-4.2 percent)
Soybeans (0.5 percent) vs Soybeans previous week (1.8 percent)
Soybean Oil (19.3 percent) vs Soybean Oil previous week (10.1 percent)
Soybean Meal (2.9 percent) vs Soybean Meal previous week (6.4 percent)
Live Cattle (-2.0 percent) vs Live Cattle previous week (14.4 percent)
Lean Hogs (21.9 percent) vs Lean Hogs previous week (27.2 percent)
Cotton (-4.8 percent) vs Cotton previous week (3.5 percent)
Cocoa (-14.7 percent) vs Cocoa previous week (-13.3 percent)
Wheat (-10.8 percent) vs Wheat previous week (-22.7 percent)
Individual Soft Commodities Markets:
CORN Futures:
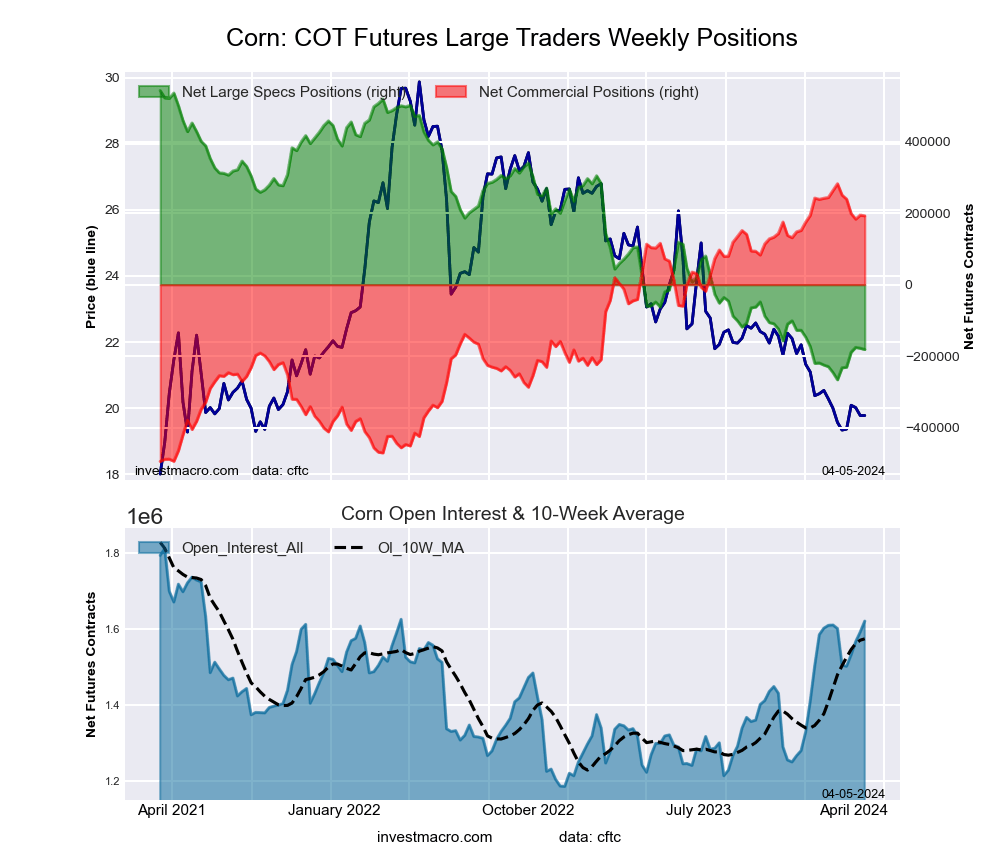 The CORN large speculator standing this week totaled a net position of -181,336 contracts in the data reported through Tuesday. This was a weekly reduction of -3,315 contracts from the previous week which had a total of -178,021 net contracts.
This week’s current strength score (the trader positioning range over the past three years, measured from 0 to 100) shows the speculators are currently Bearish-Extreme with a score of 10.5 percent. The commercials are Bullish-Extreme with a score of 88.4 percent and the small traders (not shown in chart) are Bullish-Extreme with a score of 95.5 percent.
Price Trend-Following Model: Downtrend
Our weekly trend-following model classifies the current market price position as: Downtrend. The current action for the model is considered to be: Hold – Maintain Short Position.
| CORN Futures Statistics | SPECULATORS | COMMERCIALS | SMALL TRADERS |
| – Percent of Open Interest Longs: | 18.2 | 43.1 | 9.8 |
| – Percent of Open Interest Shorts: | 29.3 | 31.2 | 10.5 |
| – Net Position: | -181,336 | 192,640 | -11,304 |
| – Gross Longs: | 294,298 | 698,351 | 159,330 |
| – Gross Shorts: | 475,634 | 505,711 | 170,634 |
| – Long to Short Ratio: | 0.6 to 1 | 1.4 to 1 | 0.9 to 1 |
| NET POSITION TREND: | | | |
| – Strength Index Score (3 Year Range Pct): | 10.5 | 88.4 | 95.5 |
| – Strength Index Reading (3 Year Range): | Bearish-Extreme | Bullish-Extreme | Bullish-Extreme |
| NET POSITION MOVEMENT INDEX: | | | |
| – 6-Week Change in Strength Index: | 10.5 | -11.6 | 7.0 |
SUGAR Futures:
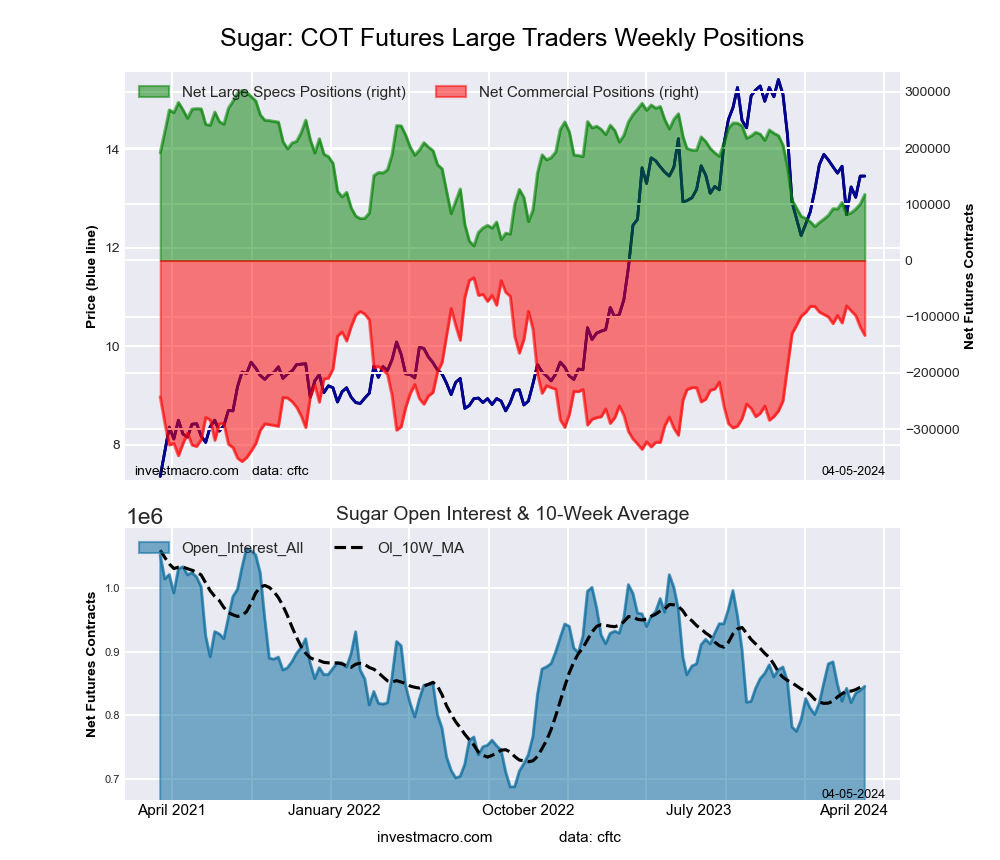 The SUGAR large speculator standing this week totaled a net position of 117,461 contracts in the data reported through Tuesday. This was a weekly rise of 17,036 contracts from the previous week which had a total of 100,425 net contracts.
This week’s current strength score (the trader positioning range over the past three years, measured from 0 to 100) shows the speculators are currently Bearish with a score of 33.1 percent. The commercials are Bullish with a score of 68.7 percent and the small traders (not shown in chart) are Bearish with a score of 25.3 percent.
Price Trend-Following Model: Downtrend
Our weekly trend-following model classifies the current market price position as: Downtrend. The current action for the model is considered to be: Hold – Maintain Short Position.
| SUGAR Futures Statistics | SPECULATORS | COMMERCIALS | SMALL TRADERS |
| – Percent of Open Interest Longs: | 23.3 | 51.2 | 9.1 |
| – Percent of Open Interest Shorts: | 9.4 | 67.0 | 7.3 |
| – Net Position: | 117,461 | -133,030 | 15,569 |
| – Gross Longs: | 196,650 | 433,097 | 76,912 |
| – Gross Shorts: | 79,189 | 566,127 | 61,343 |
| – Long to Short Ratio: | 2.5 to 1 | 0.8 to 1 | 1.3 to 1 |
| NET POSITION TREND: | | | |
| – Strength Index Score (3 Year Range Pct): | 33.1 | 68.7 | 25.3 |
| – Strength Index Reading (3 Year Range): | Bearish | Bullish | Bearish |
| NET POSITION MOVEMENT INDEX: | | | |
| – 6-Week Change in Strength Index: | 9.3 | -10.8 | 14.2 |
COFFEE Futures:
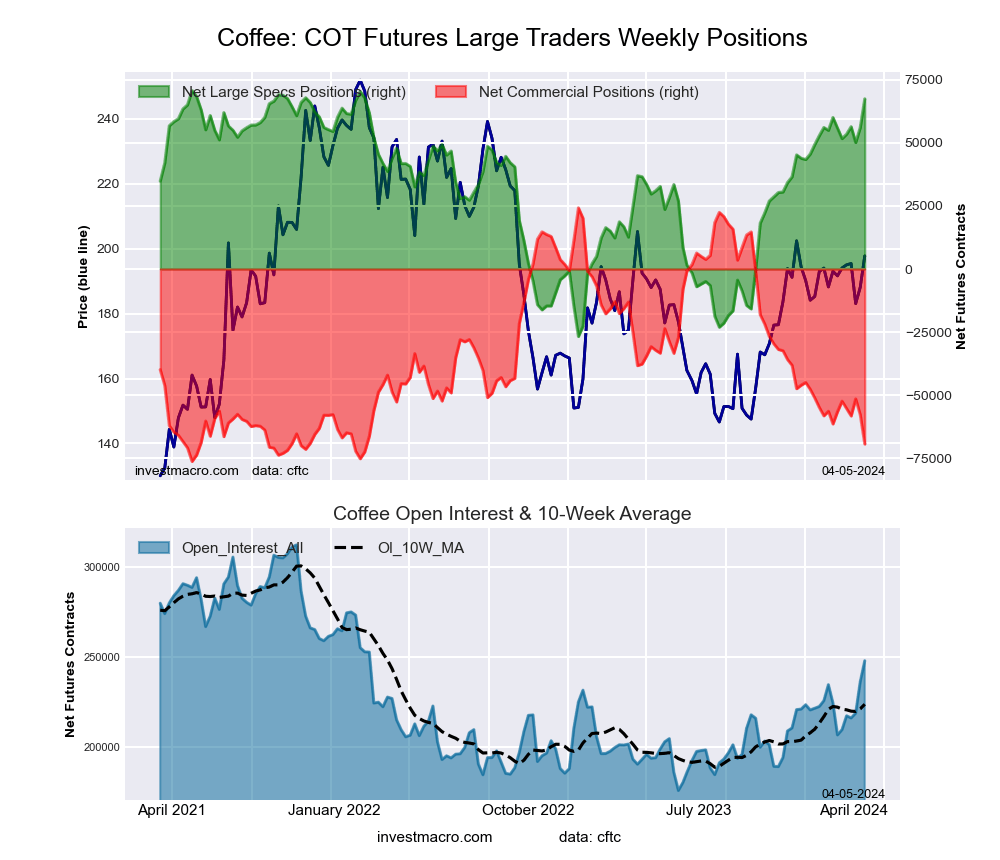 The COFFEE large speculator standing this week totaled a net position of 67,482 contracts in the data reported through Tuesday. This was a weekly increase of 11,447 contracts from the previous week which had a total of 56,035 net contracts.
This week’s current strength score (the trader positioning range over the past three years, measured from 0 to 100) shows the speculators are currently Bullish-Extreme with a score of 96.6 percent. The commercials are Bearish-Extreme with a score of 6.9 percent and the small traders (not shown in chart) are Bearish with a score of 40.0 percent.
Price Trend-Following Model: Strong Uptrend
Our weekly trend-following model classifies the current market price position as: Strong Uptrend. The current action for the model is considered to be: Hold – Maintain Long Position.
| COFFEE Futures Statistics | SPECULATORS | COMMERCIALS | SMALL TRADERS |
| – Percent of Open Interest Longs: | 36.4 | 35.0 | 3.6 |
| – Percent of Open Interest Shorts: | 9.2 | 63.0 | 2.8 |
| – Net Position: | 67,482 | -69,399 | 1,917 |
| – Gross Longs: | 90,293 | 86,645 | 8,823 |
| – Gross Shorts: | 22,811 | 156,044 | 6,906 |
| – Long to Short Ratio: | 4.0 to 1 | 0.6 to 1 | 1.3 to 1 |
| NET POSITION TREND: | | | |
| – Strength Index Score (3 Year Range Pct): | 96.6 | 6.9 | 40.0 |
| – Strength Index Reading (3 Year Range): | Bullish-Extreme | Bearish-Extreme | Bearish |
| NET POSITION MOVEMENT INDEX: | | | |
| – 6-Week Change in Strength Index: | 11.9 | -12.7 | 16.0 |
SOYBEANS Futures:
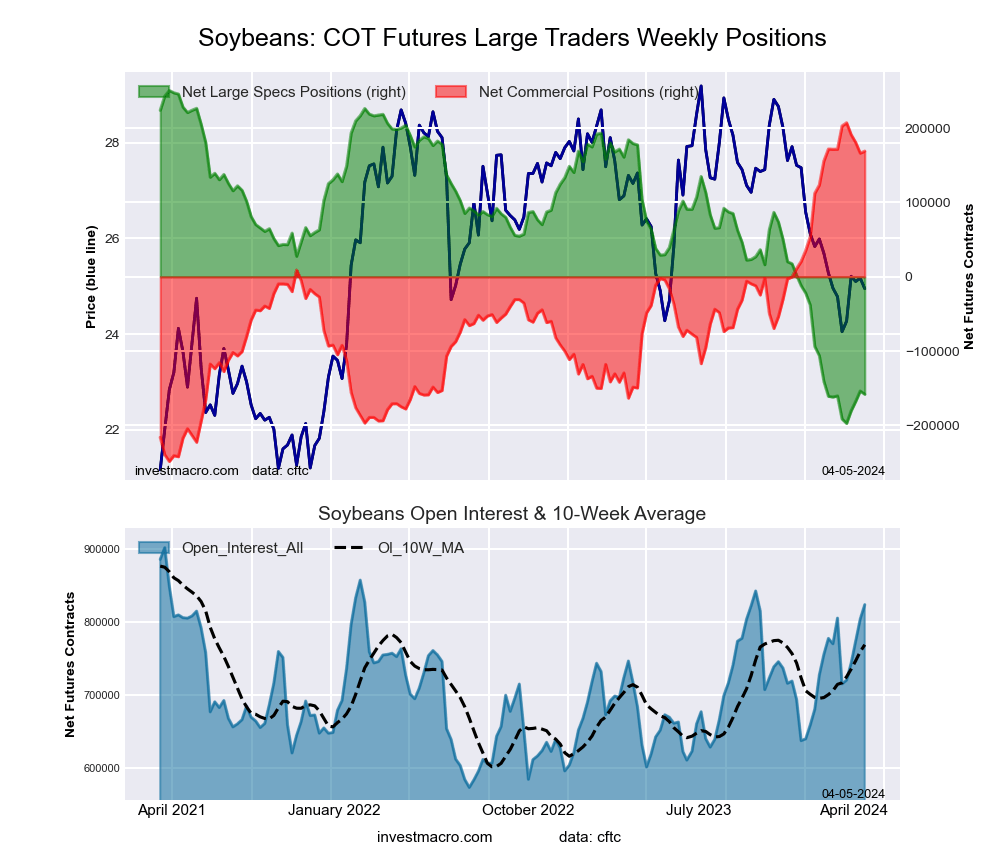 The SOYBEANS large speculator standing this week totaled a net position of -158,040 contracts in the data reported through Tuesday. This was a weekly decline of -4,326 contracts from the previous week which had a total of -153,714 net contracts.
This week’s current strength score (the trader positioning range over the past three years, measured from 0 to 100) shows the speculators are currently Bearish-Extreme with a score of 8.8 percent. The commercials are Bullish-Extreme with a score of 91.6 percent and the small traders (not shown in chart) are Bullish with a score of 78.2 percent.
Price Trend-Following Model: Downtrend
Our weekly trend-following model classifies the current market price position as: Downtrend. The current action for the model is considered to be: Hold – Maintain Short Position.
| SOYBEANS Futures Statistics | SPECULATORS | COMMERCIALS | SMALL TRADERS |
| – Percent of Open Interest Longs: | 11.6 | 60.4 | 6.4 |
| – Percent of Open Interest Shorts: | 30.8 | 39.8 | 7.7 |
| – Net Position: | -158,040 | 169,140 | -11,100 |
| – Gross Longs: | 95,389 | 496,933 | 52,452 |
| – Gross Shorts: | 253,429 | 327,793 | 63,552 |
| – Long to Short Ratio: | 0.4 to 1 | 1.5 to 1 | 0.8 to 1 |
| NET POSITION TREND: | | | |
| – Strength Index Score (3 Year Range Pct): | 8.8 | 91.6 | 78.2 |
| – Strength Index Reading (3 Year Range): | Bearish-Extreme | Bullish-Extreme | Bullish |
| NET POSITION MOVEMENT INDEX: | | | |
| – 6-Week Change in Strength Index: | 0.5 | -0.6 | 0.9 |
SOYBEAN OIL Futures:
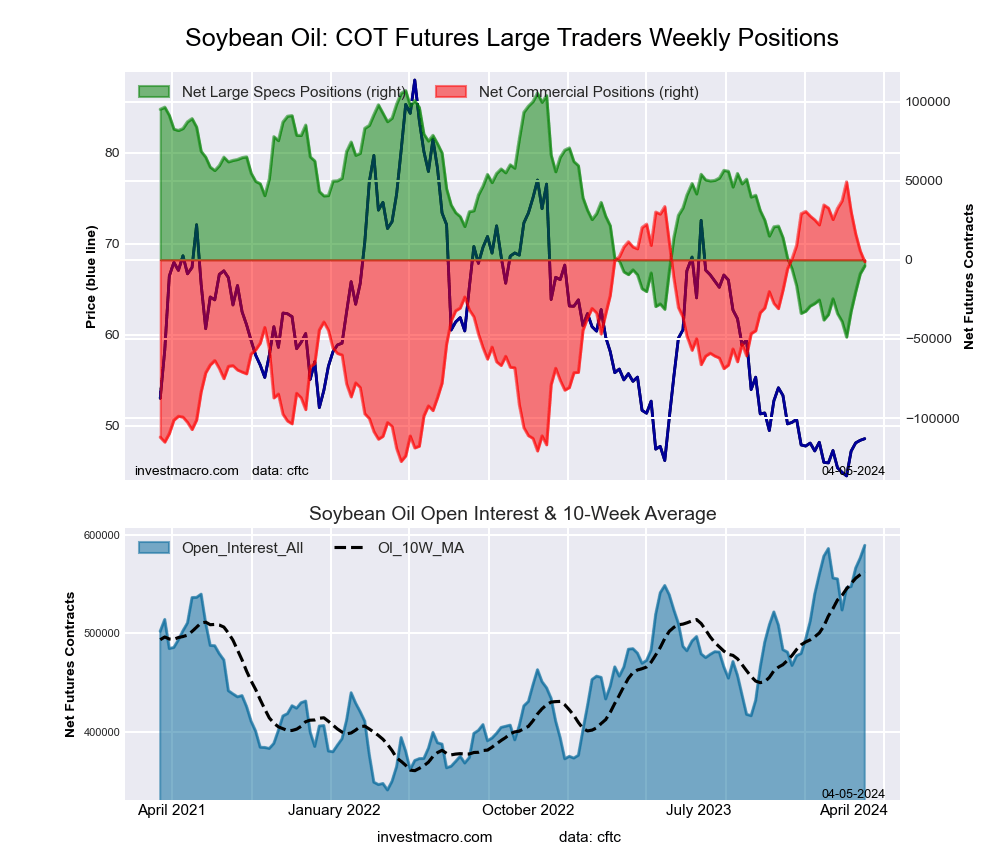 The SOYBEAN OIL large speculator standing this week totaled a net position of -3,857 contracts in the data reported through Tuesday. This was a weekly gain of 4,994 contracts from the previous week which had a total of -8,851 net contracts.
This week’s current strength score (the trader positioning range over the past three years, measured from 0 to 100) shows the speculators are currently Bearish with a score of 28.9 percent. The commercials are Bullish with a score of 71.4 percent and the small traders (not shown in chart) are Bearish with a score of 33.8 percent.
Price Trend-Following Model: Weak Downtrend
Our weekly trend-following model classifies the current market price position as: Weak Downtrend. The current action for the model is considered to be: Hold – Maintain Short Position.
| SOYBEAN OIL Futures Statistics | SPECULATORS | COMMERCIALS | SMALL TRADERS |
| – Percent of Open Interest Longs: | 19.9 | 44.6 | 5.2 |
| – Percent of Open Interest Shorts: | 20.5 | 44.8 | 4.4 |
| – Net Position: | -3,857 | -1,239 | 5,096 |
| – Gross Longs: | 117,212 | 262,783 | 30,930 |
| – Gross Shorts: | 121,069 | 264,022 | 25,834 |
| – Long to Short Ratio: | 1.0 to 1 | 1.0 to 1 | 1.2 to 1 |
| NET POSITION TREND: | | | |
| – Strength Index Score (3 Year Range Pct): | 28.9 | 71.4 | 33.8 |
| – Strength Index Reading (3 Year Range): | Bearish | Bullish | Bearish |
| NET POSITION MOVEMENT INDEX: | | | |
| – 6-Week Change in Strength Index: | 19.3 | -19.1 | 14.3 |
SOYBEAN MEAL Futures:
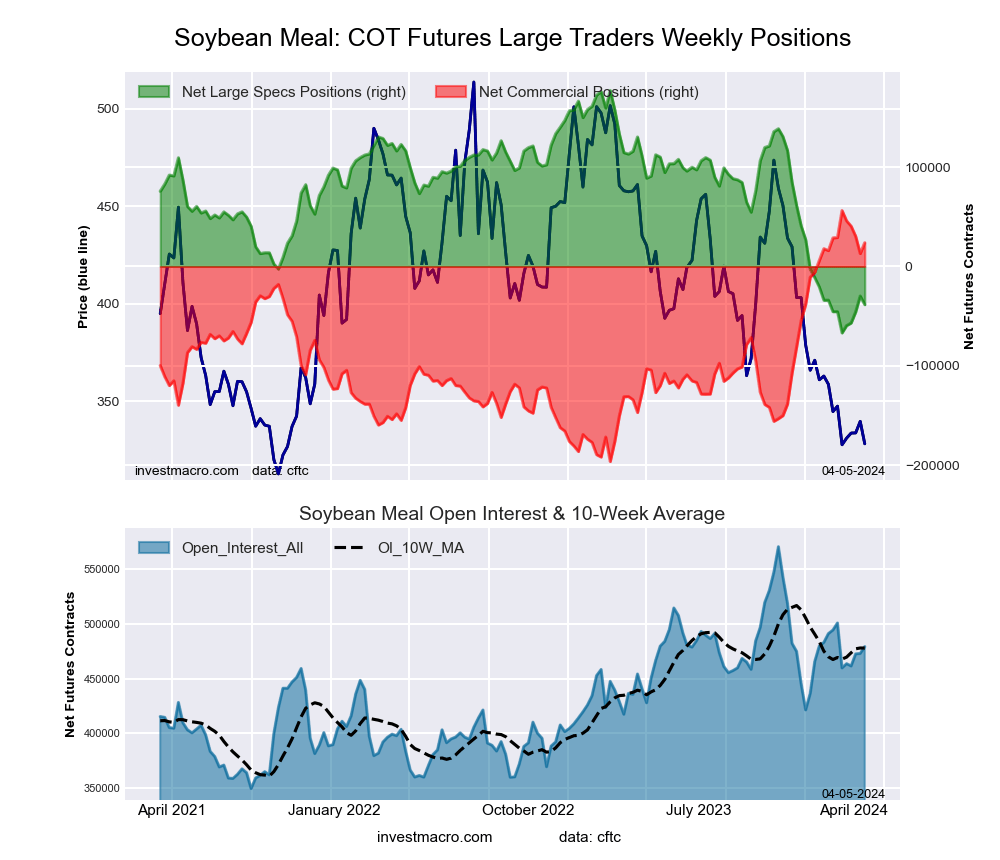 The SOYBEAN MEAL large speculator standing this week totaled a net position of -38,437 contracts in the data reported through Tuesday. This was a weekly lowering of -8,692 contracts from the previous week which had a total of -29,745 net contracts.
This week’s current strength score (the trader positioning range over the past three years, measured from 0 to 100) shows the speculators are currently Bearish-Extreme with a score of 11.6 percent. The commercials are Bullish-Extreme with a score of 87.2 percent and the small traders (not shown in chart) are Bearish with a score of 20.8 percent.
Price Trend-Following Model: Downtrend
Our weekly trend-following model classifies the current market price position as: Downtrend. The current action for the model is considered to be: Hold – Maintain Short Position.
| SOYBEAN MEAL Futures Statistics | SPECULATORS | COMMERCIALS | SMALL TRADERS |
| – Percent of Open Interest Longs: | 19.4 | 49.2 | 9.7 |
| – Percent of Open Interest Shorts: | 27.4 | 44.2 | 6.7 |
| – Net Position: | -38,437 | 23,944 | 14,493 |
| – Gross Longs: | 92,955 | 235,819 | 46,577 |
| – Gross Shorts: | 131,392 | 211,875 | 32,084 |
| – Long to Short Ratio: | 0.7 to 1 | 1.1 to 1 | 1.5 to 1 |
| NET POSITION TREND: | | | |
| – Strength Index Score (3 Year Range Pct): | 11.6 | 87.2 | 20.8 |
| – Strength Index Reading (3 Year Range): | Bearish-Extreme | Bullish-Extreme | Bearish |
| NET POSITION MOVEMENT INDEX: | | | |
| – 6-Week Change in Strength Index: | 2.9 | -2.1 | -8.2 |
LIVE CATTLE Futures:
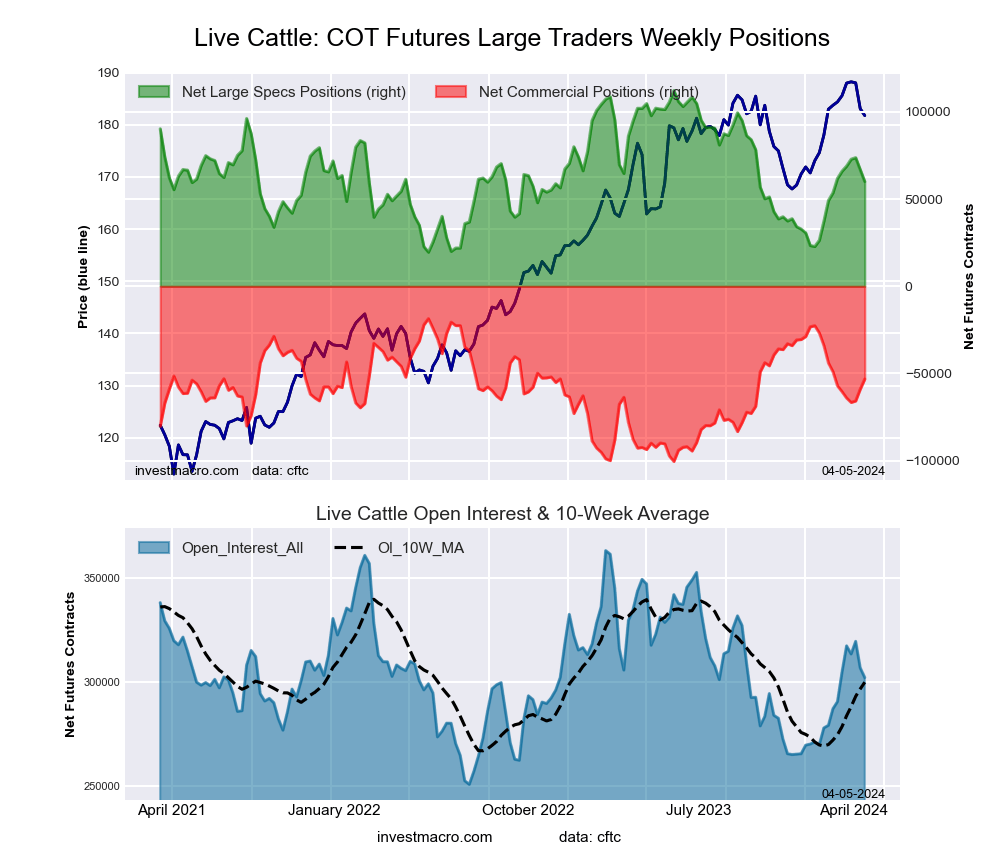 The LIVE CATTLE large speculator standing this week totaled a net position of 60,056 contracts in the data reported through Tuesday. This was a weekly lowering of -6,854 contracts from the previous week which had a total of 66,910 net contracts.
This week’s current strength score (the trader positioning range over the past three years, measured from 0 to 100) shows the speculators are currently Bearish with a score of 43.7 percent. The commercials are Bullish with a score of 57.7 percent and the small traders (not shown in chart) are Bullish with a score of 53.3 percent.
Price Trend-Following Model: Uptrend
Our weekly trend-following model classifies the current market price position as: Uptrend. The current action for the model is considered to be: Hold – Maintain Long Position.
| LIVE CATTLE Futures Statistics | SPECULATORS | COMMERCIALS | SMALL TRADERS |
| – Percent of Open Interest Longs: | 38.2 | 34.4 | 9.4 |
| – Percent of Open Interest Shorts: | 18.3 | 52.1 | 11.7 |
| – Net Position: | 60,056 | -53,210 | -6,846 |
| – Gross Longs: | 115,438 | 104,081 | 28,519 |
| – Gross Shorts: | 55,382 | 157,291 | 35,365 |
| – Long to Short Ratio: | 2.1 to 1 | 0.7 to 1 | 0.8 to 1 |
| NET POSITION TREND: | | | |
| – Strength Index Score (3 Year Range Pct): | 43.7 | 57.7 | 53.3 |
| – Strength Index Reading (3 Year Range): | Bearish | Bullish | Bullish |
| NET POSITION MOVEMENT INDEX: | | | |
| – 6-Week Change in Strength Index: | -2.0 | 4.8 | -11.1 |
LEAN HOGS Futures:
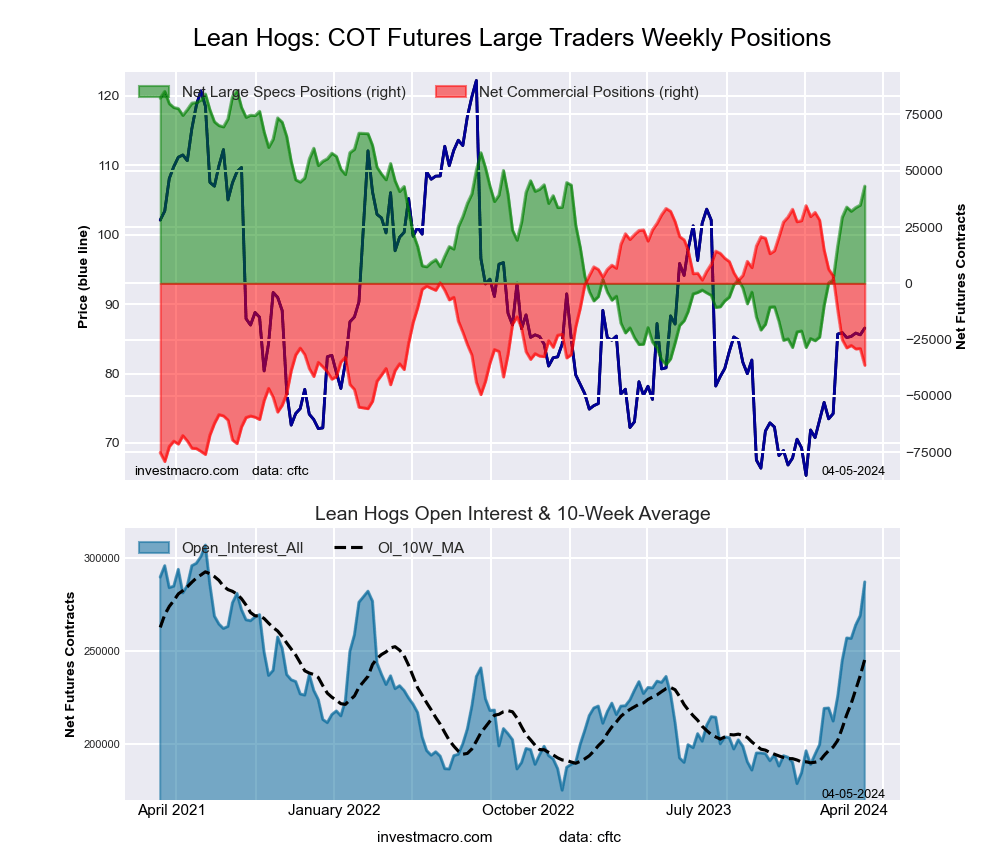 The LEAN HOGS large speculator standing this week totaled a net position of 43,135 contracts in the data reported through Tuesday. This was a weekly boost of 8,408 contracts from the previous week which had a total of 34,727 net contracts.
This week’s current strength score (the trader positioning range over the past three years, measured from 0 to 100) shows the speculators are currently Bullish with a score of 65.1 percent. The commercials are Bearish with a score of 37.6 percent and the small traders (not shown in chart) are Bullish with a score of 53.0 percent.
Price Trend-Following Model: Uptrend
Our weekly trend-following model classifies the current market price position as: Uptrend. The current action for the model is considered to be: Hold – Maintain Long Position.
| LEAN HOGS Futures Statistics | SPECULATORS | COMMERCIALS | SMALL TRADERS |
| – Percent of Open Interest Longs: | 37.2 | 34.2 | 8.2 |
| – Percent of Open Interest Shorts: | 22.2 | 46.9 | 10.5 |
| – Net Position: | 43,135 | -36,362 | -6,773 |
| – Gross Longs: | 106,839 | 98,353 | 23,519 |
| – Gross Shorts: | 63,704 | 134,715 | 30,292 |
| – Long to Short Ratio: | 1.7 to 1 | 0.7 to 1 | 0.8 to 1 |
| NET POSITION TREND: | | | |
| – Strength Index Score (3 Year Range Pct): | 65.1 | 37.6 | 53.0 |
| – Strength Index Reading (3 Year Range): | Bullish | Bearish | Bullish |
| NET POSITION MOVEMENT INDEX: | | | |
| – 6-Week Change in Strength Index: | 21.9 | -21.8 | -8.4 |
COTTON Futures:
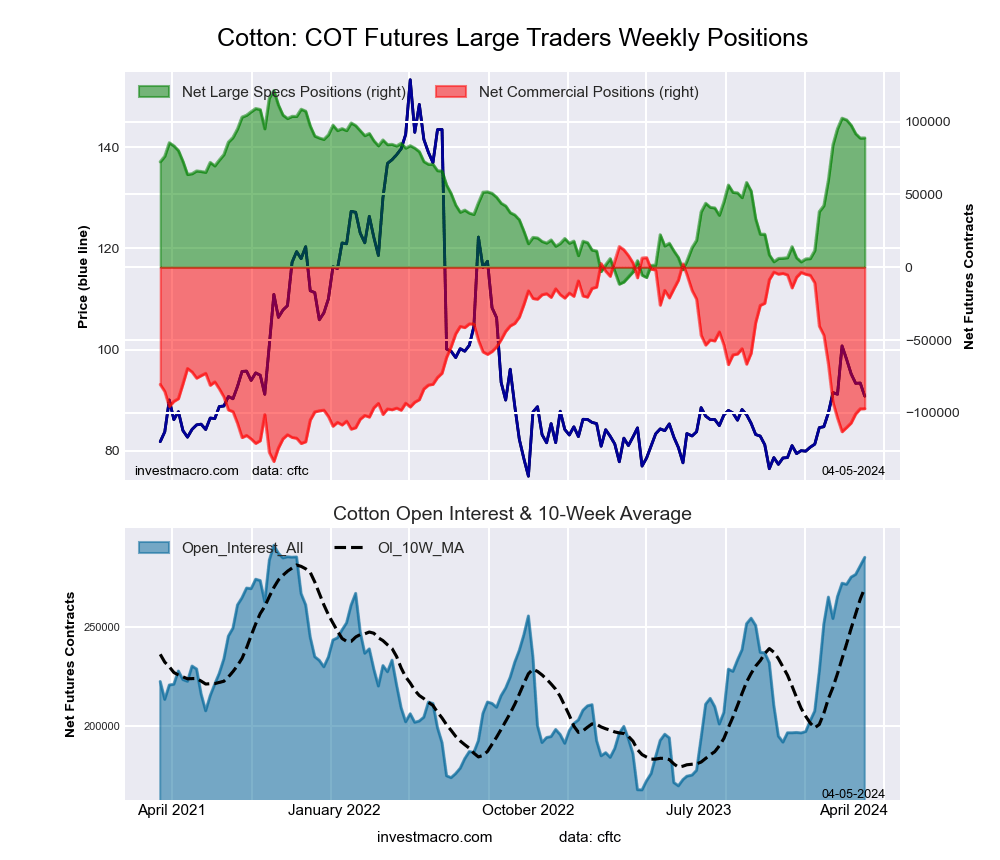 The COTTON large speculator standing this week totaled a net position of 88,765 contracts in the data reported through Tuesday. This was a weekly gain of 126 contracts from the previous week which had a total of 88,639 net contracts.
This week’s current strength score (the trader positioning range over the past three years, measured from 0 to 100) shows the speculators are currently Bullish with a score of 75.5 percent. The commercials are Bearish with a score of 24.6 percent and the small traders (not shown in chart) are Bullish with a score of 66.3 percent.
Price Trend-Following Model: Uptrend
Our weekly trend-following model classifies the current market price position as: Uptrend. The current action for the model is considered to be: Hold – Maintain Long Position.
| COTTON Futures Statistics | SPECULATORS | COMMERCIALS | SMALL TRADERS |
| – Percent of Open Interest Longs: | 42.1 | 36.9 | 6.5 |
| – Percent of Open Interest Shorts: | 10.9 | 71.0 | 3.5 |
| – Net Position: | 88,765 | -97,058 | 8,293 |
| – Gross Longs: | 119,875 | 105,058 | 18,390 |
| – Gross Shorts: | 31,110 | 202,116 | 10,097 |
| – Long to Short Ratio: | 3.9 to 1 | 0.5 to 1 | 1.8 to 1 |
| NET POSITION TREND: | | | |
| – Strength Index Score (3 Year Range Pct): | 75.5 | 24.6 | 66.3 |
| – Strength Index Reading (3 Year Range): | Bullish | Bearish | Bullish |
| NET POSITION MOVEMENT INDEX: | | | |
| – 6-Week Change in Strength Index: | -4.8 | 4.4 | -0.7 |
COCOA Futures:
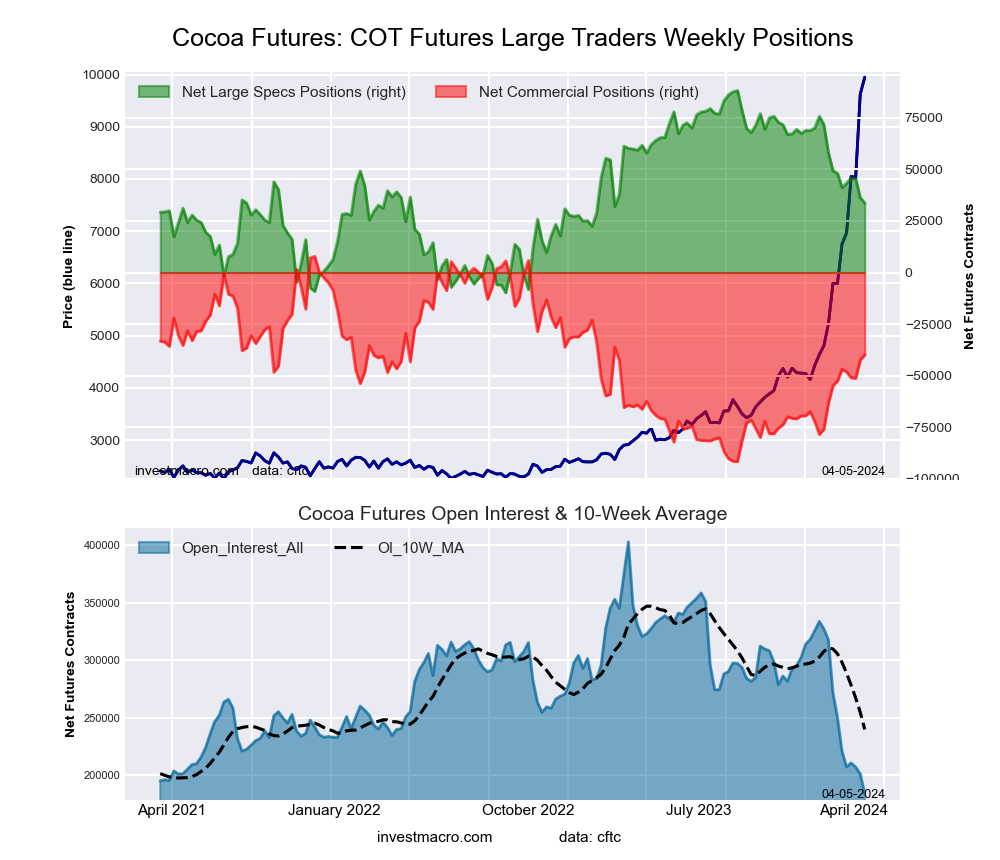 The COCOA large speculator standing this week totaled a net position of 33,671 contracts in the data reported through Tuesday. This was a weekly decline of -2,659 contracts from the previous week which had a total of 36,330 net contracts.
This week’s current strength score (the trader positioning range over the past three years, measured from 0 to 100) shows the speculators are currently Bearish with a score of 44.3 percent. The commercials are Bullish with a score of 52.0 percent and the small traders (not shown in chart) are Bullish with a score of 65.2 percent.
Price Trend-Following Model: Strong Uptrend
Our weekly trend-following model classifies the current market price position as: Strong Uptrend. The current action for the model is considered to be: Hold – Maintain Long Position.
| COCOA Futures Statistics | SPECULATORS | COMMERCIALS | SMALL TRADERS |
| – Percent of Open Interest Longs: | 32.4 | 35.0 | 8.0 |
| – Percent of Open Interest Shorts: | 14.1 | 56.7 | 4.6 |
| – Net Position: | 33,671 | -39,902 | 6,231 |
| – Gross Longs: | 59,653 | 64,498 | 14,675 |
| – Gross Shorts: | 25,982 | 104,400 | 8,444 |
| – Long to Short Ratio: | 2.3 to 1 | 0.6 to 1 | 1.7 to 1 |
| NET POSITION TREND: | | | |
| – Strength Index Score (3 Year Range Pct): | 44.3 | 52.0 | 65.2 |
| – Strength Index Reading (3 Year Range): | Bearish | Bullish | Bullish |
| NET POSITION MOVEMENT INDEX: | | | |
| – 6-Week Change in Strength Index: | -14.7 | 12.8 | 14.9 |
WHEAT Futures:
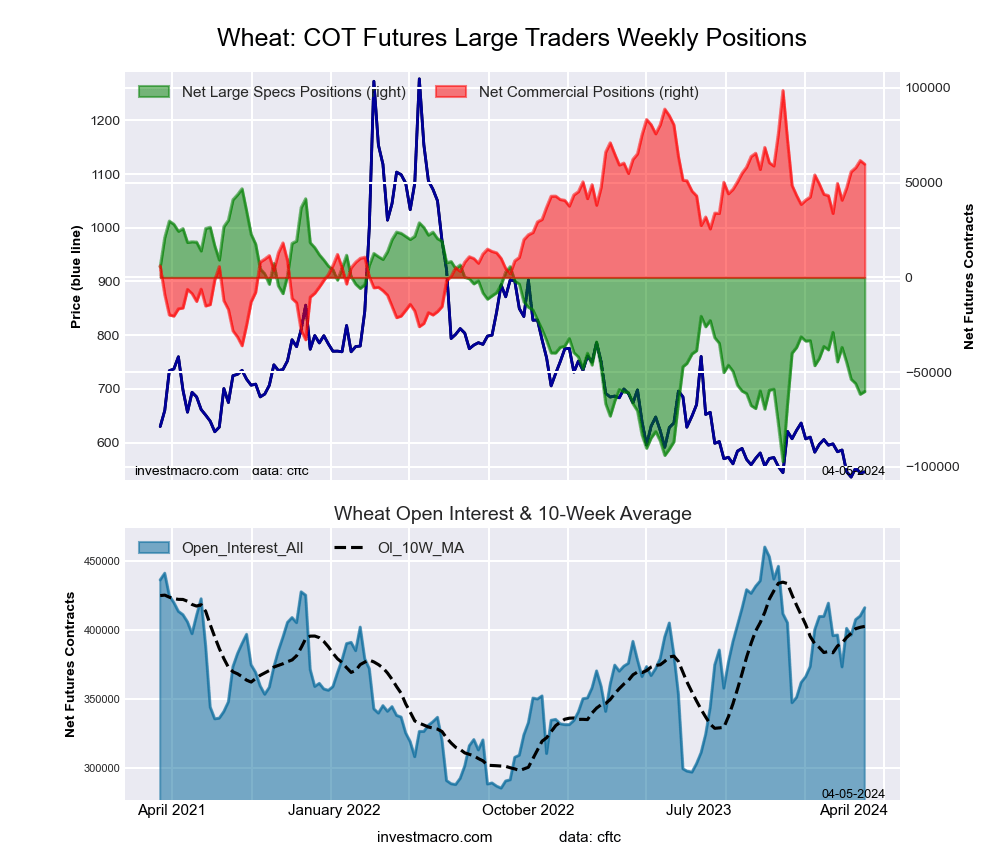 The WHEAT large speculator standing this week totaled a net position of -60,257 contracts in the data reported through Tuesday. This was a weekly rise of 1,465 contracts from the previous week which had a total of -61,722 net contracts.
This week’s current strength score (the trader positioning range over the past three years, measured from 0 to 100) shows the speculators are currently Bearish with a score of 25.7 percent. The commercials are Bullish with a score of 71.1 percent and the small traders (not shown in chart) are Bullish with a score of 68.3 percent.
Price Trend-Following Model: Downtrend
Our weekly trend-following model classifies the current market price position as: Downtrend. The current action for the model is considered to be: Hold – Maintain Short Position.
| WHEAT Futures Statistics | SPECULATORS | COMMERCIALS | SMALL TRADERS |
| – Percent of Open Interest Longs: | 28.7 | 35.4 | 7.8 |
| – Percent of Open Interest Shorts: | 43.2 | 21.1 | 7.7 |
| – Net Position: | -60,257 | 59,755 | 502 |
| – Gross Longs: | 119,394 | 147,382 | 32,581 |
| – Gross Shorts: | 179,651 | 87,627 | 32,079 |
| – Long to Short Ratio: | 0.7 to 1 | 1.7 to 1 | 1.0 to 1 |
| NET POSITION TREND: | | | |
| – Strength Index Score (3 Year Range Pct): | 25.7 | 71.1 | 68.3 |
| – Strength Index Reading (3 Year Range): | Bearish | Bullish | Bullish |
| NET POSITION MOVEMENT INDEX: | | | |
| – 6-Week Change in Strength Index: | -10.8 | 7.5 | 23.7 |
Article By InvestMacro – Receive our weekly COT Newsletter
*COT Report: The COT data, released weekly to the public each Friday, is updated through the most recent Tuesday (data is 3 days old) and shows a quick view of how large speculators or non-commercials (for-profit traders) were positioned in the futures markets.
The CFTC categorizes trader positions according to commercial hedgers (traders who use futures contracts for hedging as part of the business), non-commercials (large traders who speculate to realize trading profits) and nonreportable traders (usually small traders/speculators) as well as their open interest (contracts open in the market at time of reporting). See CFTC criteria here.