By InvestMacro
Here are the latest charts and statistics for the Commitment of Traders (COT) data published by the Commodities Futures Trading Commission (CFTC).
The latest COT data is updated through Tuesday July 9th and shows a quick view of how large traders (for-profit speculators and commercial entities) were positioned in the futures markets.
Weekly Speculator Changes led by Gold, Copper & Silver
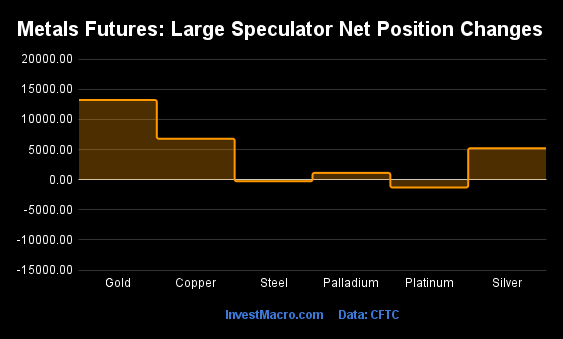
The COT metals markets speculator bets were overall higher this week as four out of the six metals markets we cover had higher positioning while the other two markets had lower speculator contracts.
Leading the gains for the metals was Gold (13,232 contracts) with Copper (6,808 contracts), Silver (5,222 contracts) and Palladium (1,128 contracts) also recording positive weeks.
The markets with declines in speculator bets for the week were Platinum (-1,290 contracts) and Steel (-265 contracts).
Metals Net Speculators Leaderboard
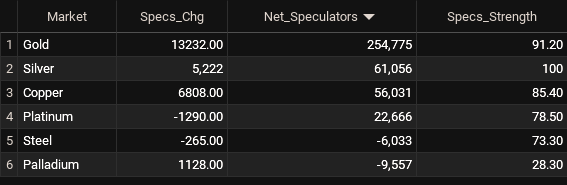
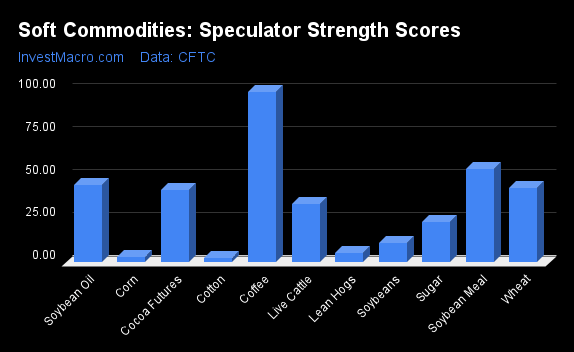
Legend: Weekly Speculators Change | Speculators Current Net Position | Speculators Strength Score compared to last 3-Years (0-100 range)
Strength Scores led by Silver & Gold
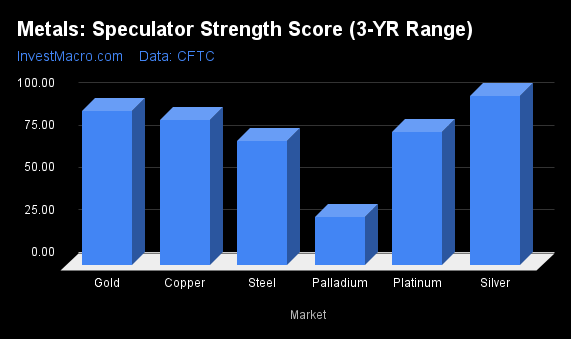
COT Strength Scores (a normalized measure of Speculator positions over a 3-Year range, from 0 to 100 where above 80 is Extreme-Bullish and below 20 is Extreme-Bearish) showed that Silver (100 percent) and Gold (91 percent) lead the metals markets this week. Copper (85 percent), Platinum (79 percent) and Steel (73 percent) come in as the next highest in the weekly strength scores.
On the downside, Palladium (28 percent) comes in at the lowest strength level currently.
Strength Statistics:
Gold (91.2 percent) vs Gold previous week (85.2 percent)
Silver (100.0 percent) vs Silver previous week (92.9 percent)
Copper (85.4 percent) vs Copper previous week (79.1 percent)
Platinum (78.5 percent) vs Platinum previous week (82.0 percent)
Palladium (28.3 percent) vs Palladium previous week (20.9 percent)
Steel (73.3 percent) vs Palladium previous week (74.3 percent)
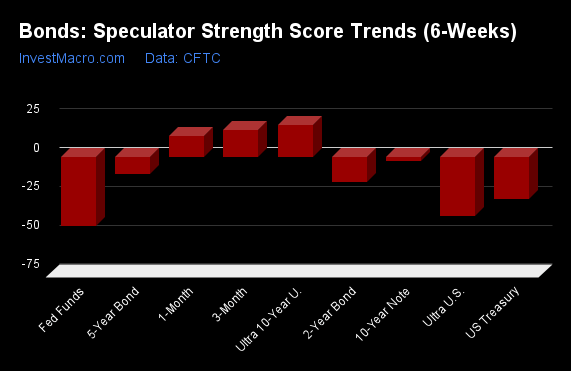
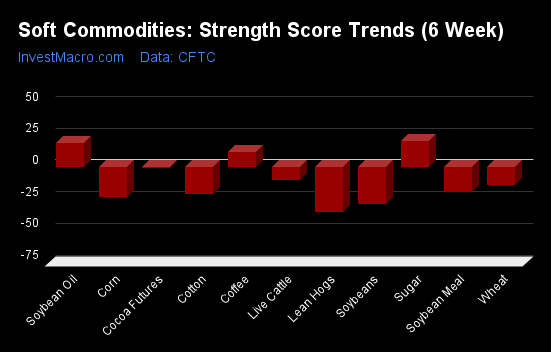
Palladium & Gold top the 6-Week Strength Trends
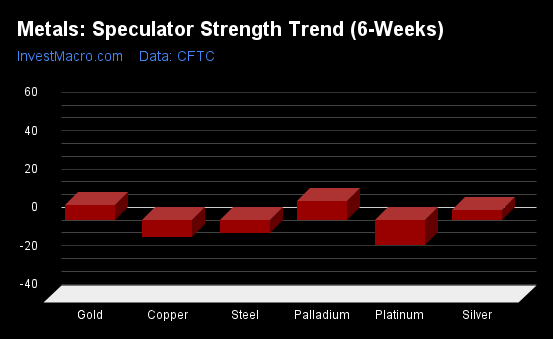
COT Strength Score Trends (or move index, calculates the 6-week changes in strength scores) showed that Palladium (10 percent) and Gold (8 percent) lead the past six weeks trends for metals.
Platinum (-13 percent), Copper (-9 percent) and Steel (-7 percent) leads the downside trend scores currently.
Move Statistics:
Gold (8.2 percent) vs Gold previous week (5.3 percent)
Silver (5.2 percent) vs Silver previous week (-5.2 percent)
Copper (-8.8 percent) vs Copper previous week (-20.9 percent)
Platinum (-13.1 percent) vs Platinum previous week (-9.9 percent)
Palladium (9.9 percent) vs Palladium previous week (-1.7 percent)
Steel (-6.5 percent) vs Steel previous week (-6.7 percent)
Individual Markets:
Gold Comex Futures:
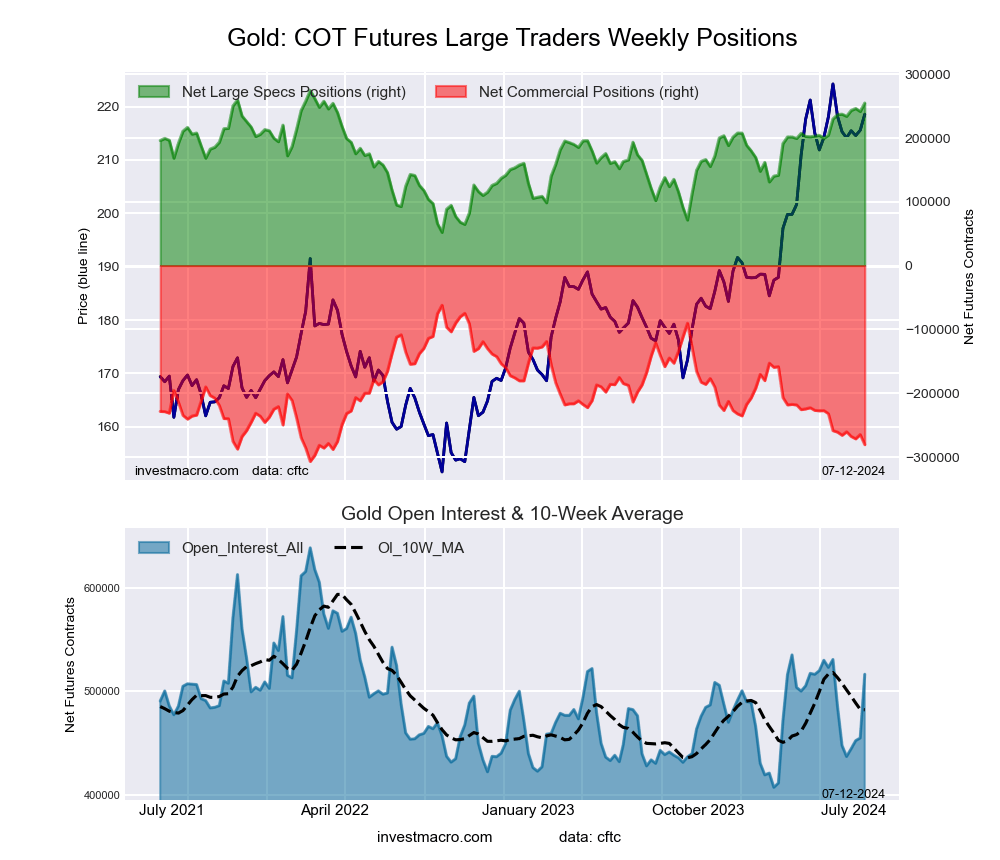 The Gold Comex Futures large speculator standing this week reached a net position of 254,775 contracts in the data reported through Tuesday. This was a weekly lift of 13,232 contracts from the previous week which had a total of 241,543 net contracts.
This week’s current strength score (the trader positioning range over the past three years, measured from 0 to 100) shows the speculators are currently Bullish-Extreme with a score of 91.2 percent. The commercials are Bearish-Extreme with a score of 10.8 percent and the small traders (not shown in chart) are Bullish with a score of 64.2 percent.
Price Trend-Following Model: Uptrend
Our weekly trend-following model classifies the current market price position as: Uptrend. The current action for the model is considered to be: Hold – Maintain Long Position.
| Gold Futures Statistics | SPECULATORS | COMMERCIALS | SMALL TRADERS |
| – Percent of Open Interest Longs: | 58.7 | 18.0 | 9.8 |
| – Percent of Open Interest Shorts: | 9.3 | 72.3 | 4.8 |
| – Net Position: | 254,775 | -280,629 | 25,854 |
| – Gross Longs: | 303,043 | 92,907 | 50,623 |
| – Gross Shorts: | 48,268 | 373,536 | 24,769 |
| – Long to Short Ratio: | 6.3 to 1 | 0.2 to 1 | 2.0 to 1 |
| NET POSITION TREND: | |||
| – Strength Index Score (3 Year Range Pct): | 91.2 | 10.8 | 64.2 |
| – Strength Index Reading (3 Year Range): | Bullish-Extreme | Bearish-Extreme | Bullish |
| NET POSITION MOVEMENT INDEX: | |||
| – 6-Week Change in Strength Index: | 8.2 | -8.0 | 5.4 |
Silver Comex Futures:
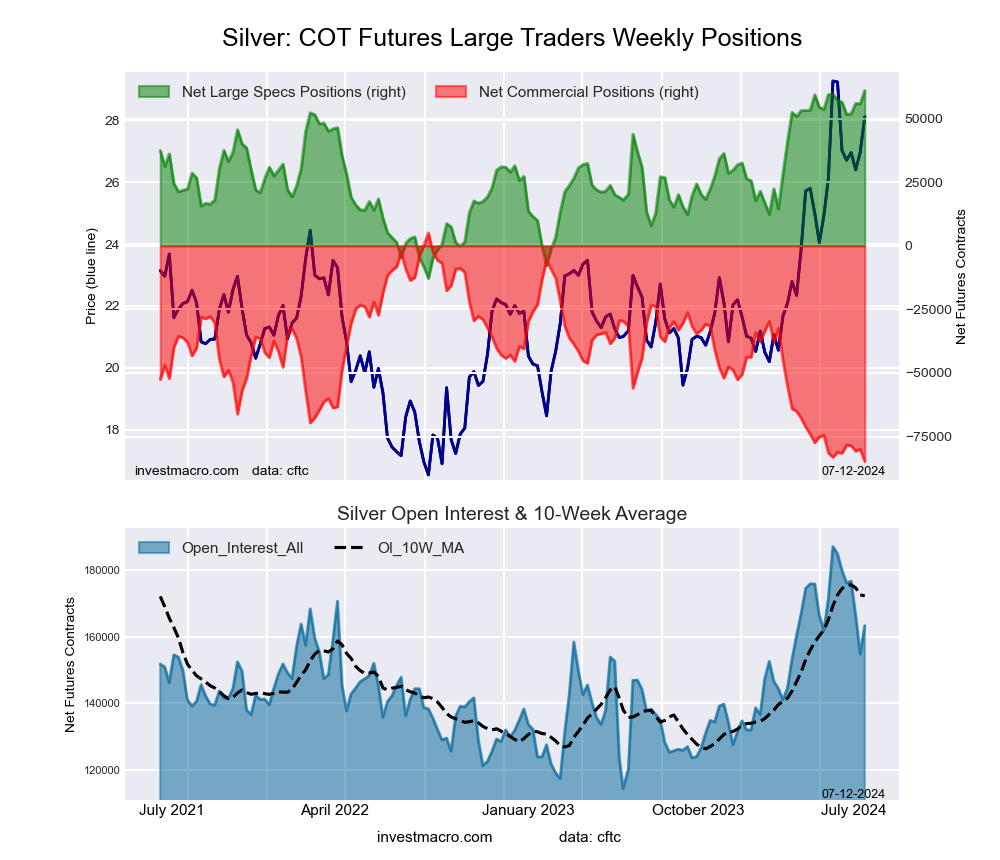 The Silver Comex Futures large speculator standing this week reached a net position of 61,056 contracts in the data reported through Tuesday. This was a weekly boost of 5,222 contracts from the previous week which had a total of 55,834 net contracts.
This week’s current strength score (the trader positioning range over the past three years, measured from 0 to 100) shows the speculators are currently Bullish-Extreme with a score of 100.0 percent. The commercials are Bearish-Extreme with a score of 0.0 percent and the small traders (not shown in chart) are Bullish-Extreme with a score of 85.6 percent.
Price Trend-Following Model: Uptrend
Our weekly trend-following model classifies the current market price position as: Uptrend. The current action for the model is considered to be: Hold – Maintain Long Position.
| Silver Futures Statistics | SPECULATORS | COMMERCIALS | SMALL TRADERS |
| – Percent of Open Interest Longs: | 51.7 | 20.5 | 20.1 |
| – Percent of Open Interest Shorts: | 14.3 | 72.5 | 5.5 |
| – Net Position: | 61,056 | -84,790 | 23,734 |
| – Gross Longs: | 84,351 | 33,496 | 32,735 |
| – Gross Shorts: | 23,295 | 118,286 | 9,001 |
| – Long to Short Ratio: | 3.6 to 1 | 0.3 to 1 | 3.6 to 1 |
| NET POSITION TREND: | |||
| – Strength Index Score (3 Year Range Pct): | 100.0 | 0.0 | 85.6 |
| – Strength Index Reading (3 Year Range): | Bullish-Extreme | Bearish-Extreme | Bullish-Extreme |
| NET POSITION MOVEMENT INDEX: | |||
| – 6-Week Change in Strength Index: | 5.2 | -4.1 | -0.8 |
Copper Grade #1 Futures:
 The Copper Grade #1 Futures large speculator standing this week reached a net position of 56,031 contracts in the data reported through Tuesday. This was a weekly lift of 6,808 contracts from the previous week which had a total of 49,223 net contracts.
This week’s current strength score (the trader positioning range over the past three years, measured from 0 to 100) shows the speculators are currently Bullish-Extreme with a score of 85.4 percent. The commercials are Bearish-Extreme with a score of 12.2 percent and the small traders (not shown in chart) are Bullish-Extreme with a score of 87.5 percent.
Price Trend-Following Model: Uptrend
Our weekly trend-following model classifies the current market price position as: Uptrend. The current action for the model is considered to be: Hold – Maintain Long Position.
| Copper Futures Statistics | SPECULATORS | COMMERCIALS | SMALL TRADERS |
| – Percent of Open Interest Longs: | 53.5 | 23.8 | 8.3 |
| – Percent of Open Interest Shorts: | 32.3 | 49.4 | 3.9 |
| – Net Position: | 56,031 | -67,549 | 11,518 |
| – Gross Longs: | 141,237 | 62,868 | 21,924 |
| – Gross Shorts: | 85,206 | 130,417 | 10,406 |
| – Long to Short Ratio: | 1.7 to 1 | 0.5 to 1 | 2.1 to 1 |
| NET POSITION TREND: | |||
| – Strength Index Score (3 Year Range Pct): | 85.4 | 12.2 | 87.5 |
| – Strength Index Reading (3 Year Range): | Bullish-Extreme | Bearish-Extreme | Bullish-Extreme |
| NET POSITION MOVEMENT INDEX: | |||
| – 6-Week Change in Strength Index: | -8.8 | 7.9 | 1.7 |
Platinum Futures:
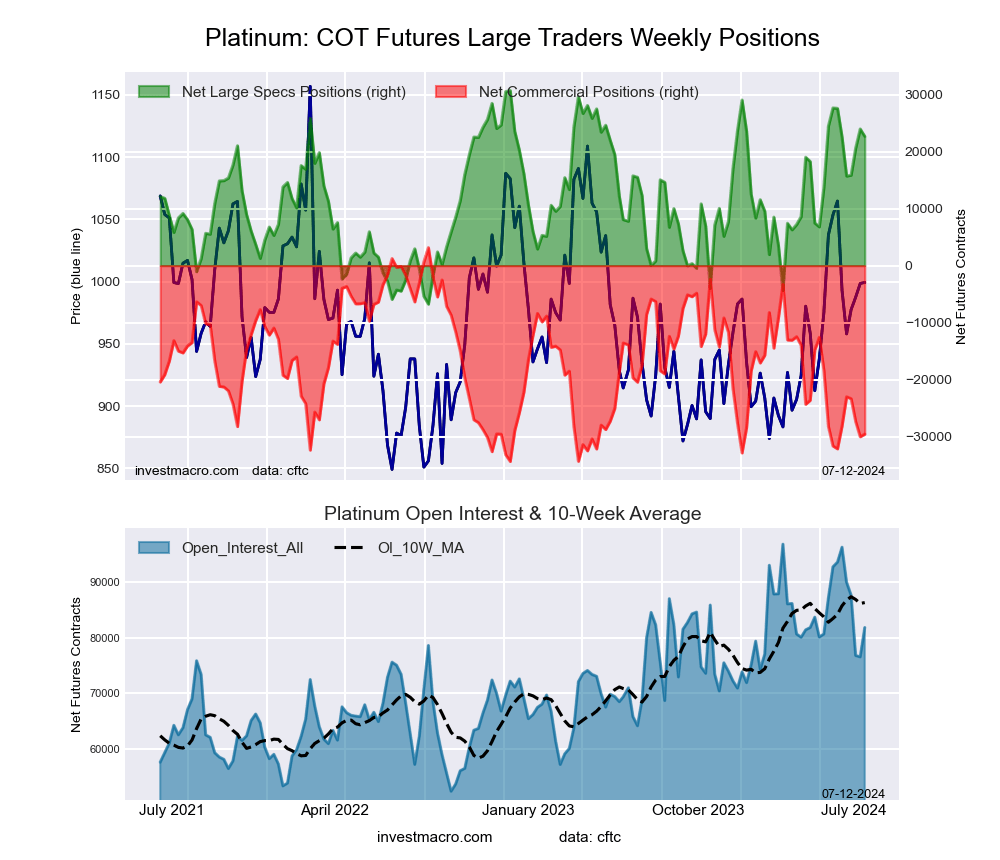 The Platinum Futures large speculator standing this week reached a net position of 22,666 contracts in the data reported through Tuesday. This was a weekly fall of -1,290 contracts from the previous week which had a total of 23,956 net contracts.
This week’s current strength score (the trader positioning range over the past three years, measured from 0 to 100) shows the speculators are currently Bullish with a score of 78.5 percent. The commercials are Bearish-Extreme with a score of 12.8 percent and the small traders (not shown in chart) are Bullish with a score of 76.4 percent.
Price Trend-Following Model: Uptrend
Our weekly trend-following model classifies the current market price position as: Uptrend. The current action for the model is considered to be: Hold – Maintain Long Position.
| Platinum Futures Statistics | SPECULATORS | COMMERCIALS | SMALL TRADERS |
| – Percent of Open Interest Longs: | 57.9 | 21.2 | 12.5 |
| – Percent of Open Interest Shorts: | 30.2 | 57.4 | 4.1 |
| – Net Position: | 22,666 | -29,563 | 6,897 |
| – Gross Longs: | 47,350 | 17,388 | 10,259 |
| – Gross Shorts: | 24,684 | 46,951 | 3,362 |
| – Long to Short Ratio: | 1.9 to 1 | 0.4 to 1 | 3.1 to 1 |
| NET POSITION TREND: | |||
| – Strength Index Score (3 Year Range Pct): | 78.5 | 12.8 | 76.4 |
| – Strength Index Reading (3 Year Range): | Bullish | Bearish-Extreme | Bullish |
| NET POSITION MOVEMENT INDEX: | |||
| – 6-Week Change in Strength Index: | -13.1 | 6.9 | 39.2 |
Palladium Futures:
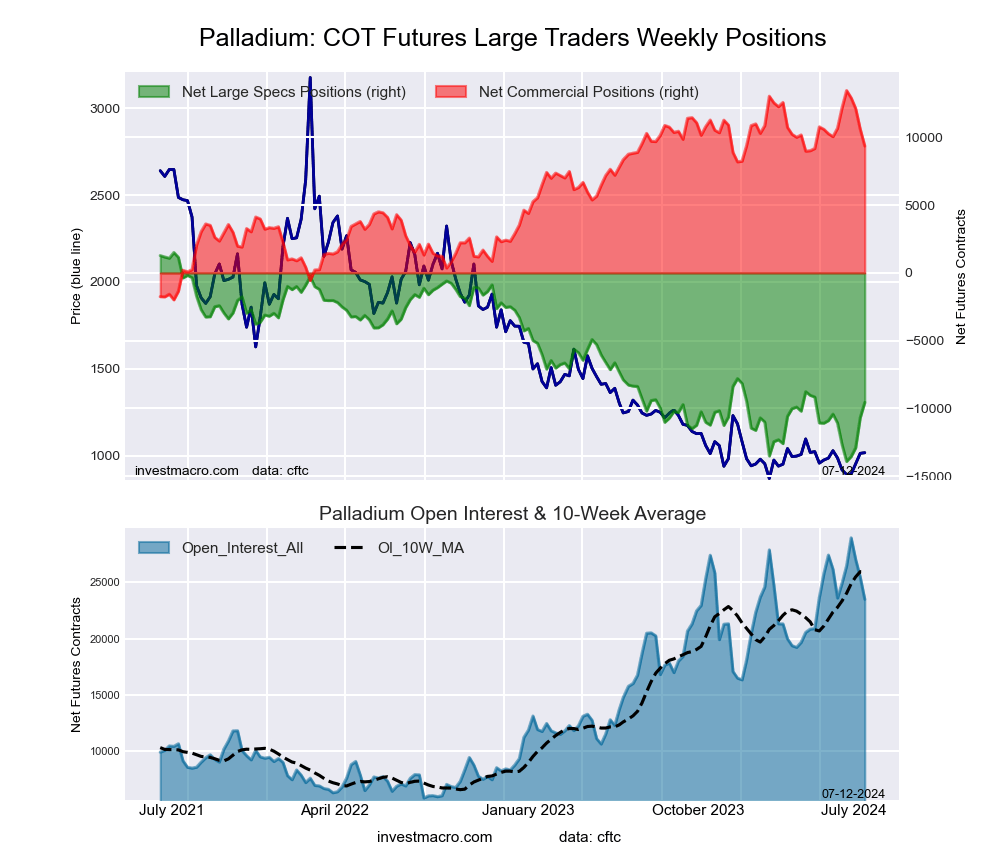 The Palladium Futures large speculator standing this week reached a net position of -9,557 contracts in the data reported through Tuesday. This was a weekly increase of 1,128 contracts from the previous week which had a total of -10,685 net contracts.
This week’s current strength score (the trader positioning range over the past three years, measured from 0 to 100) shows the speculators are currently Bearish with a score of 28.3 percent. The commercials are Bullish with a score of 73.5 percent and the small traders (not shown in chart) are Bullish with a score of 53.0 percent.
Price Trend-Following Model: Downtrend
Our weekly trend-following model classifies the current market price position as: Downtrend. The current action for the model is considered to be: Hold – Maintain Short Position.
| Palladium Futures Statistics | SPECULATORS | COMMERCIALS | SMALL TRADERS |
| – Percent of Open Interest Longs: | 25.3 | 54.8 | 7.6 |
| – Percent of Open Interest Shorts: | 66.0 | 14.8 | 6.8 |
| – Net Position: | -9,557 | 9,369 | 188 |
| – Gross Longs: | 5,946 | 12,854 | 1,783 |
| – Gross Shorts: | 15,503 | 3,485 | 1,595 |
| – Long to Short Ratio: | 0.4 to 1 | 3.7 to 1 | 1.1 to 1 |
| NET POSITION TREND: | |||
| – Strength Index Score (3 Year Range Pct): | 28.3 | 73.5 | 53.0 |
| – Strength Index Reading (3 Year Range): | Bearish | Bullish | Bullish |
| NET POSITION MOVEMENT INDEX: | |||
| – 6-Week Change in Strength Index: | 9.9 | -8.5 | -12.6 |
Steel Futures Futures:
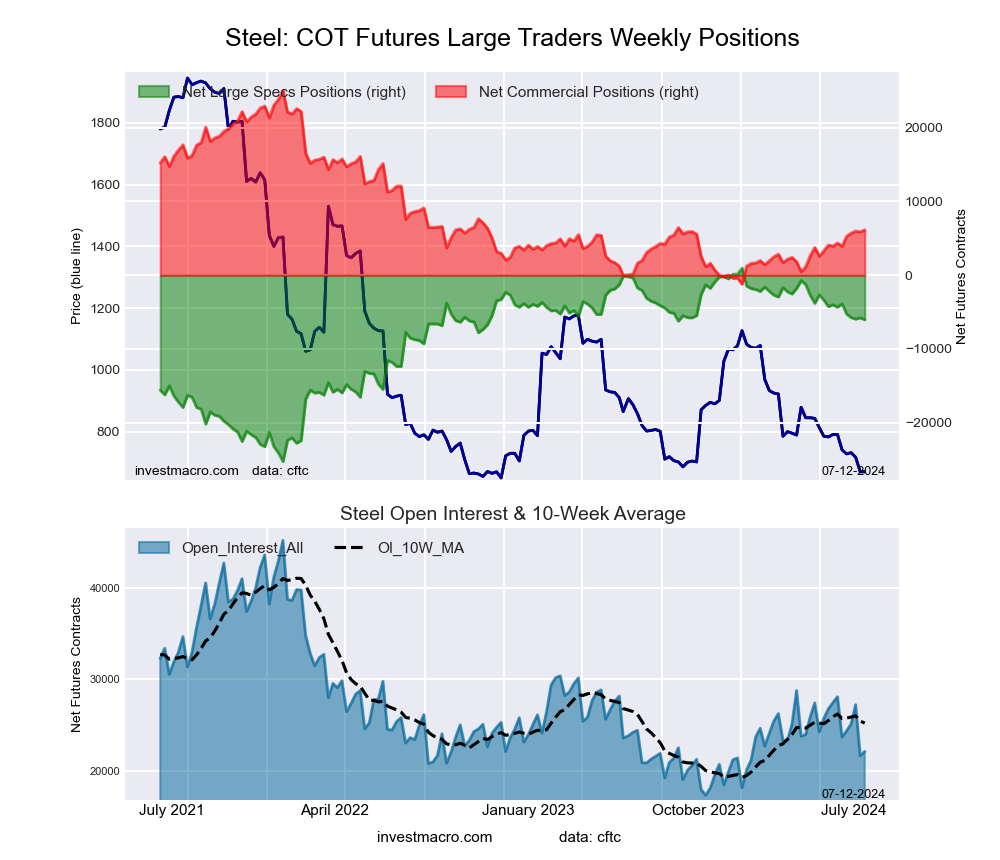 The Steel Futures large speculator standing this week reached a net position of -6,033 contracts in the data reported through Tuesday. This was a weekly lowering of -265 contracts from the previous week which had a total of -5,768 net contracts.
This week’s current strength score (the trader positioning range over the past three years, measured from 0 to 100) shows the speculators are currently Bullish with a score of 73.3 percent. The commercials are Bearish with a score of 28.0 percent and the small traders (not shown in chart) are Bearish with a score of 20.5 percent.
Price Trend-Following Model: Strong Downtrend
Our weekly trend-following model classifies the current market price position as: Strong Downtrend. The current action for the model is considered to be: Hold – Maintain Short Position.
| Steel Futures Statistics | SPECULATORS | COMMERCIALS | SMALL TRADERS |
| – Percent of Open Interest Longs: | 13.6 | 79.5 | 0.8 |
| – Percent of Open Interest Shorts: | 40.9 | 51.7 | 1.3 |
| – Net Position: | -6,033 | 6,142 | -109 |
| – Gross Longs: | 3,016 | 17,567 | 183 |
| – Gross Shorts: | 9,049 | 11,425 | 292 |
| – Long to Short Ratio: | 0.3 to 1 | 1.5 to 1 | 0.6 to 1 |
| NET POSITION TREND: | |||
| – Strength Index Score (3 Year Range Pct): | 73.3 | 28.0 | 20.5 |
| – Strength Index Reading (3 Year Range): | Bullish | Bearish | Bearish |
| NET POSITION MOVEMENT INDEX: | |||
| – 6-Week Change in Strength Index: | -6.5 | 6.8 | -8.5 |
Article By InvestMacro – Receive our weekly COT Newsletter
*COT Report: The COT data, released weekly to the public each Friday, is updated through the most recent Tuesday (data is 3 days old) and shows a quick view of how large speculators or non-commercials (for-profit traders) were positioned in the futures markets.
The CFTC categorizes trader positions according to commercial hedgers (traders who use futures contracts for hedging as part of the business), non-commercials (large traders who speculate to realize trading profits) and nonreportable traders (usually small traders/speculators) as well as their open interest (contracts open in the market at time of reporting). See CFTC criteria here.