By JustMarkets
At the end of Monday, the Dow Jones (US30) decreased by 0.12%, while the S&P 500 (US500) was up 0.08%. The NASDAQ Technology Index (US100) closed positive 0.07%. The broad market rose on Monday and extended last Friday’s rally on expectations of a Fed rate cut in September after the June Personal Consumption Expenditures Price Index, the Fed’s preferred gauge of inflation, declined as expected. Rising shares of chip companies also boosted the overall market on Monday after ON Semiconductor reported better-than-expected second-quarter earnings per share.
Stock investors will continue to pay attention to technology stocks as key earnings reports are due this week. This week, companies such as Microsoft (MSFT) will report on Tuesday, Meta (META) on Wednesday, and Apple (AAPL) and Amazon (AMZN) on Thursday.
The US economic news on Monday was weaker than expected and negatively impacted stocks after the Dallas Fed’s survey of overall manufacturing activity unexpectedly fell by 2.4 to 17.5, weaker than expectations for a rise to 14.2.
The major central banks will meet this week to decide on monetary policy. The Bank of Japan (BoJ) is expected to unveil details of plans to reduce monthly bond purchases after a two-day meeting on Wednesday and possibly signal it will start raising interest rates at its September meeting. The US Federal Reserve is likely to signal its intention to cut interest rates in September after its two-day meeting on Wednesday. Markets are pricing in a 25 bps chance of a rate cut at 4% for this week’s FOMC meeting and 100% for the next meeting on September 17–18. On Thursday, the Bank of England (BoE) is expected to cut the bank rate by 25 bps to 5.00% from 5.25%.
Equity markets in Europe were mostly up on Friday. Germany’s DAX (DE40) fell 0.53%, France’s CAC 40 (FR40) closed down 0.98%, Spain’s IBEX 35 (ES35) lost 0.43%, and the UK’s FTSE 100 (UK100) closed positive 0.08%. According to preliminary data, the French economy grew 0.3% QoQ in Q2 2024, matching the upwardly revised Q1 figure but beating market estimates of 0.2% growth. This was the strongest quarterly growth since Q2 2023.
WTI crude prices fell to $75.6 a barrel on Tuesday, hitting their lowest level since early June, amid lingering concerns about demand from major consumer China. The latest data showed that China’s total fuel oil imports fell by 11% in the first half of 2024. Concerns about the outlook for the Chinese economy intensified after disappointing GDP data and the unexpected rate cut by the PBOC last week to stimulate growth, which negatively impacted the market. In addition, concerns over geopolitical tensions in the Middle East eased slightly after reports that Hezbollah said it was not seeking to provoke a full-scale war with Israel.
Asian markets were predominantly down yesterday. Japan’s Nikkei 225 (JP225) added 2.13%, China’s FTSE China A50 (CHA50) was down 0.39%, Hong Kong’s Hang Seng (HK50) was up 1.28%, and Australia’s ASX 200 (AU200) was positive 0.86%.
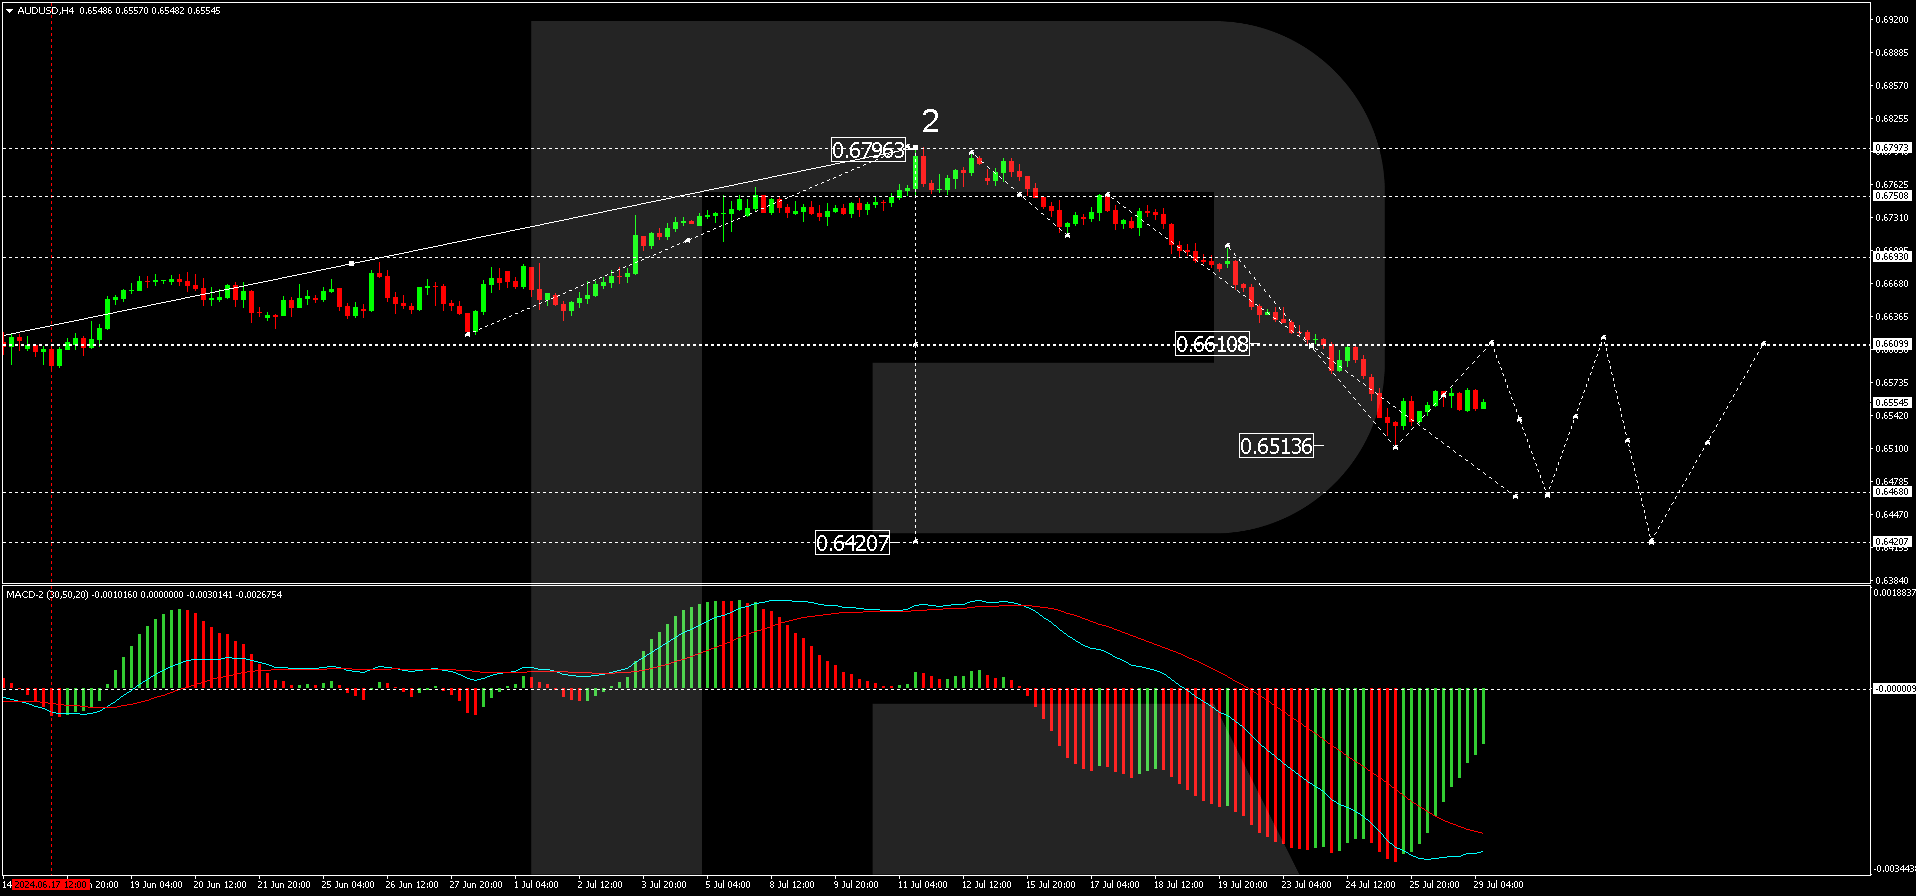
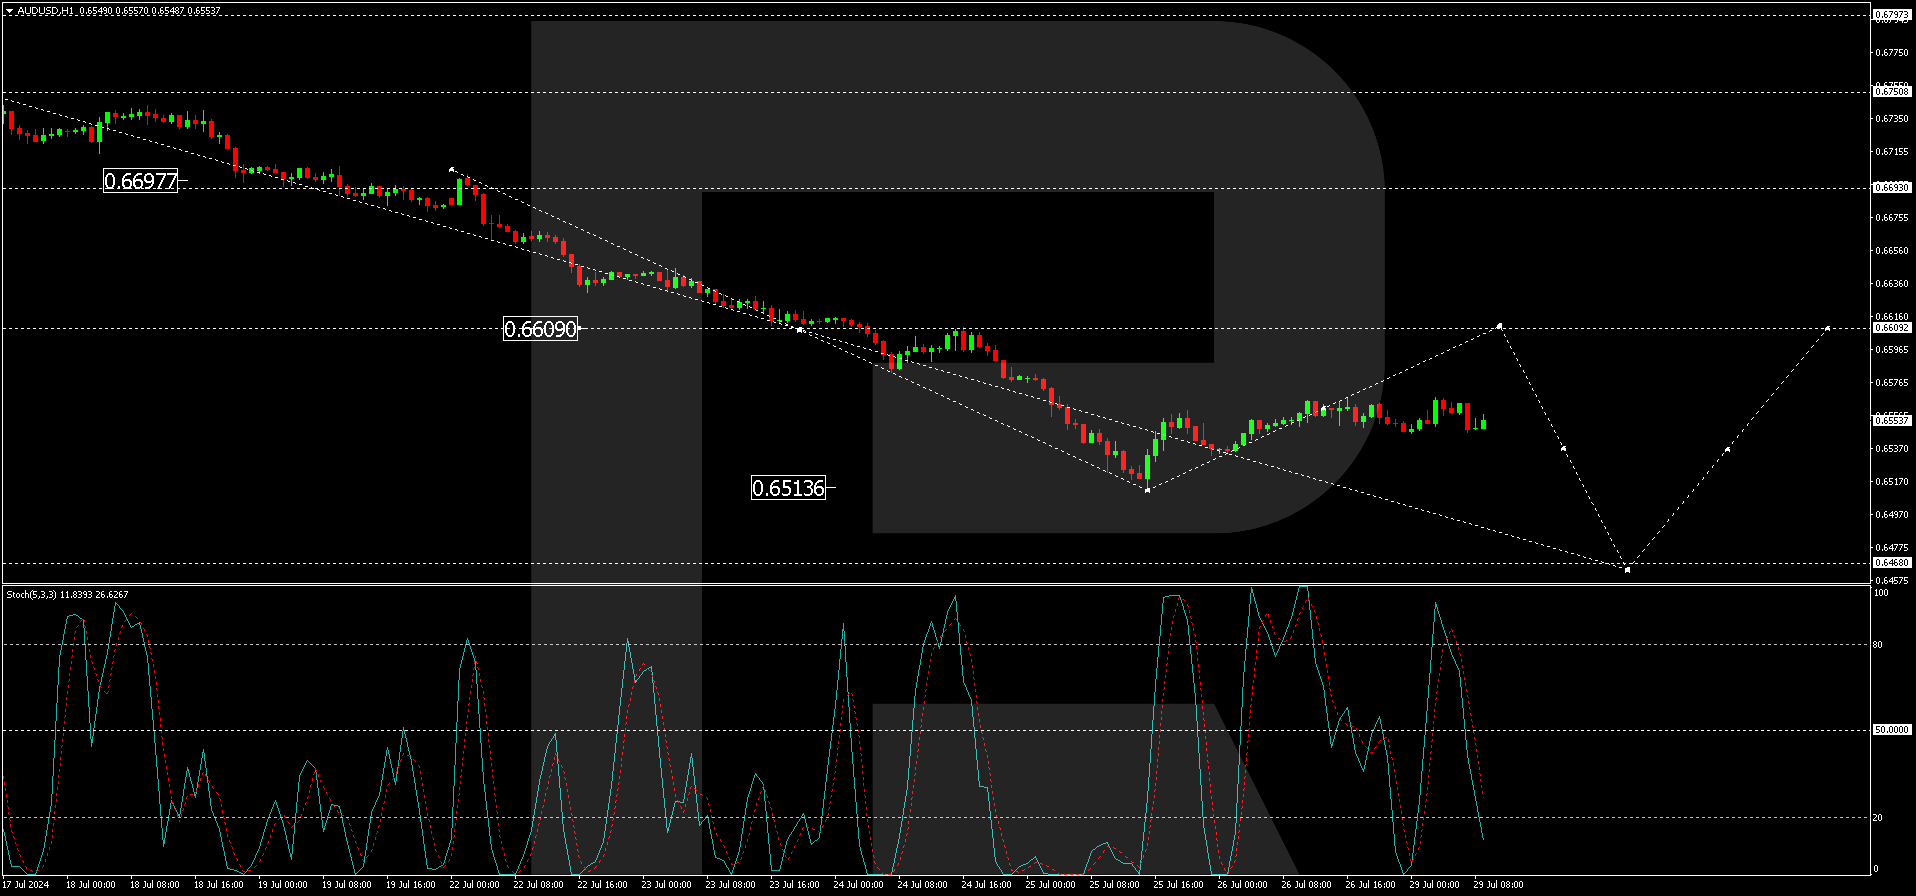
The Australian dollar is holding near $0.655 as traders avoid making big bets ahead of the release of key domestic inflation data that could influence the Reserve Bank of Australia’s next move. Markets expect Australia’s annual core inflation rate to remain at 4% in the second quarter, well above the central bank’s target range of 2–3%, bolstering the case for another rate hike in August. Traders currently see a 22% chance of the RBA raising rates by 25 basis points next month, while the likelihood of a rate cut before April next year is ruled out.
Japan’s unemployment rate in June 2024 was 2.5%, compared to market estimates of 2.6%, which had also been recorded in the previous four months. It was the lowest unemployment rate since January.
S&P 500 (US500) 5,463.54 +4.44 (+0.081%)
Dow Jones (US30) 40,539.93 −49.41 (−0.12%)
DAX (DE40) 18,320.67 −96.88 (−0.53%)
FTSE 100 (UK100) 8,292.35 +6.64 (+0.08%)
USD Index 104.57 +0.25 (+0.24%)
- – Japan Unemployment Rate (m/m) at 02:30 (GMT+3);
- – Switzerland KOF Leading Indicators (m/m) at 10:00 (GMT+3);
- – German GDP (m/m) at 11:00 (GMT+3);
- – Eurozone GDP (m/m) at 12:00 (GMT+3);
- – German CPI (m/m) at 15:00 (GMT+3);
- – US CB Consumer Confidence (m/m) at 17:00 (GMT+3);
- – US JOLTs Job Openings (m/m) at 17:00 (GMT+3).
By JustMarkets
This article reflects a personal opinion and should not be interpreted as an investment advice, and/or offer, and/or a persistent request for carrying out financial transactions, and/or a guarantee, and/or a forecast of future events.