By JustMarkets
At Monday’s close, the Dow Jones (US30) Index was down 2.60%, while the S&P 500 (US500) Index fell by 3.00%. The NASDAQ Technology Index (US100) closed negative 3.43%. The S&P 500 and Nasdaq 100 Indexes fell to 3-month lows, and the Dow Jones Industrials Index fell to a 7-week low. The fall in global stock markets on Monday triggered a flight into government debt and drove bond yields lower, with the 10-year T-note yield falling to a 14-month low and the 10-year German bund yield falling to a 7-month low. The fall in equities on Monday led to a de-risking of asset markets, with the price of bitcoin (BTCUSD) falling more than 14% to a 5-month low and WTI crude oil falling to a 6-month low.
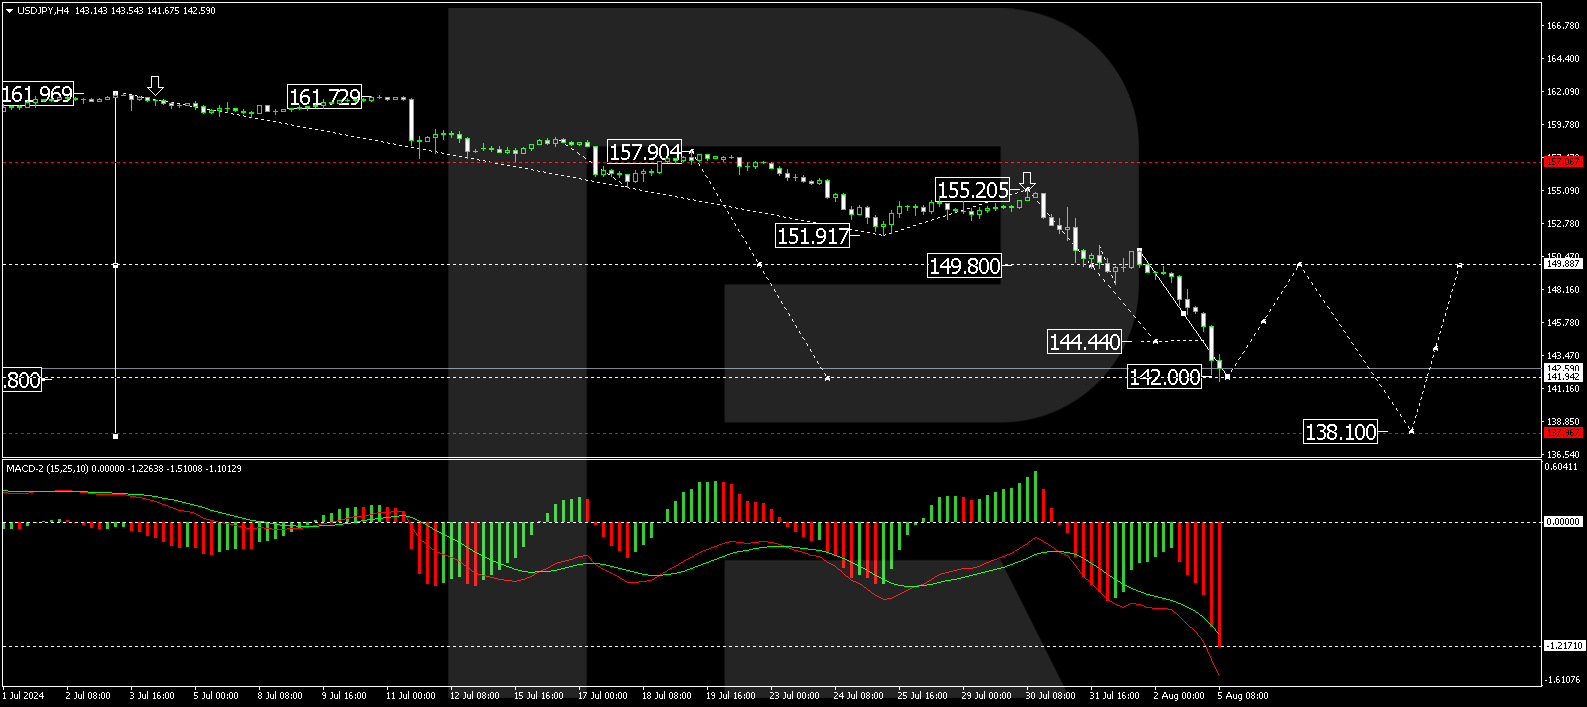
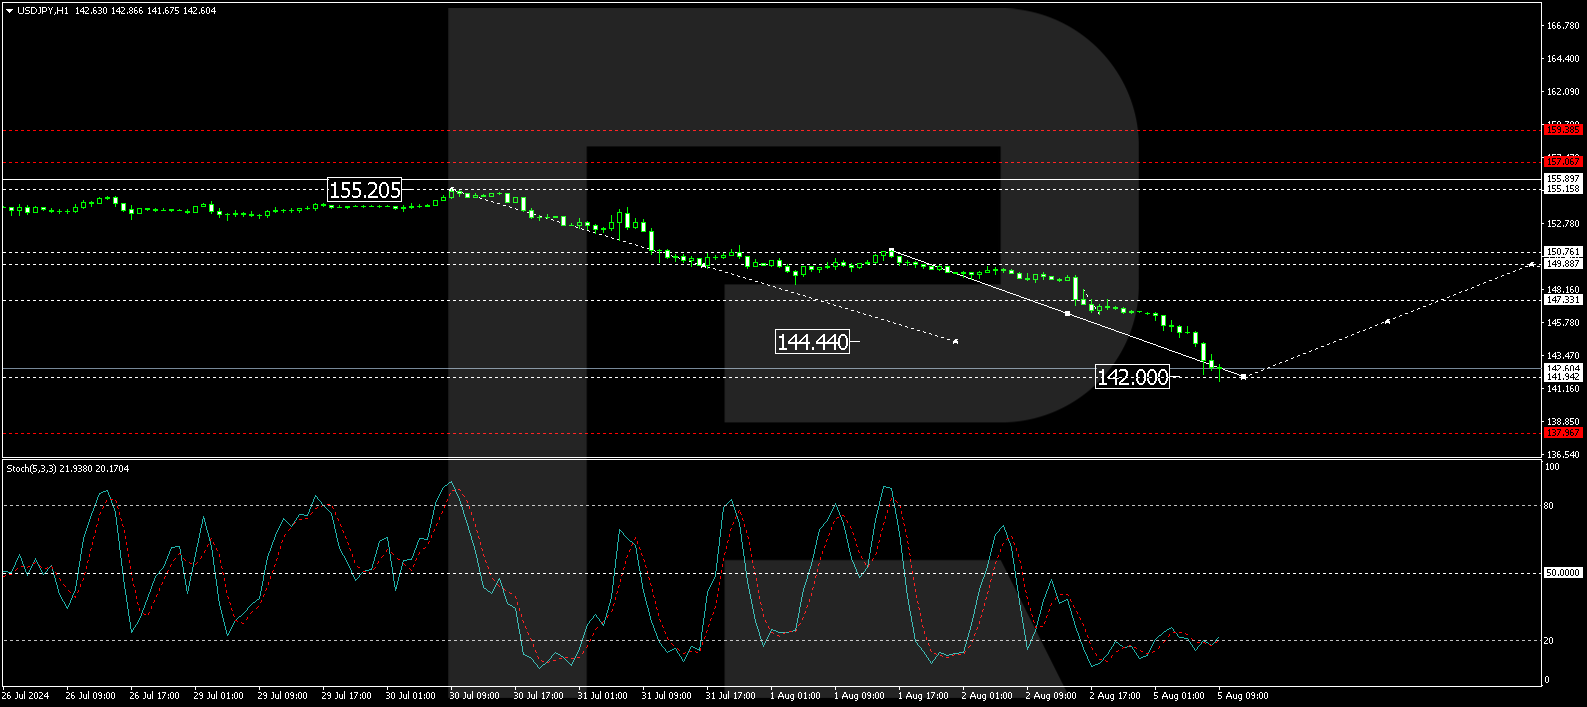
Why did such a massive sell-off occur? Economists have several theories, but the most real is the Japanese yen theory, where there is a forced closing of curry-trade positions. Funds have to pay higher interest rates on borrowed yen. Their USD assets may not be enough to repay the JPY loans. This has caused a massive sell-off of trading positions to attract more USD, converting them back into JPY to repay the loans. Expect an emergency Fed meeting against this backdrop only if the current volatility triggers risks to financial stability. It has nothing to do with recession risks at the moment, although it could trigger/accelerate them. However, after such an upsurge in volatility, some market participants will be forced to cut risks/shoulders by reducing positions, creating conditions and inertia for the process to continue. The Middle East conflict and political uncertainty in the US are adding to the fear and panic.
Chicago Fed President Goolsbee said last month’s jobs data “came in weaker than expected, but does not yet look like a recession” as US economic growth continues at a “fairly robust level.” Markets rate the odds of a 25bp rate cut at the September 17–18 FOMC meeting at 100% and a 50bp rate cut at the September 17–18 FOMC meeting at 95%.
Equity markets in Europe were mostly falling yesterday. Germany’s DAX (DE40) fell by 1.82%, France’s CAC 40 (FR40) closed down 1.42%, Spain’s IBEX 35 (ES35) lost 2.34%, and the UK’s FTSE 100 (UK100) closed negative 2.04%. The S&P Eurozone Composite PMI for July was revised upward by 0.1 to 50.2 from the previously reported 50.1. Swaps discount the odds of a 25 bp rate cut by the ECB by 99% at the September 12 meeting.
WTI crude oil prices rose to around $74 a barrel on Tuesday after declining for three consecutive sessions, helped by continued supply risks from rising tensions in the Middle East. Fears of a regional war intensified as Israel braced for possible attacks following Iran’s threats to retaliate after the recent assassinations of a senior Hezbollah commander in Lebanon and Hamas’ top political leader in Iran. Due to anti-government protests and security concerns, oil prices also received support from the shutdown of production at Libya’s largest oil field, Sharara.
Asian markets were mostly down yesterday. Japan’s Nikkei 225 (JP225) fell by 12.40%, China’s FTSE China A50 (CHA50) was down 0.59%, Hong Kong’s Hang Seng (HK50) was down 1.46%, and Australia’s ASX 200 (AU200) was negative 3.70%.
Japan’s Nikkei 225 Index soared 10.7% early Tuesday, a day after a record 12.4% drop. By late morning, the index had given up some ground and was up 8.7% at 34,211.83. The rise followed sharp losses on Wall Street, which were dramatic but not as widespread as Monday’s crash in Tokyo. The losses of the past few sessions followed the Bank of Japan raising its main interest rate from nearly zero last week. That move helped to boost the value of the Japanese yen, but it also forced traders to exit trades in which they had borrowed money in Japan for virtually free and invested it elsewhere in the world.
The Reserve Bank of Australia (RBA) left interest rates unchanged for the sixth consecutive meeting but reiterated that it did not rule out further rate hikes to control inflation. The Central Bank kept the official money rate at a 12-year high of 4.35%, as expected, and emphasized that monetary policy should remain restrictive enough to ensure inflation returns to the target range of 2–3%. In addition, RBA chief Michele Bullock effectively ruled out the possibility of an interest rate cut in the near future.
In New Zealand, investors and some economists expect the Reserve Bank (RBNZ) to start cutting interest rates next week as markets around the world raise bets on imminent monetary easing. ANZ estimates the Central Bank will cut the official money rate by 25 bps to 5.25% at its August 14 meeting, with two more cuts to 4.75% expected by the end of the year.
S&P 500 (US500) 5,186.33 −160.23 (−3.00%)
Dow Jones (US30) 38,703.27 −1,033.99 (−2.60%)
DAX (DE40) 17,339.00 −322.22 (−1.82%)
FTSE 100 (UK100) 8,008.23 −166.48 (−2.04%)
USD Index 102.74 −0.46 (−0.45%)
- – Australia RBA Interest Rate Decision (m/m) at 07:30 (GMT+3);
- – Australia RBA Monetary Policy Statement (m/m) at 07:30 (GMT+3);
- – Switzerland Unemployment Rate (m/m) at 08:45 (GMT+3).
- – Eurozone Retail Sales (m/m) at 12:00 (GMT+3);
- – US Trade Balance (m/m) at 15:30 (GMT+3);
- – Canada Trade Balance (m/m) at 15:30 (GMT+3).
By JustMarkets
This article reflects a personal opinion and should not be interpreted as an investment advice, and/or offer, and/or a persistent request for carrying out financial transactions, and/or a guarantee, and/or a forecast of future events.