By JustMarkets
On Wednesday, the US stock markets rose confidently amid improved investor sentiment due to a possible resolution of the conflict with Iran and strong corporate earnings. By the end of the day, the Dow Jones (US30) increased by 1.24%. The S&P 500 (US500) rose by 1.46%. The Technology Index Nasdaq (US100) closed higher by 2.02%. The S&P 500 and Nasdaq once again renewed record highs. Growth was observed in almost all sectors except energy, which came under pressure due to falling oil prices. The main drivers of the market were companies related to artificial intelligence and data‑center infrastructure. AMD and Super Micro Computer showed particularly strong performance after reporting better‑than‑expected results and raising their projections. Additional support came from strong results by Disney and a positive outlook from Uber, which also boosted their shares.
On Wednesday, European stock markets rose sharply amid falling energy prices, which were driven by expectations of a possible resolution of the conflict in the Middle East. By the end of the day, Germany’s DAX (DE40) jumped by 2.12%, France’s CAC 40 (FR40) closed up by 2.94%, Spain’s IBEX 35 (ES35) rose by 2.47%, and the UK’s FTSE 100 (UK100) ended the trading session up positive 2.15%. The decline in oil and gas prices also led to a revision of monetary‑policy expectations: investors began pricing in less aggressive rate hikes, and corporate profit outlooks improved.
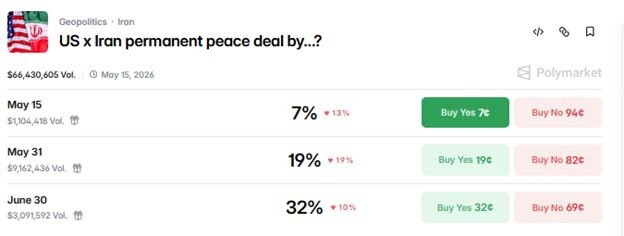
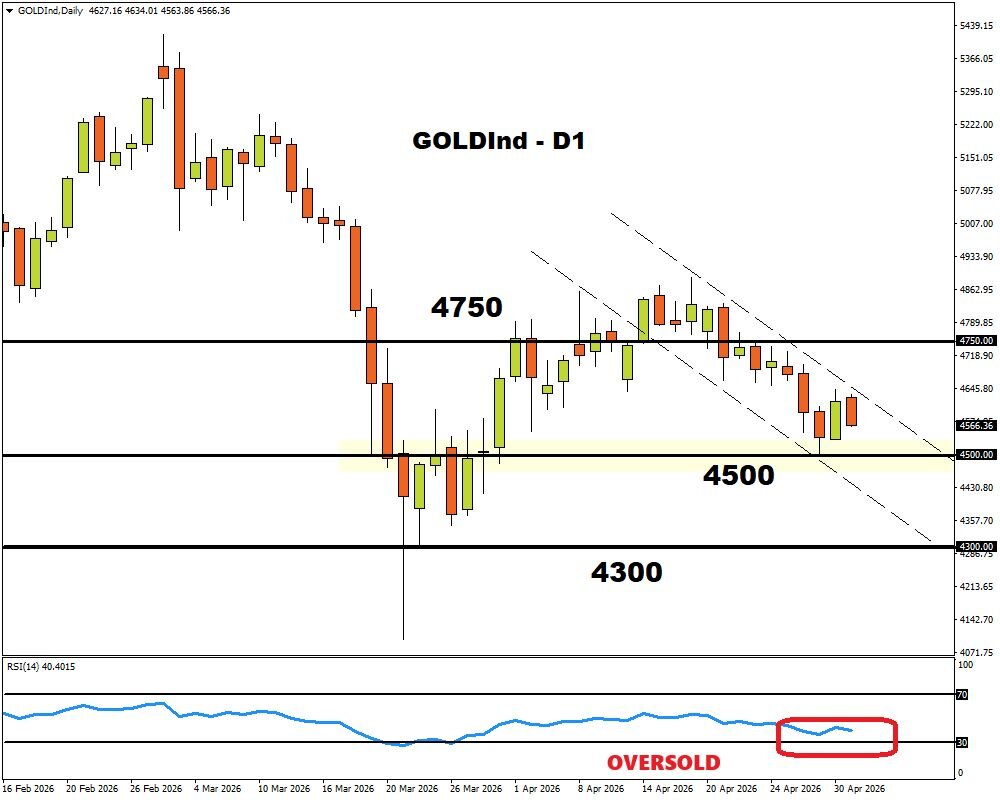
On Wednesday, silver (XAG) rose sharply, gaining more than 6% and climbing above $77 per ounce, reaching its highest level in recent weeks. The price increase was driven by easing inflation concerns amid signs of de‑escalation in the Middle East, which put pressure on oil prices. Optimism strengthened after reports of a possible agreement between the US and Iran that could lead to an end to the conflict and the resumption of nuclear negotiations. Against this backdrop, precious metals partially recovered earlier losses, which had been caused by rising energy prices that heightened inflation risks and supported expectations of tighter central‑bank policy.
On Wednesday, WTI oil prices fell sharply, dropping about 6% to around $96 per barrel and continuing the decline that began the previous day. The market came under pressure from growing expectations of diplomatic progress between the US and Iran. Tehran reported that it is considering a US‑backed proposal to end the conflict, and a final response may be delivered through intermediaries soon. Despite signs of de‑escalation, the consequences of the crisis are still being felt: thousands of sailors remain in the region, supply disruptions persist, and high energy prices continue to weigh on global demand, while restoring logistics may take a long time.
In Asia, Japan’s Nikkei 225 (JP225) was not traded yesterday, China’s FTSE China A50 closed up by 1.13%, Hong Kong’s Hang Seng (HK50) rose by 1.22%, and Australia’s ASX 200 (AU200) jumped by 1.30%.
According to the minutes of the Bank of Japan’s (BoJ) March meeting, many policymakers considered further rate hikes possible if the energy crisis caused by the conflict around Iran persists. Participants noted that short‑term supply disruptions can be viewed as temporary, but prolonged increases in energy prices could strengthen inflation expectations and lead to more persistent price growth in the economy. Some board members advocated more decisive tightening, emphasizing the need to act without long pauses if the economy avoids a significant slowdown. Despite this, at both the March and subsequent April meetings, the Bank of Japan kept the key rate at 0.75%.
The Australian dollar (AUD) rose above 0.72 US dollars and reached a four‑year high amid a weakening US currency. The Australian dollar was supported by growing optimism around a possible peace agreement in the Middle East, which reduced demand for the dollar as a safe‑haven asset. Meanwhile, domestic economic data came in weaker than expected: in March, Australia unexpectedly recorded a trade deficit for the first time in more than eight years. Additional support for the Australian currency continues to come from the recent central‑bank rate hike to 4.35%.
On Thursday, the New Zealand dollar (NZD) held around 0.595 US dollars after rising more than 1% in the previous session, when the currency reached a two‑month high. The market was supported by increased optimism around a possible peace agreement between the US and Iran, which boosted investor interest in riskier assets. Domestic labor‑market data in New Zealand were mixed and did little to change monetary‑policy expectations. Unemployment fell slightly more than expected, but employment growth was weaker than expected. The market still sees the probability of a near‑term rate hike as relatively low, although tightening in the summer is still priced in due to persistent inflation risks linked to high energy prices.
S&P 500 (US500) 7,365.12 +105.90 (+1.46%)
Dow Jones (US30) 49,910.59 +612.34 (+1.24%)
DAX (DE40) 24,918.69 +516.99 (+2.12%)
FTSE 100 (UK100) 10,438.66 +219.55 (+2.15%)
USD Index 98.04 -0.41 (-0.41%)
News feed for: 2026.05.07
- Japan Monetary Policy Meeting Minutes at 02:50 (GMT+3) – JPY (LOW)
- Australia Trade Balance (m/m) at 04:30 (GMT+3) – AUD (MED)
- Sweden Riksbank Rate Decision at 10:00 (GMT+3) – SEK (HIGH)
- Switzerland Unemployment Rate (m/m) at 10:00 (GMT+3) – CHF (MED)
- Norway Norges Bank Interest Rate Decision at 11:00 (GMT+3) – NOK (HIGH)
- Eurozone Retail Sales (m/m) at 12:00 (GMT+3) – EUR (MED)
- Mexico Inflation Rate (m/m) at 15:00 (GMT+3) – MXN (MED)
- US Unemployment Claims (m/m) at 15:30 (GMT+3) – USD (MED)
- US Natural Gas Storage (w/w) at 17:30 (GMT+3) – XNG (HIGH)
- Mexico Banxico Interest Rate Decision at 22:00 (GMT+3) – MXN (HIGH)
By JustMarkets
This article reflects a personal opinion and should not be interpreted as an investment advice, and/or offer, and/or a persistent request for carrying out financial transactions, and/or a guarantee, and/or a forecast of future events.