
By Analytical Department RoboForex
GBP/USD is attempting to recover on Tuesday following earlier declines, bouncing from 1.3198 after five consecutive sessions of selling. Sterling remains under pressure as investors assess the impact of the Iran conflict on the British economy.
Despite this, since the beginning of March, the pound has remained one of the most stable currencies against the dollar.
However, sterling remains vulnerable. Britain’s high reliance on gas imports, persistently high inflation, and pressure on public finances are heightening risks. The yield on 10-year government bonds is holding around 4.98%, near highs not seen since 2008, following recent increases.
Additional attention is focused on the debt market: after the government bond sale, some pension funds were required to increase collateral to hedge positions, although the scale remains far from the 2022 crisis levels.
Macroeconomic data also point to a slowing economy. Business activity is growing at its slowest pace in six months, producer costs are accelerating, and retail sales are declining.
Free Reports:
 Download Our Metatrader 4 Indicators – Put Our Free MetaTrader 4 Custom Indicators on your charts when you join our Weekly Newsletter
 Get our Weekly Commitment of Traders Reports - See where the biggest traders (Hedge Funds and Commercial Hedgers) are positioned in the futures markets on a weekly basis.
The Bank of England is likely to remain cautious about changing rates – this remains the prevailing expectation.
Technical Analysis

On the H4 GBP/USD chart, the market is forming a broad consolidation range around 1.3297, currently extending up to 1.3434. A decline to 1.3156 is likely in the near term, followed by the formation of a new consolidation range. An upside breakout would open the way for a continuation move to 1.3300, while a downside breakout would suggest further movement to 1.3100. Technically, this scenario is confirmed by the MACD indicator, whose signal line is below zero and pointing downwards.
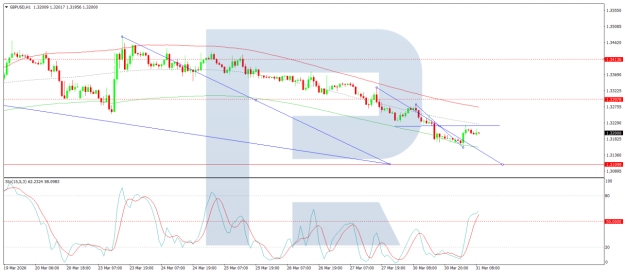
On the H1 chart, the market has formed a compact consolidation range around 1.3322. A downside breakout has initiated a wave structure extending to 1.3100. Should this level be breached, further downside potential towards 1.3050 would emerge. Conversely, an upside breakout from the range could trigger a rebound towards 1.3300. Technically, this scenario is confirmed by the Stochastic oscillator, with its signal line below 50 and pointing downwards.
Conclusion
GBP/USD is attempting to stabilise after five consecutive days of selling, though the broader outlook remains fragile. While sterling has shown relative resilience compared to other currencies since March, mounting headwinds – including the UK’s energy import dependence, stubborn inflation, debt market pressures, and slowing economic activity – continue to weigh on the pound. The Bank of England’s cautious stance offers little immediate support, and technical indicators point to further downside potential. A recovery pause may materialise, but sustained upside appears unlikely without a tangible shift in either geopolitical tensions or domestic economic data.
Disclaimer
Any forecasts contained herein are based on the author’s particular opinion. This analysis may not be treated as trading advice. RoboForex bears no responsibility for trading results based on trading recommendations and reviews contained herein.

- Geopolitical and macroeconomic conditions continue to pressure market sentiment Jul 20, 2026
- USD/JPY Poised to Continue Gains as Expensive Oil and Lack of Support Weigh on Yen Jul 20, 2026
- COT Metals Charts: Weekly Speculator Bets led by Copper & Steel Jul 18, 2026
- COT Bonds Charts: Weekly Speculator Bets led by 2-Year, SOFR 3M & 5-Year Bonds Jul 18, 2026
- COT Energy Charts: Weekly Speculator Bets led by Brent Oil & Heating Oil Jul 18, 2026
- COT Soft Commodities Charts: Weekly Speculator Bets led by Wheat, Corn & Soybean Meal Jul 18, 2026
- The Bank of Canada kept its interest rate unchanged. Platinum prices reached a three‑week high Jul 16, 2026
- Stock indices rose after the release of US inflation data. China’s GDP slowed sharply Jul 15, 2026
- GBP/USD Awaits Political News: What Will Happen Next Jul 15, 2026
- USD/JPY Holds at Highs: Pressure Lingers on Yen Jul 14, 2026