By ForexTime
- Trump vows to maintain naval blockade on Iran
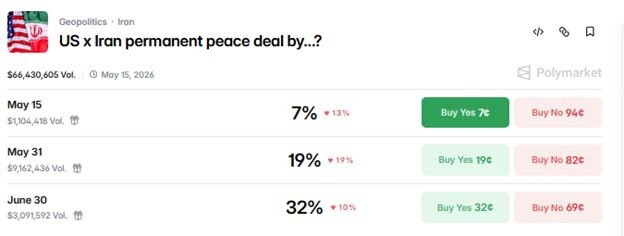
- Prediction markets see little chance of a peace deal anytime soon
- Newly launched gold index/futures offset CFD risk
- Iran war + Fed speeches+ NFP = fresh volatility
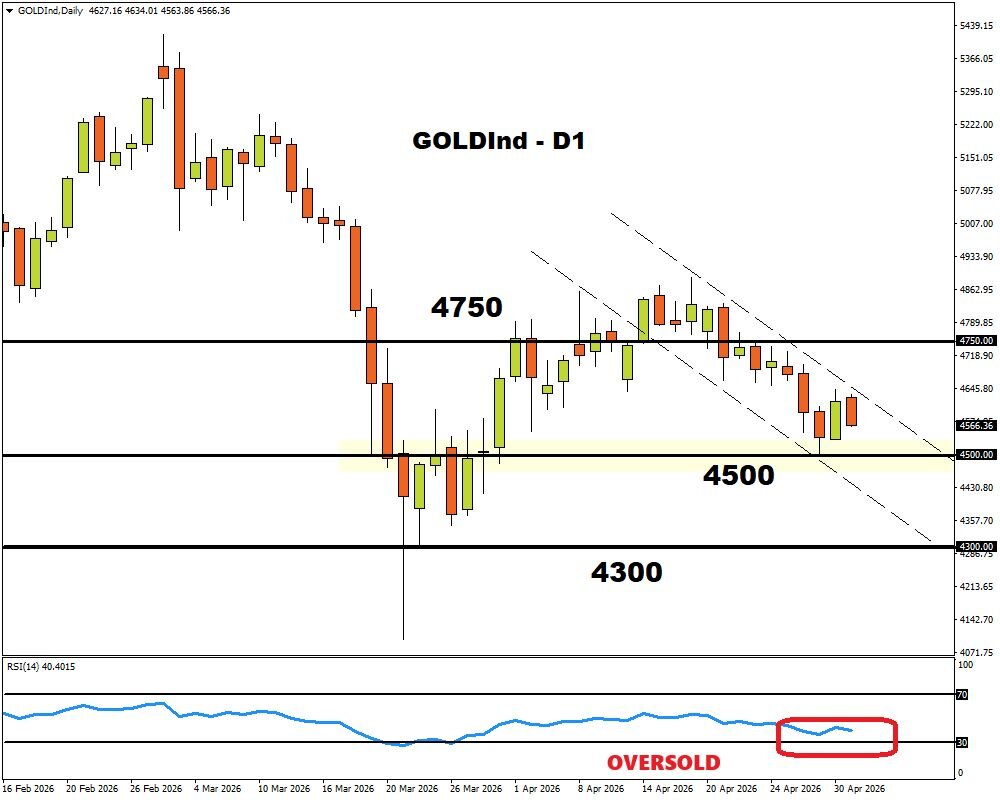
- Technical levels – $4300, $4500 and $4750
A fragile ceasefire. A naval blockade. And odds that are anything but encouraging.
Trump has vowed to maintain a chokehold on Iran’s waters which may cast a shadow over the first week of May.
Considering that prediction markets are pricing a permanent peace deal at just 30% by the end-June, the Strait of Hormuz saga is far from over.
Heightened geopolitical risk, corporate earnings, speeches by Fed officials and the NFP may trigger extreme levels of volatility in the week ahead:
Sunday, 3rd May
- OPEC+ monthly meeting held as the war in Iran moves into its third month.
Monday, 4th May
- EUR: Eurozone S&P Global manufacturing PMI
- GER40: Germany S&P Global/BME Germany manufacturing PMI
- GOLDInd: NY Fed President John Williams
Tuesday, 5th May
- AUD: RBA rate decision
- SPN35: Spain unemployment
- GOLDInd: US new home sales, trade, job openings, ISM Services, building permits
Wednesday, 6th May
- CNH: China RatingDog composite and services PMI
- EUR: Eurozone S&P Global services PMI, PPI
- GER40: Germany S&P Global services PMI
- NZD: New Zealand unemployment
- US500: US Treasury Department holds quarterly refunding announcement
- GOLDM6: US ADP employment, St. Louis Fed President Alberto Musalem
Thursday, 7th May
- EUR: Eurozone retail sales
- JPY: Japan BOJ meeting minutes
- CHF: Sweden rate decision
- TWN: Taiwan CPI
- GOLDM6: US construction spending, initial jobless claims, NY Fed President John Williams
Friday, 8th May
- CAD: Canada employment
- GER40: Germany industrial production, trade
- GOLDInd: US NFP (April), University of Michigan consumer sentiment
Gold has been trending lower thanks to a broadly stronger dollar and inflation fears.
As concerns over inflation shocks mount, central banks are likely to keep rates steady or even hike down the road as witnessed in the latest batch of policy decisions.
This hawkish reality is bad news for zero-yielding gold despite the risk-off sentiment.
Considering how volatility may remain the name of the game in May, FXTM’s Gold Index and Futures may be ideal for offsetting spot CFD risk.
FXTM’s GOLDJ6 future
FXTM’s GOLDJ6 is 100% pegged to CME Group Futures price for absolute price clarity, charging traders zero swap when holding overnight positions.
This asset is a gift for active and long-term traders who want full price transparency without financing drag of holding positions over extended periods.
FXTM’s GOLDInd
FXTM’s GOLDInd tracks the spot/future price with fixed swap and spreads.
This asset is ideal for traders who want to hold the position over an extended period at a fixed cost, avoiding surprise overnight charges or widening spreads sparked by volatility.
With all the above said, here are 3 key factors that may influence Gold Futures & Indices.
1) Strait of Hormuz saga
An impasse between the United States and Iran continues to drain risk sentiment, with market fatigue building due to the back and forth.
Trump has vowed to maintain the naval blockade while Iran has warned that this will further push up oil prices.
Given how both sides are waiting for the other to yield, this could translate to extended levels of uncertainty and elevated oil prices amid the closure.
- If the conflict deepens, gold futures/index may dip as surging oil prices fuel inflation fears.
- Any signs of easing tensions and re-opening of the Straight of Hormuz to the US may weaken gold as inflation concerns reduce.
2) US April NFP
The April US jobs report on Friday 8th May may provide insight into the health of the labour markets.
Here’s what economists predict for this closely watched jobs report:
- Headline NFP figure: 60,000 (new jobs added to US labour market)
If so, this would be a decline from the March 178,000 headline NFP figure.
- Unemployment rate: 4.3%
If so, this would match March unemployment rate
- Average hourly earnings month-on-month (April 2026 vs. March 2026): 0.3%
If so, this would higher than March’s figure.
Note: Other key data in the week including the ADP and Fed speeches may influence gold prices.
- A stronger-than-expected US jobs data may stimulate bets around the Fed hiking rates.
- A weaker-than-expected figure could cool bets around Fed hikes.
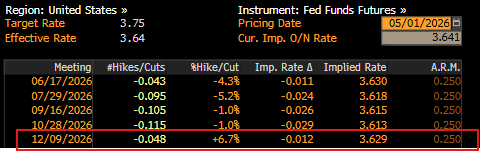
Note: Traders are currently pricing a 5% chance that the Fed will cut rates by June 2026.
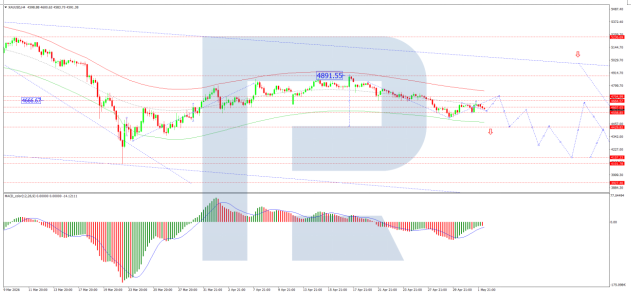
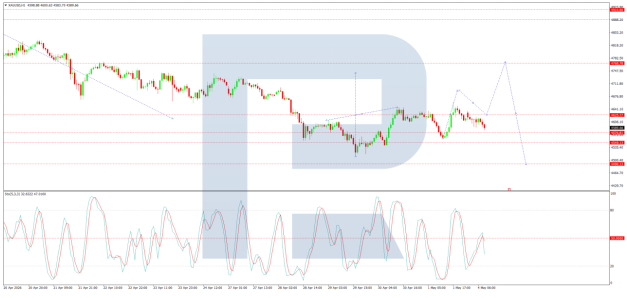
3) Technical forces
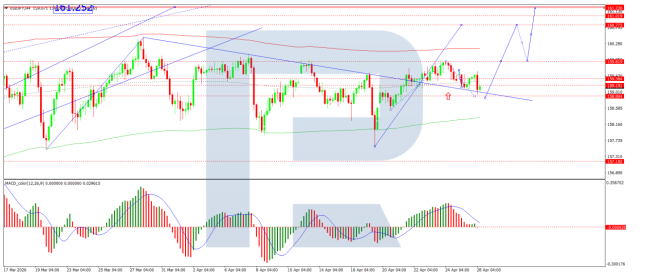
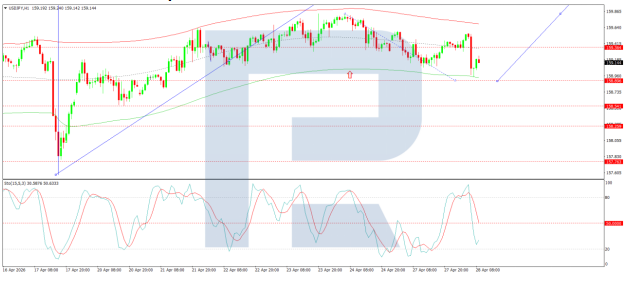
Prices remain in a bearish channel on the daily charts as there have been consistently lower lows and lower highs. However, the RSI is slowly approaching oversold regions, suggesting a potential rebound down the road.
- Should $4500 prove reliable support, prices may rebound back toward $4750 and higher.
- Weakness below $4500 could take prices toward $4300.
![]() Article by ForexTime
Article by ForexTime
ForexTime Ltd (FXTM) is an award winning international online forex broker regulated by CySEC 185/12 www.forextime.com