By InvestMacro
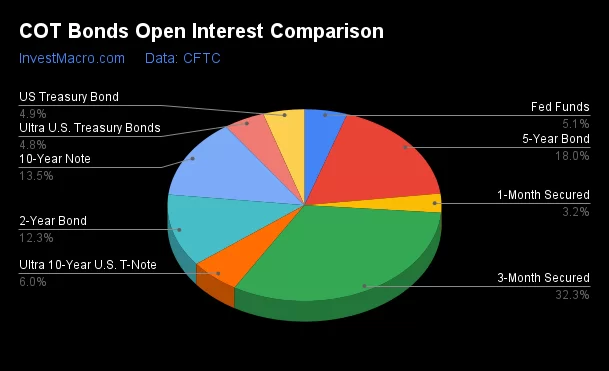
Here are the latest charts and statistics for the Commitment of Traders (COT) reports data published by the Commodities Futures Trading Commission (CFTC).
The latest COT data is updated through Tuesday September 10th and shows a quick view of how large traders (for-profit speculators and commercial hedgers) were positioned in the futures markets.
Weekly Speculator Changes led by SOFR 3-Months & Fed Funds
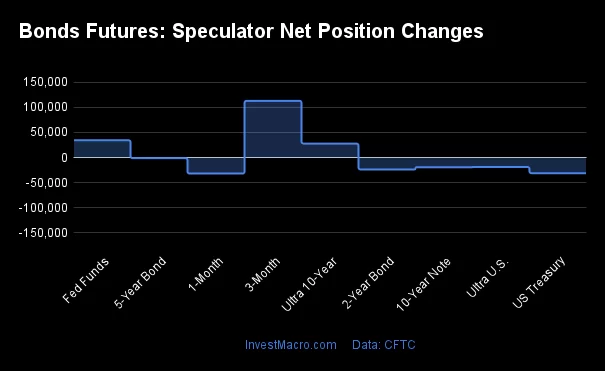
The COT bond market speculator bets were lower this week as just three out of the nine bond markets we cover had higher positioning while the other six markets had lower speculator contracts.
Leading the gains for the bond markets was the SOFR 3-Months (112,656 contracts) with the Fed Funds (34,313 contracts) and the Ultra 10-Year Bonds (27,613 contracts) also having positive weeks.
The bond markets with declines in speculator bets for the week were the SOFR 1-Month (-31,894 contracts), the US Treasury Bonds (-31,186 contracts), the 2-Year Bonds (-23,754 contracts), the 10-Year Bonds (-19,278 contracts), the Ultra Treasury Bonds (-18,956 contracts) and with the 5-Year Bonds (-1,300 contracts) also registering lower bets on the week.
Bonds Net Speculators Leaderboard
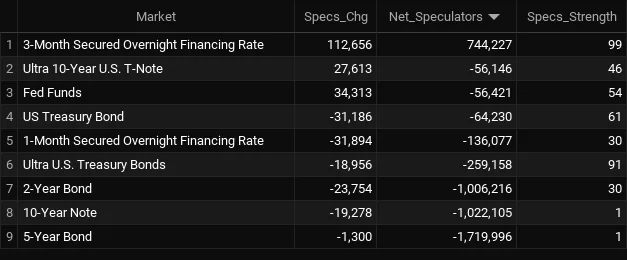
Legend: Weekly Speculators Change | Speculators Current Net Position | Speculators Strength Score compared to last 3-Years (0-100 range)
Strength Scores led by SOFR 3-Months & Ultra Treasury Bonds
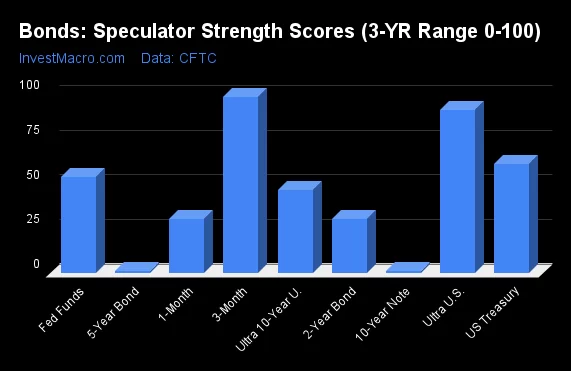
COT Strength Scores (a normalized measure of Speculator positions over a 3-Year range, from 0 to 100 where above 80 is Extreme-Bullish and below 20 is Extreme-Bearish) showed that the SOFR 3-Months (99 percent) and the Ultra Treasury Bonds (91 percent) lead the bond markets this week. The US Treasury Bonds (61 percent) comes in as the next highest in the weekly strength scores.
On the downside, the 5-Year Bond (1 percent) and the 10-Year Bonds (1 percent) come in at the lowest strength level currently and are in Extreme-Bearish territory (below 20 percent). The next lowest strength scores were the 2-Year Bonds (30 percent) and the SOFR 1-Month (30 percent).
Strength Statistics:
Fed Funds (54.0 percent) vs Fed Funds previous week (46.3 percent)
2-Year Bond (30.0 percent) vs 2-Year Bond previous week (31.6 percent)
5-Year Bond (1.0 percent) vs 5-Year Bond previous week (1.1 percent)
10-Year Bond (1.3 percent) vs 10-Year Bond previous week (2.9 percent)
Ultra 10-Year Bond (46.2 percent) vs Ultra 10-Year Bond previous week (40.5 percent)
US Treasury Bond (61.1 percent) vs US Treasury Bond previous week (72.0 percent)
Ultra US Treasury Bond (91.2 percent) vs Ultra US Treasury Bond previous week (100.0 percent)
SOFR 1-Month (30.4 percent) vs SOFR 1-Month previous week (38.8 percent)
SOFR 3-Months (98.7 percent) vs SOFR 3-Months previous week (92.9 percent)
Ultra Treasury Bonds & Fed Funds top the 6-Week Strength Trends
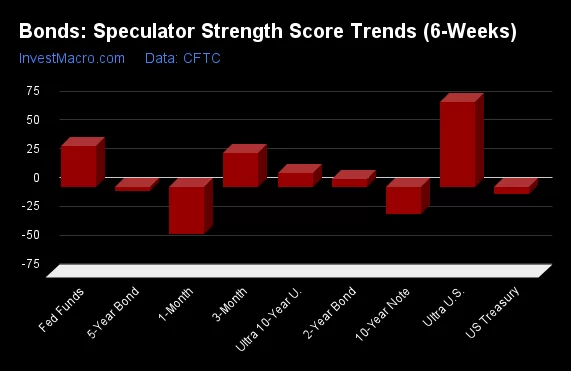
COT Strength Score Trends (or move index, calculates the 6-week changes in strength scores) showed that the Ultra Treasury Bonds (73 percent) and the Fed Funds (35 percent) lead the past six weeks trends for bonds. The SOFR 3-Months (29 percent) and the Ultra 10-Year Bond (11 percent) are the next highest positive movers in the latest trends data.
The SOFR 1-Month (-41.4 percent) and the 10-Year Bonds (-24 percent) lead the downside trend scores currently with the US Treasury Bonds (-6 percent) and the 5-Year Bonds (-4 percent) following next with lower trend scores.
Strength Trend Statistics:
Fed Funds (35.0 percent) vs Fed Funds previous week (10.5 percent)
2-Year Bond (6.2 percent) vs 2-Year Bond previous week (10.2 percent)
5-Year Bond (-3.9 percent) vs 5-Year Bond previous week (-12.0 percent)
10-Year Bond (-24.1 percent) vs 10-Year Bond previous week (-29.6 percent)
Ultra 10-Year Bond (11.4 percent) vs Ultra 10-Year Bond previous week (6.6 percent)
US Treasury Bond (-6.4 percent) vs US Treasury Bond previous week (10.8 percent)
Ultra US Treasury Bond (73.0 percent) vs Ultra US Treasury Bond previous week (79.1 percent)
SOFR 1-Month (-41.4 percent) vs SOFR 1-Month previous week (-40.3 percent)
SOFR 3-Months (29.2 percent) vs SOFR 3-Months previous week (25.9 percent)
30-Day Federal Funds Futures:
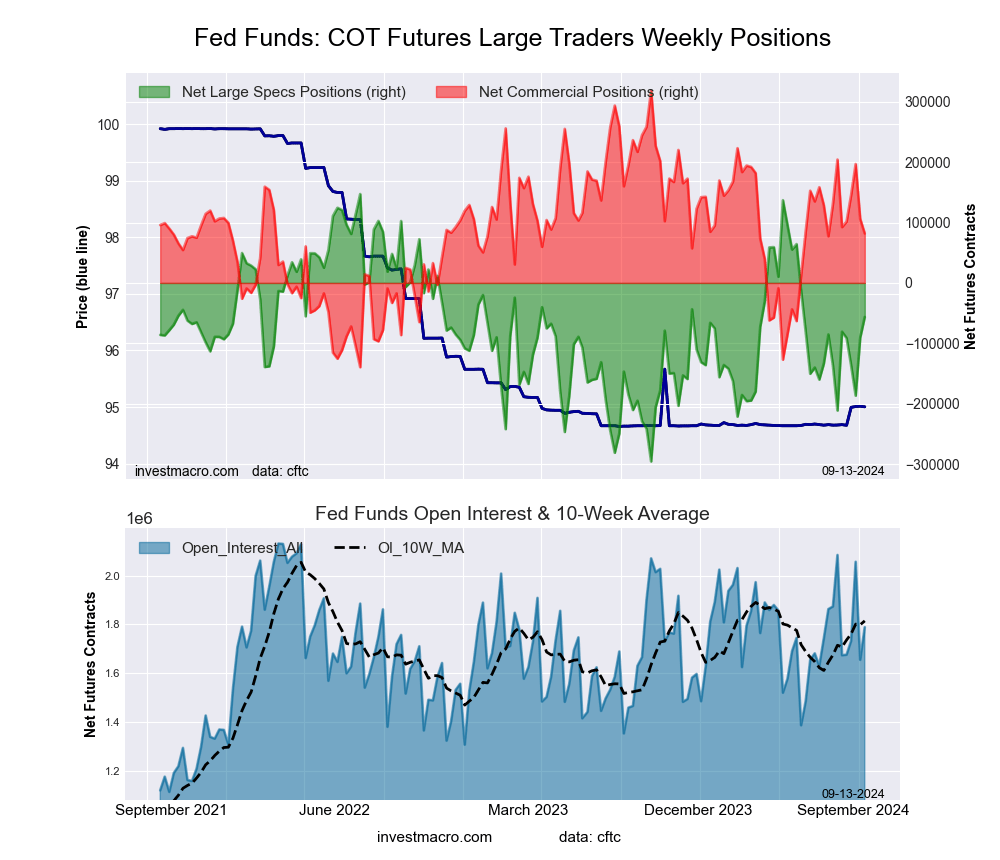 The 30-Day Federal Funds large speculator standing this week was a net position of -56,421 contracts in the data reported through Tuesday. This was a weekly rise of 34,313 contracts from the previous week which had a total of -90,734 net contracts.
This week’s current strength score (the trader positioning range over the past three years, measured from 0 to 100) shows the speculators are currently Bullish with a score of 54.0 percent. The commercials are Bearish with a score of 48.3 percent and the small traders (not shown in chart) are Bearish with a score of 38.3 percent.
Price Trend-Following Model: Downtrend
Our weekly trend-following model classifies the current market price position as: Downtrend. The current action for the model is considered to be: Hold – Maintain Short Position.
| 30-Day Federal Funds Statistics | SPECULATORS | COMMERCIALS | SMALL TRADERS |
| – Percent of Open Interest Longs: | 14.8 | 66.7 | 1.6 |
| – Percent of Open Interest Shorts: | 17.9 | 62.1 | 3.0 |
| – Net Position: | -56,421 | 81,935 | -25,514 |
| – Gross Longs: | 264,595 | 1,193,172 | 28,812 |
| – Gross Shorts: | 321,016 | 1,111,237 | 54,326 |
| – Long to Short Ratio: | 0.8 to 1 | 1.1 to 1 | 0.5 to 1 |
| NET POSITION TREND: | |||
| – Strength Index Score (3 Year Range Pct): | 54.0 | 48.3 | 38.3 |
| – Strength Index Reading (3 Year Range): | Bullish | Bearish | Bearish |
| NET POSITION MOVEMENT INDEX: | |||
| – 6-Week Change in Strength Index: | 35.0 | -26.7 | -59.8 |
Secured Overnight Financing Rate (3-Month) Futures:
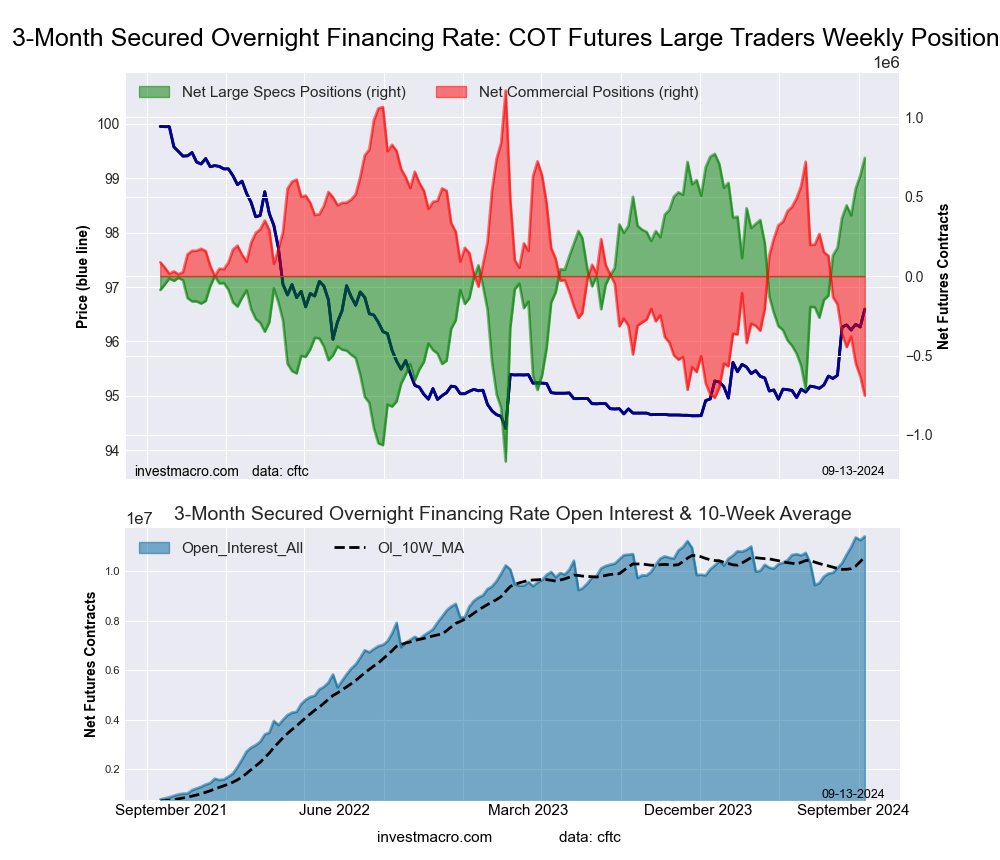 The Secured Overnight Financing Rate (3-Month) large speculator standing this week was a net position of 744,227 contracts in the data reported through Tuesday. This was a weekly rise of 112,656 contracts from the previous week which had a total of 631,571 net contracts.
This week’s current strength score (the trader positioning range over the past three years, measured from 0 to 100) shows the speculators are currently Bullish-Extreme with a score of 98.7 percent. The commercials are Bearish-Extreme with a score of 0.7 percent and the small traders (not shown in chart) are Bullish-Extreme with a score of 92.4 percent.
Price Trend-Following Model: Weak Uptrend
Our weekly trend-following model classifies the current market price position as: Weak Uptrend. The current action for the model is considered to be: Hold – Maintain Long Position.
| SOFR 3-Months Statistics | SPECULATORS | COMMERCIALS | SMALL TRADERS |
| – Percent of Open Interest Longs: | 18.4 | 52.6 | 0.5 |
| – Percent of Open Interest Shorts: | 11.9 | 59.2 | 0.4 |
| – Net Position: | 744,227 | -752,497 | 8,270 |
| – Gross Longs: | 2,097,158 | 5,997,593 | 51,852 |
| – Gross Shorts: | 1,352,931 | 6,750,090 | 43,582 |
| – Long to Short Ratio: | 1.6 to 1 | 0.9 to 1 | 1.2 to 1 |
| NET POSITION TREND: | |||
| – Strength Index Score (3 Year Range Pct): | 98.7 | 0.7 | 92.4 |
| – Strength Index Reading (3 Year Range): | Bullish-Extreme | Bearish-Extreme | Bullish-Extreme |
| NET POSITION MOVEMENT INDEX: | |||
| – 6-Week Change in Strength Index: | 29.2 | -29.7 | 4.9 |
Individual Bond Markets:
Secured Overnight Financing Rate (1-Month) Futures:
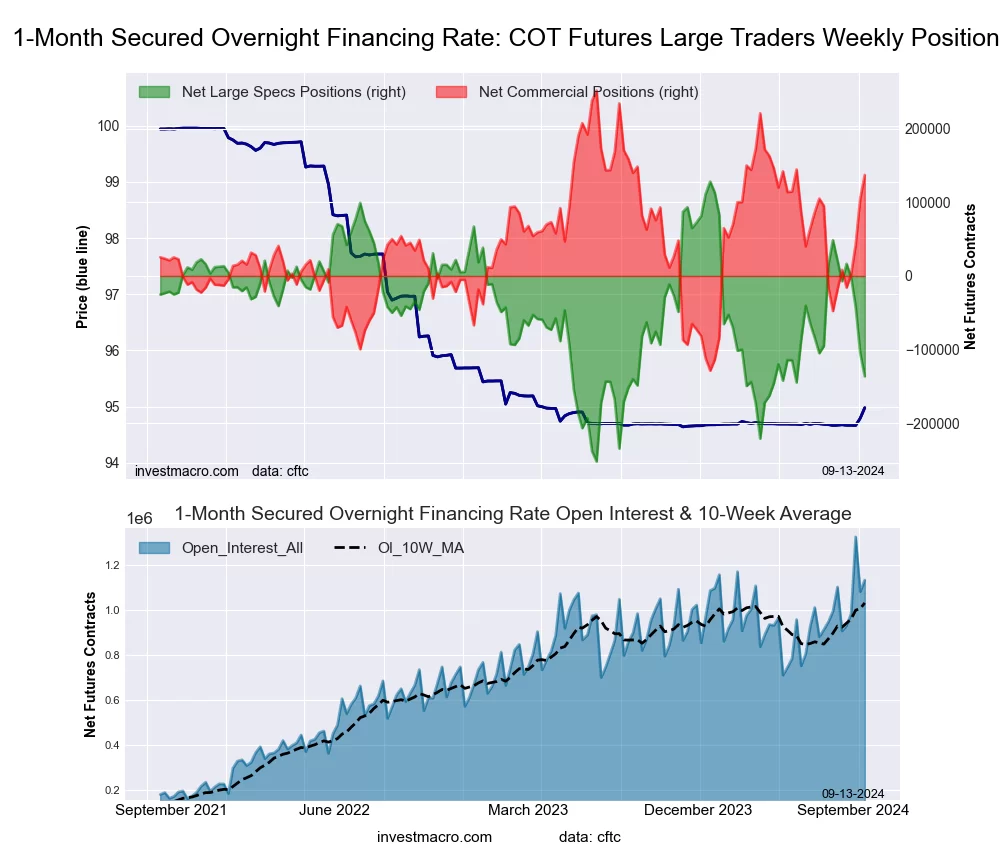 The Secured Overnight Financing Rate (1-Month) large speculator standing this week was a net position of -136,077 contracts in the data reported through Tuesday. This was a weekly reduction of -31,894 contracts from the previous week which had a total of -104,183 net contracts.
This week’s current strength score (the trader positioning range over the past three years, measured from 0 to 100) shows the speculators are currently Bearish with a score of 30.4 percent. The commercials are Bullish with a score of 69.9 percent and the small traders (not shown in chart) are Bearish with a score of 48.3 percent.
Price Trend-Following Model: Strong Uptrend
Our weekly trend-following model classifies the current market price position as: Strong Uptrend. The current action for the model is considered to be: Hold – Maintain Long Position.
| SOFR 1-Month Statistics | SPECULATORS | COMMERCIALS | SMALL TRADERS |
| – Percent of Open Interest Longs: | 15.4 | 66.8 | 0.0 |
| – Percent of Open Interest Shorts: | 27.4 | 54.7 | 0.1 |
| – Net Position: | -136,077 | 137,023 | -946 |
| – Gross Longs: | 175,113 | 757,537 | 312 |
| – Gross Shorts: | 311,190 | 620,514 | 1,258 |
| – Long to Short Ratio: | 0.6 to 1 | 1.2 to 1 | 0.2 to 1 |
| NET POSITION TREND: | |||
| – Strength Index Score (3 Year Range Pct): | 30.4 | 69.9 | 48.3 |
| – Strength Index Reading (3 Year Range): | Bearish | Bullish | Bearish |
| NET POSITION MOVEMENT INDEX: | |||
| – 6-Week Change in Strength Index: | -41.4 | 41.0 | 13.6 |
2-Year Treasury Note Futures:
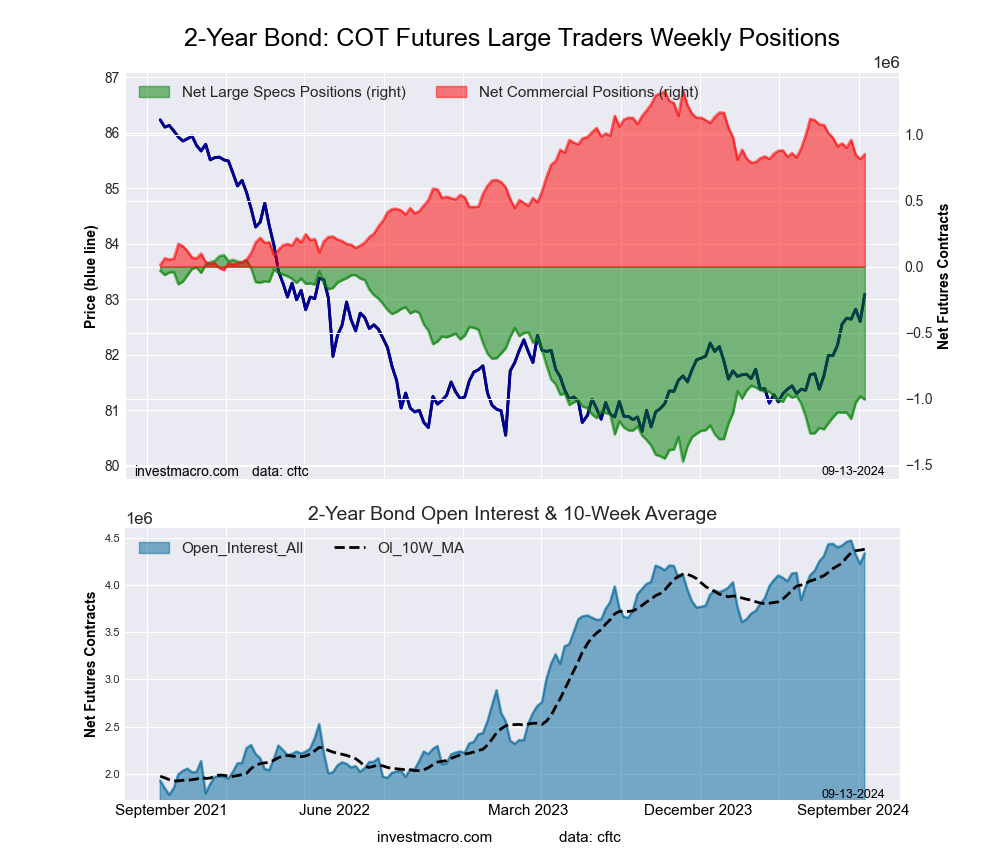 The 2-Year Treasury Note large speculator standing this week was a net position of -1,006,216 contracts in the data reported through Tuesday. This was a weekly decline of -23,754 contracts from the previous week which had a total of -982,462 net contracts.
This week’s current strength score (the trader positioning range over the past three years, measured from 0 to 100) shows the speculators are currently Bearish with a score of 30.0 percent. The commercials are Bullish with a score of 64.5 percent and the small traders (not shown in chart) are Bullish-Extreme with a score of 84.7 percent.
Price Trend-Following Model: Strong Uptrend
Our weekly trend-following model classifies the current market price position as: Strong Uptrend. The current action for the model is considered to be: Hold – Maintain Long Position.
| 2-Year Treasury Note Statistics | SPECULATORS | COMMERCIALS | SMALL TRADERS |
| – Percent of Open Interest Longs: | 15.4 | 76.7 | 6.2 |
| – Percent of Open Interest Shorts: | 38.6 | 57.1 | 2.6 |
| – Net Position: | -1,006,216 | 852,132 | 154,084 |
| – Gross Longs: | 666,817 | 3,328,782 | 269,001 |
| – Gross Shorts: | 1,673,033 | 2,476,650 | 114,917 |
| – Long to Short Ratio: | 0.4 to 1 | 1.3 to 1 | 2.3 to 1 |
| NET POSITION TREND: | |||
| – Strength Index Score (3 Year Range Pct): | 30.0 | 64.5 | 84.7 |
| – Strength Index Reading (3 Year Range): | Bearish | Bullish | Bullish-Extreme |
| NET POSITION MOVEMENT INDEX: | |||
| – 6-Week Change in Strength Index: | 6.2 | -4.3 | -12.1 |
5-Year Treasury Note Futures:
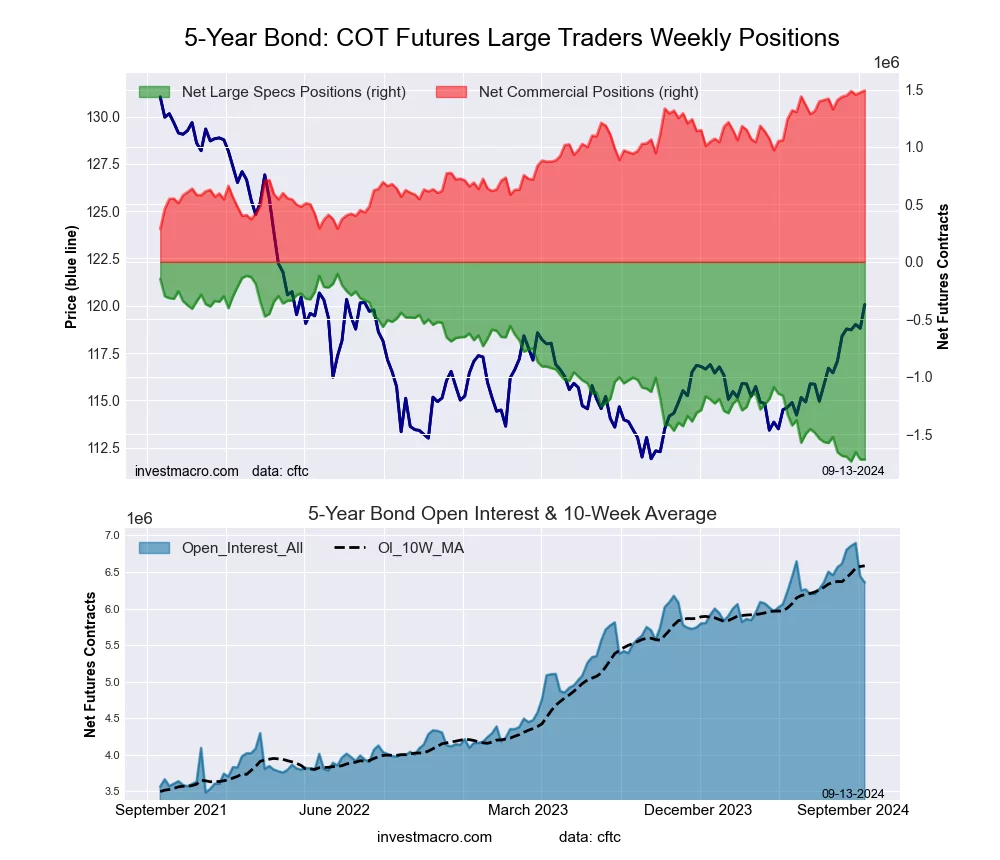 The 5-Year Treasury Note large speculator standing this week was a net position of -1,719,996 contracts in the data reported through Tuesday. This was a weekly fall of -1,300 contracts from the previous week which had a total of -1,718,696 net contracts.
This week’s current strength score (the trader positioning range over the past three years, measured from 0 to 100) shows the speculators are currently Bearish-Extreme with a score of 1.0 percent. The commercials are Bullish-Extreme with a score of 100.0 percent and the small traders (not shown in chart) are Bullish-Extreme with a score of 96.0 percent.
Price Trend-Following Model: Strong Uptrend
Our weekly trend-following model classifies the current market price position as: Strong Uptrend. The current action for the model is considered to be: Hold – Maintain Long Position.
| 5-Year Treasury Note Statistics | SPECULATORS | COMMERCIALS | SMALL TRADERS |
| – Percent of Open Interest Longs: | 8.2 | 83.4 | 7.4 |
| – Percent of Open Interest Shorts: | 35.3 | 59.9 | 3.8 |
| – Net Position: | -1,719,996 | 1,491,140 | 228,856 |
| – Gross Longs: | 522,020 | 5,302,218 | 472,348 |
| – Gross Shorts: | 2,242,016 | 3,811,078 | 243,492 |
| – Long to Short Ratio: | 0.2 to 1 | 1.4 to 1 | 1.9 to 1 |
| NET POSITION TREND: | |||
| – Strength Index Score (3 Year Range Pct): | 1.0 | 100.0 | 96.0 |
| – Strength Index Reading (3 Year Range): | Bearish-Extreme | Bullish-Extreme | Bullish-Extreme |
| NET POSITION MOVEMENT INDEX: | |||
| – 6-Week Change in Strength Index: | -3.9 | 6.9 | -3.5 |
10-Year Treasury Note Futures:
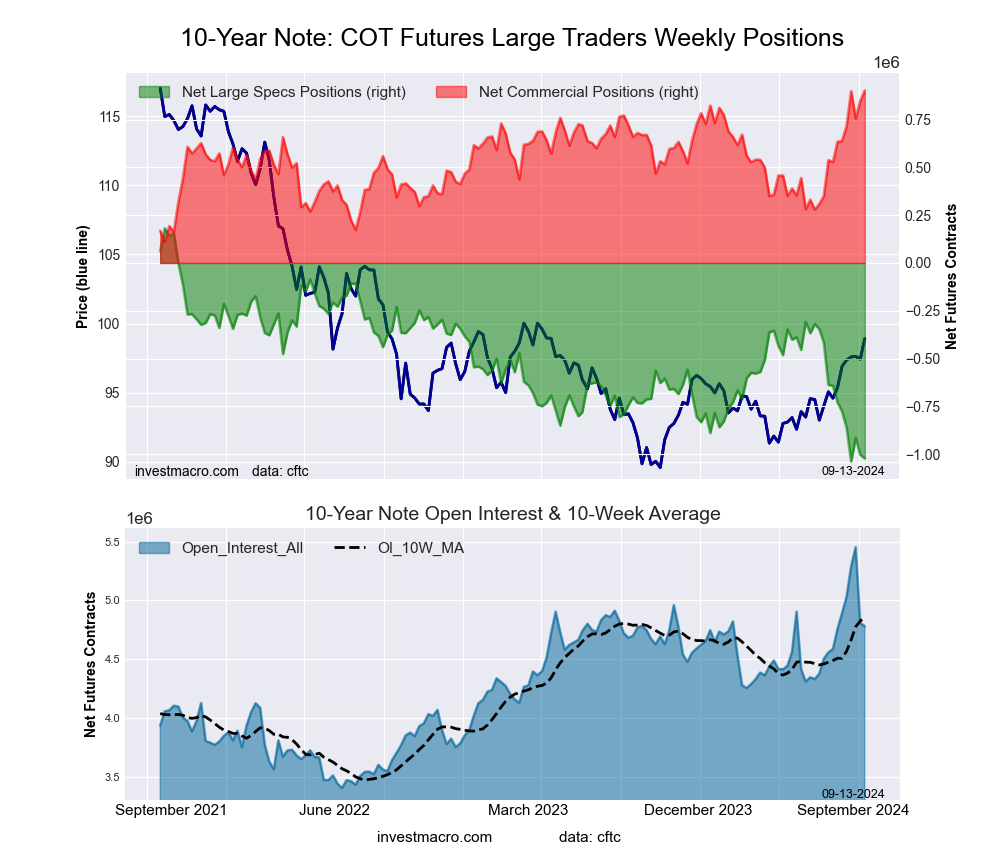 The 10-Year Treasury Note large speculator standing this week was a net position of -1,022,105 contracts in the data reported through Tuesday. This was a weekly decline of -19,278 contracts from the previous week which had a total of -1,002,827 net contracts.
This week’s current strength score (the trader positioning range over the past three years, measured from 0 to 100) shows the speculators are currently Bearish-Extreme with a score of 1.3 percent. The commercials are Bullish-Extreme with a score of 100.0 percent and the small traders (not shown in chart) are Bullish-Extreme with a score of 92.2 percent.
Price Trend-Following Model: Strong Uptrend
Our weekly trend-following model classifies the current market price position as: Strong Uptrend. The current action for the model is considered to be: Hold – Maintain Long Position.
| 10-Year Treasury Note Statistics | SPECULATORS | COMMERCIALS | SMALL TRADERS |
| – Percent of Open Interest Longs: | 8.6 | 79.5 | 9.9 |
| – Percent of Open Interest Shorts: | 29.9 | 60.6 | 7.4 |
| – Net Position: | -1,022,105 | 901,605 | 120,500 |
| – Gross Longs: | 409,121 | 3,799,096 | 474,433 |
| – Gross Shorts: | 1,431,226 | 2,897,491 | 353,933 |
| – Long to Short Ratio: | 0.3 to 1 | 1.3 to 1 | 1.3 to 1 |
| NET POSITION TREND: | |||
| – Strength Index Score (3 Year Range Pct): | 1.3 | 100.0 | 92.2 |
| – Strength Index Reading (3 Year Range): | Bearish-Extreme | Bullish-Extreme | Bullish-Extreme |
| NET POSITION MOVEMENT INDEX: | |||
| – 6-Week Change in Strength Index: | -24.1 | 33.8 | 5.2 |
Ultra 10-Year Notes Futures:
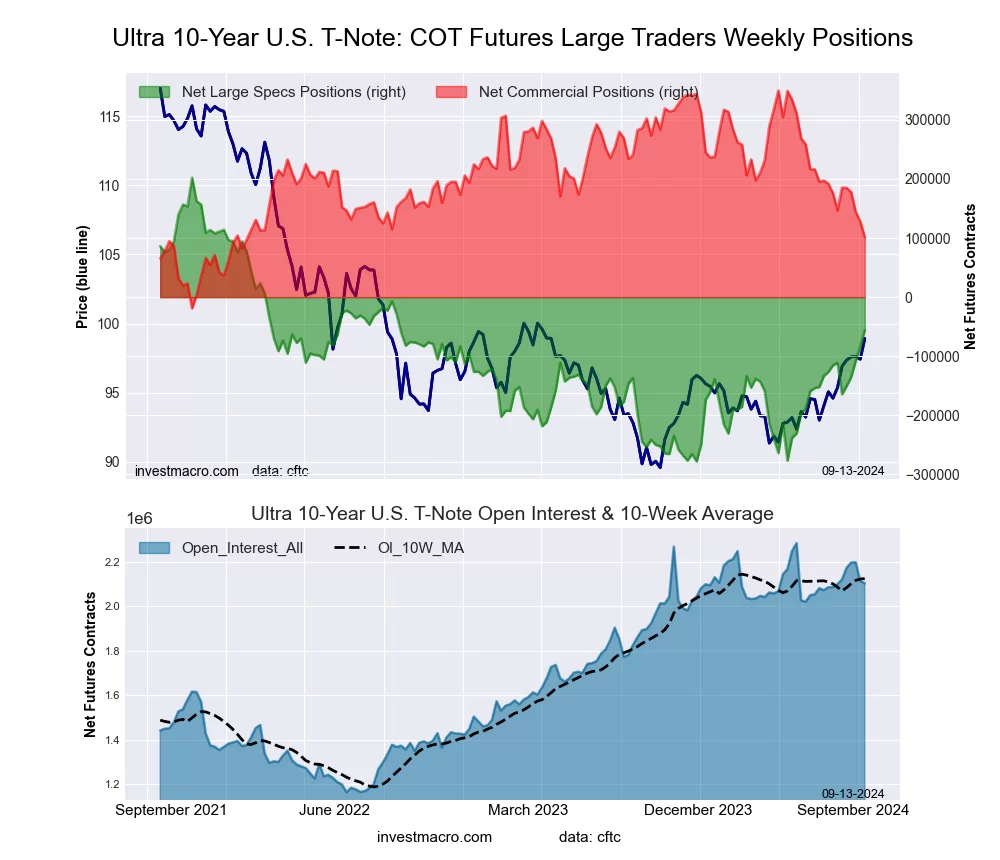 The Ultra 10-Year Notes large speculator standing this week was a net position of -56,146 contracts in the data reported through Tuesday. This was a weekly boost of 27,613 contracts from the previous week which had a total of -83,759 net contracts.
This week’s current strength score (the trader positioning range over the past three years, measured from 0 to 100) shows the speculators are currently Bearish with a score of 46.2 percent. The commercials are Bearish with a score of 32.6 percent and the small traders (not shown in chart) are Bullish-Extreme with a score of 85.8 percent.
Price Trend-Following Model: Weak Uptrend
Our weekly trend-following model classifies the current market price position as: Weak Uptrend. The current action for the model is considered to be: Hold – Maintain Long Position.
| Ultra 10-Year Notes Statistics | SPECULATORS | COMMERCIALS | SMALL TRADERS |
| – Percent of Open Interest Longs: | 14.8 | 74.0 | 10.3 |
| – Percent of Open Interest Shorts: | 17.5 | 69.2 | 12.4 |
| – Net Position: | -56,146 | 101,353 | -45,207 |
| – Gross Longs: | 311,481 | 1,557,384 | 216,428 |
| – Gross Shorts: | 367,627 | 1,456,031 | 261,635 |
| – Long to Short Ratio: | 0.8 to 1 | 1.1 to 1 | 0.8 to 1 |
| NET POSITION TREND: | |||
| – Strength Index Score (3 Year Range Pct): | 46.2 | 32.6 | 85.8 |
| – Strength Index Reading (3 Year Range): | Bearish | Bearish | Bullish-Extreme |
| NET POSITION MOVEMENT INDEX: | |||
| – 6-Week Change in Strength Index: | 11.4 | -12.3 | -5.5 |
US Treasury Bonds Futures:
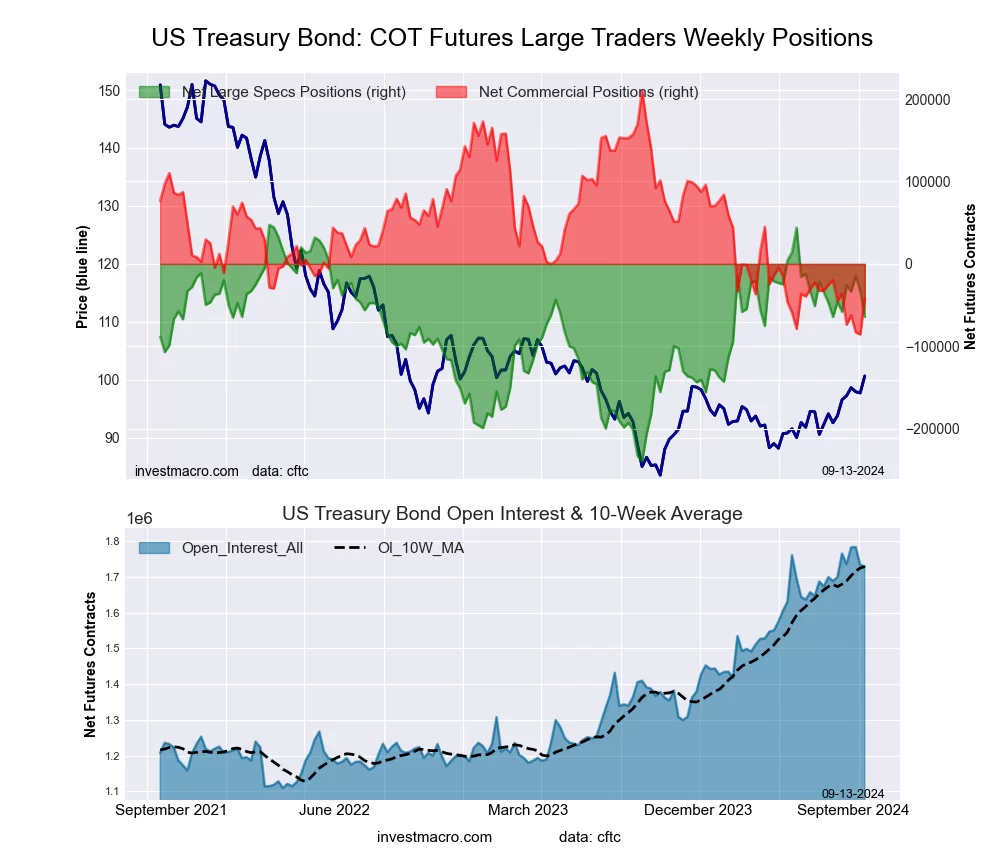 The US Treasury Bonds large speculator standing this week was a net position of -64,230 contracts in the data reported through Tuesday. This was a weekly fall of -31,186 contracts from the previous week which had a total of -33,044 net contracts.
This week’s current strength score (the trader positioning range over the past three years, measured from 0 to 100) shows the speculators are currently Bullish with a score of 61.1 percent. The commercials are Bearish-Extreme with a score of 14.9 percent and the small traders (not shown in chart) are Bullish-Extreme with a score of 91.1 percent.
Price Trend-Following Model: Strong Uptrend
Our weekly trend-following model classifies the current market price position as: Strong Uptrend. The current action for the model is considered to be: Hold – Maintain Long Position.
| US Treasury Bonds Statistics | SPECULATORS | COMMERCIALS | SMALL TRADERS |
| – Percent of Open Interest Longs: | 20.4 | 65.1 | 13.7 |
| – Percent of Open Interest Shorts: | 24.2 | 67.5 | 7.6 |
| – Net Position: | -64,230 | -41,310 | 105,540 |
| – Gross Longs: | 353,380 | 1,124,907 | 236,559 |
| – Gross Shorts: | 417,610 | 1,166,217 | 131,019 |
| – Long to Short Ratio: | 0.8 to 1 | 1.0 to 1 | 1.8 to 1 |
| NET POSITION TREND: | |||
| – Strength Index Score (3 Year Range Pct): | 61.1 | 14.9 | 91.1 |
| – Strength Index Reading (3 Year Range): | Bullish | Bearish-Extreme | Bullish-Extreme |
| NET POSITION MOVEMENT INDEX: | |||
| – 6-Week Change in Strength Index: | -6.4 | 1.3 | 9.8 |
Ultra US Treasury Bonds Futures:
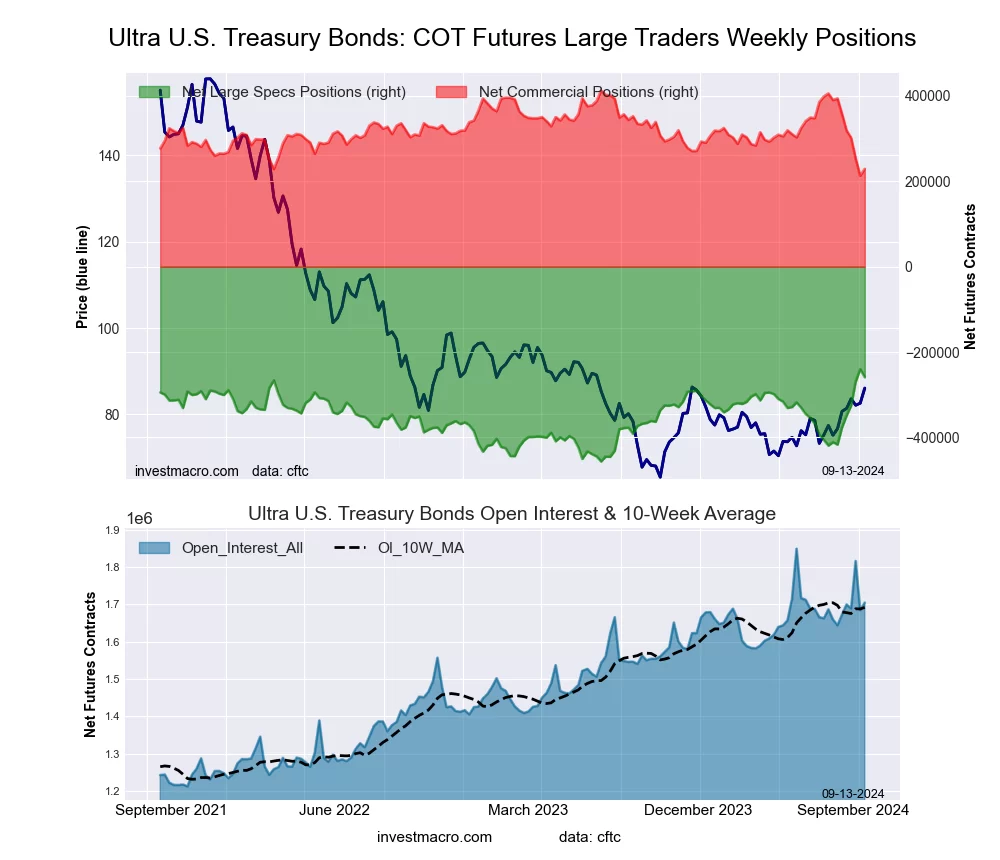 The Ultra US Treasury Bonds large speculator standing this week was a net position of -259,158 contracts in the data reported through Tuesday. This was a weekly reduction of -18,956 contracts from the previous week which had a total of -240,202 net contracts.
This week’s current strength score (the trader positioning range over the past three years, measured from 0 to 100) shows the speculators are currently Bullish-Extreme with a score of 91.2 percent. The commercials are Bearish-Extreme with a score of 8.2 percent and the small traders (not shown in chart) are Bullish with a score of 52.6 percent.
Price Trend-Following Model: Strong Uptrend
Our weekly trend-following model classifies the current market price position as: Strong Uptrend. The current action for the model is considered to be: Hold – Maintain Long Position.
| Ultra US Treasury Bonds Statistics | SPECULATORS | COMMERCIALS | SMALL TRADERS |
| – Percent of Open Interest Longs: | 9.9 | 78.0 | 11.3 |
| – Percent of Open Interest Shorts: | 25.1 | 64.5 | 9.5 |
| – Net Position: | -259,158 | 229,154 | 30,004 |
| – Gross Longs: | 168,767 | 1,329,192 | 192,521 |
| – Gross Shorts: | 427,925 | 1,100,038 | 162,517 |
| – Long to Short Ratio: | 0.4 to 1 | 1.2 to 1 | 1.2 to 1 |
| NET POSITION TREND: | |||
| – Strength Index Score (3 Year Range Pct): | 91.2 | 8.2 | 52.6 |
| – Strength Index Reading (3 Year Range): | Bullish-Extreme | Bearish-Extreme | Bullish |
| NET POSITION MOVEMENT INDEX: | |||
| – 6-Week Change in Strength Index: | 73.0 | -82.5 | 9.1 |
Article By InvestMacro – Receive our weekly COT Newsletter
*COT Report: The COT data, released weekly to the public each Friday, is updated through the most recent Tuesday (data is 3 days old) and shows a quick view of how large speculators or non-commercials (for-profit traders) were positioned in the futures markets.
The CFTC categorizes trader positions according to commercial hedgers (traders who use futures contracts for hedging as part of the business), non-commercials (large traders who speculate to realize trading profits) and nonreportable traders (usually small traders/speculators) as well as their open interest (contracts open in the market at time of reporting). See CFTC criteria here.