By InvestMacro
Here are the latest charts and statistics for the Commitment of Traders (COT) reports data published by the Commodities Futures Trading Commission (CFTC).
The latest COT data is updated through Tuesday September 3rd and shows a quick view of how large traders (for-profit speculators and commercial entities) were positioned in the futures markets.
Weekly Speculator Changes led by Corn & Sugar
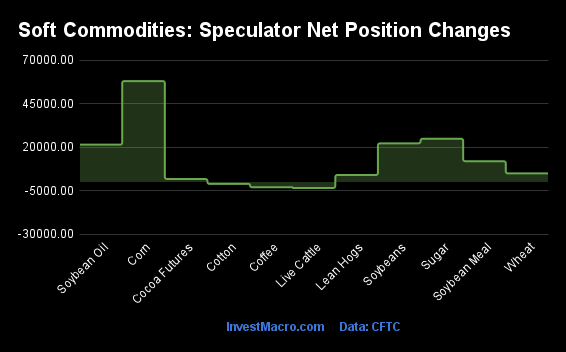
The COT soft commodities markets speculator bets were higher this week as eight out of the eleven softs markets we cover had higher positioning while the other three markets had lower speculator contracts.
Leading the gains for the softs markets was Corn (58,051 contracts) with Sugar (24,887 contracts), Soybeans (22,241 contracts), Soybean Oil (21,488 contracts), Soybean Meal (11,966 contracts), Wheat (4,939 contracts), Lean Hogs (4,043 contracts) and Cocoa (1,738 contracts) also showing positive weeks.
The markets with the declines in speculator bets this week were Live Cattle (-3,440 contracts), Cotton (-1,079 contracts) and with Coffee (-2,986 contracts) also registering lower bets on the week.
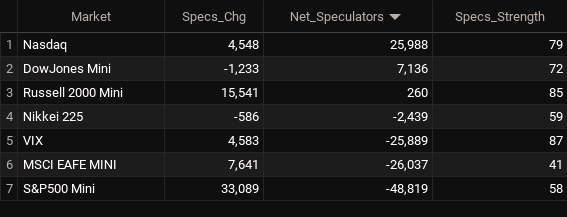
Soft Commodities Net Speculators Leaderboard
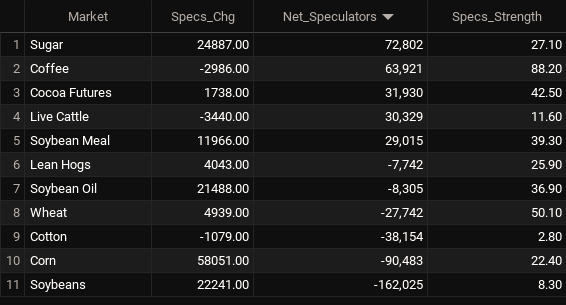
Legend: Weekly Speculators Change | Speculators Current Net Position | Speculators Strength Score compared to last 3-Years (0-100 range)
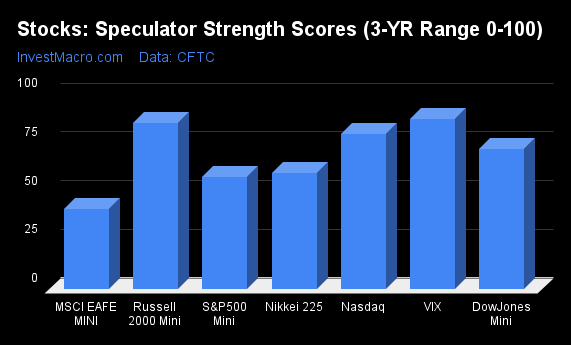
Strength Scores led by Coffee
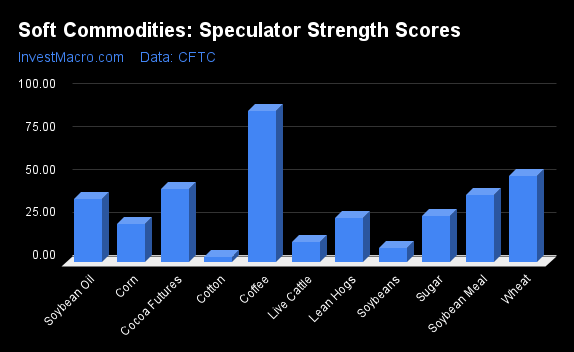
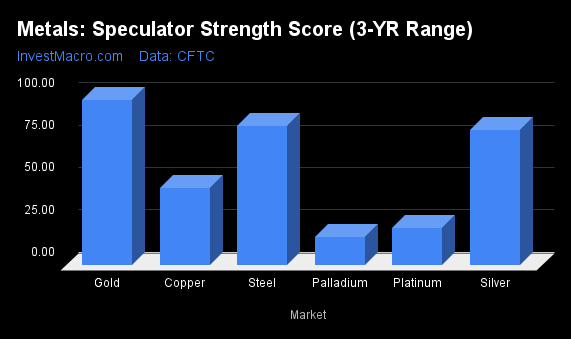
COT Strength Scores (a normalized measure of Speculator positions over a 3-Year range, from 0 to 100 where above 80 is Extreme-Bullish and below 20 is Extreme-Bearish) showed that Coffee (88 percent) leads the softs markets this week. Wheat (50 percent) comes in as the next highest in the weekly strength scores.
On the downside, Cotton (3 percent), Soybeans (8 percent) and Live Cattle (12 percent) come in at the lowest strength levels currently and are in Extreme-Bearish territory (below 20 percent).
Strength Statistics:
Corn (22.4 percent) vs Corn previous week (15.0 percent)
Sugar (27.1 percent) vs Sugar previous week (18.3 percent)
Coffee (88.2 percent) vs Coffee previous week (91.1 percent)
Soybeans (8.3 percent) vs Soybeans previous week (3.1 percent)
Soybean Oil (36.9 percent) vs Soybean Oil previous week (25.1 percent)
Soybean Meal (39.3 percent) vs Soybean Meal previous week (34.4 percent)
Live Cattle (11.6 percent) vs Live Cattle previous week (15.3 percent)
Lean Hogs (25.9 percent) vs Lean Hogs previous week (22.2 percent)
Cotton (2.8 percent) vs Cotton previous week (3.5 percent)
Cocoa (42.5 percent) vs Cocoa previous week (40.8 percent)
Wheat (50.1 percent) vs Wheat previous week (46.5 percent)
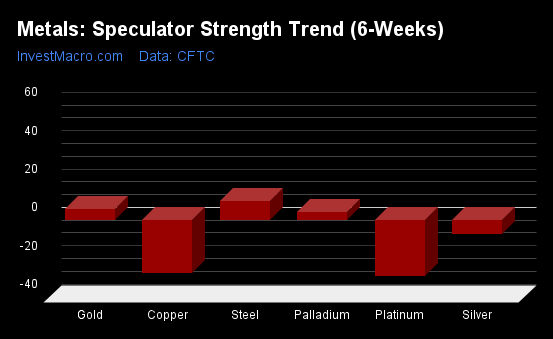
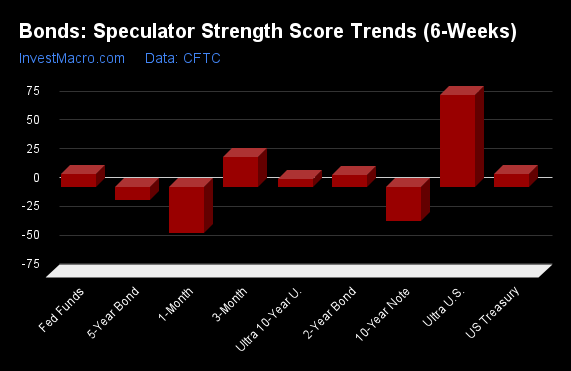
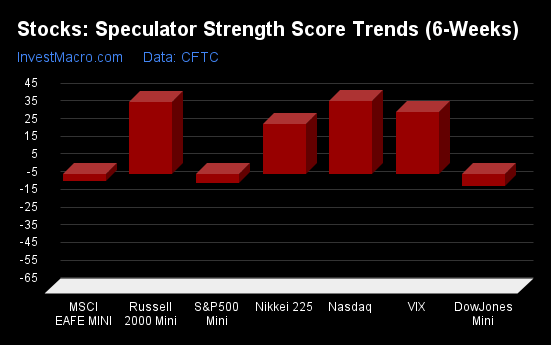
Corn & Lean Hogs top the 6-Week Strength Trends
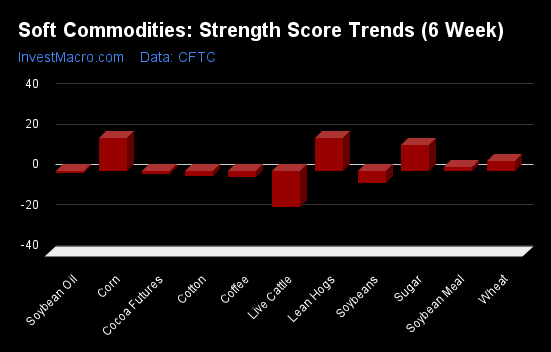
COT Strength Score Trends (or move index, calculates the 6-week changes in strength scores) showed that Corn (17 percent) and Lean Hogs (17 percent) lead the past six weeks trends for soft commodities. Sugar (13 percent), Wheat (5 percent) and Soybean Meal (2 percent) are the next highest positive movers in the latest trends data.
Live Cattle (-18 percent) leads the downside trend scores currently with Soybeans (-6 percent), Coffee (-3 percent) and Cotton (-2 percent) following next with lower trend scores.
Strength Trend Statistics:
Corn (16.7 percent) vs Corn previous week (11.5 percent)
Sugar (13.2 percent) vs Sugar previous week (-6.9 percent)
Coffee (-2.5 percent) vs Coffee previous week (-4.0 percent)
Soybeans (-5.6 percent) vs Soybeans previous week (-5.4 percent)
Soybean Oil (-0.7 percent) vs Soybean Oil previous week (-17.4 percent)
Soybean Meal (2.1 percent) vs Soybean Meal previous week (-6.8 percent)
Live Cattle (-17.7 percent) vs Live Cattle previous week (-14.5 percent)
Lean Hogs (16.5 percent) vs Lean Hogs previous week (13.3 percent)
Cotton (-2.4 percent) vs Cotton previous week (-6.4 percent)
Cocoa (-1.4 percent) vs Cocoa previous week (-2.1 percent)
Wheat (5.0 percent) vs Wheat previous week (2.4 percent)
Individual Soft Commodities Markets:
CORN Futures:
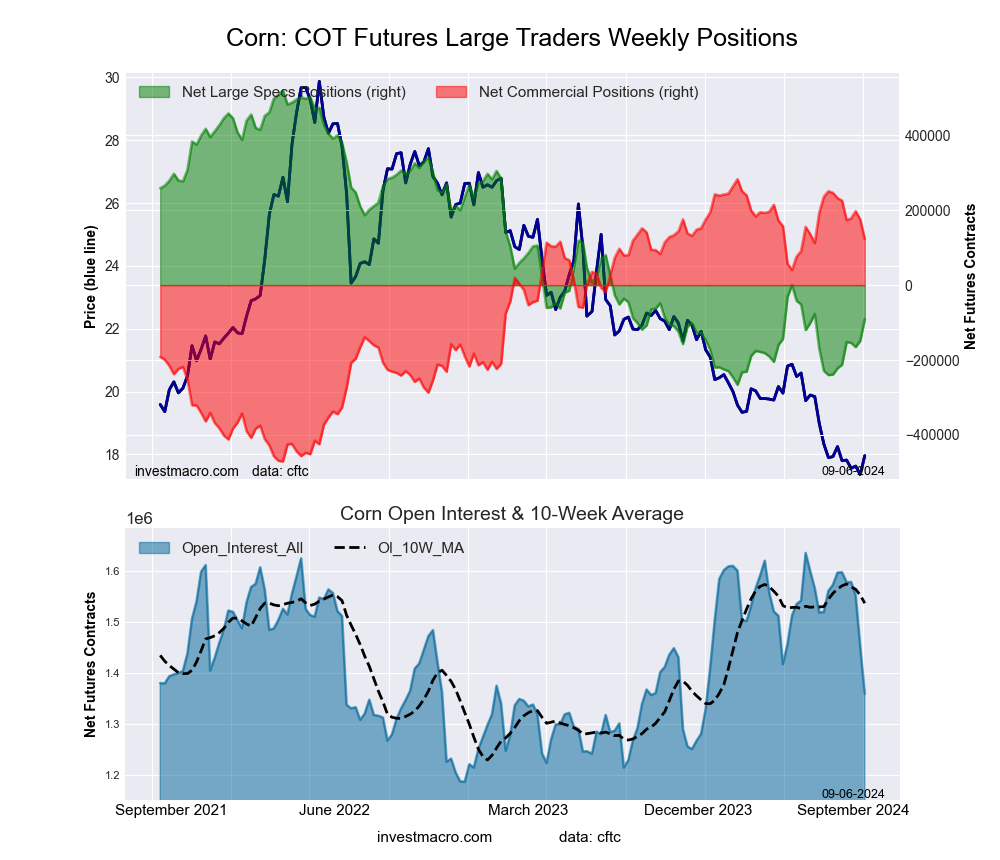 The CORN large speculator standing this week resulted in a net position of -90,483 contracts in the data reported through Tuesday. This was a weekly boost of 58,051 contracts from the previous week which had a total of -148,534 net contracts.
This week’s current strength score (the trader positioning range over the past three years, measured from 0 to 100) shows the speculators are currently Bearish with a score of 22.4 percent. The commercials are Bullish with a score of 78.8 percent and the small traders (not shown in chart) are Bullish with a score of 64.6 percent.
Price Trend-Following Model: Downtrend
Our weekly trend-following model classifies the current market price position as: Downtrend. The current action for the model is considered to be: Hold – Maintain Short Position.
| CORN Futures Statistics | SPECULATORS | COMMERCIALS | SMALL TRADERS |
| – Percent of Open Interest Longs: | 24.7 | 44.5 | 9.6 |
| – Percent of Open Interest Shorts: | 31.3 | 35.5 | 12.0 |
| – Net Position: | -90,483 | 122,906 | -32,423 |
| – Gross Longs: | 335,231 | 605,741 | 131,166 |
| – Gross Shorts: | 425,714 | 482,835 | 163,589 |
| – Long to Short Ratio: | 0.8 to 1 | 1.3 to 1 | 0.8 to 1 |
| NET POSITION TREND: | | | |
| – Strength Index Score (3 Year Range Pct): | 22.4 | 78.8 | 64.6 |
| – Strength Index Reading (3 Year Range): | Bearish | Bullish | Bullish |
| NET POSITION MOVEMENT INDEX: | | | |
| – 6-Week Change in Strength Index: | 16.7 | -14.5 | -29.4 |
SUGAR Futures:
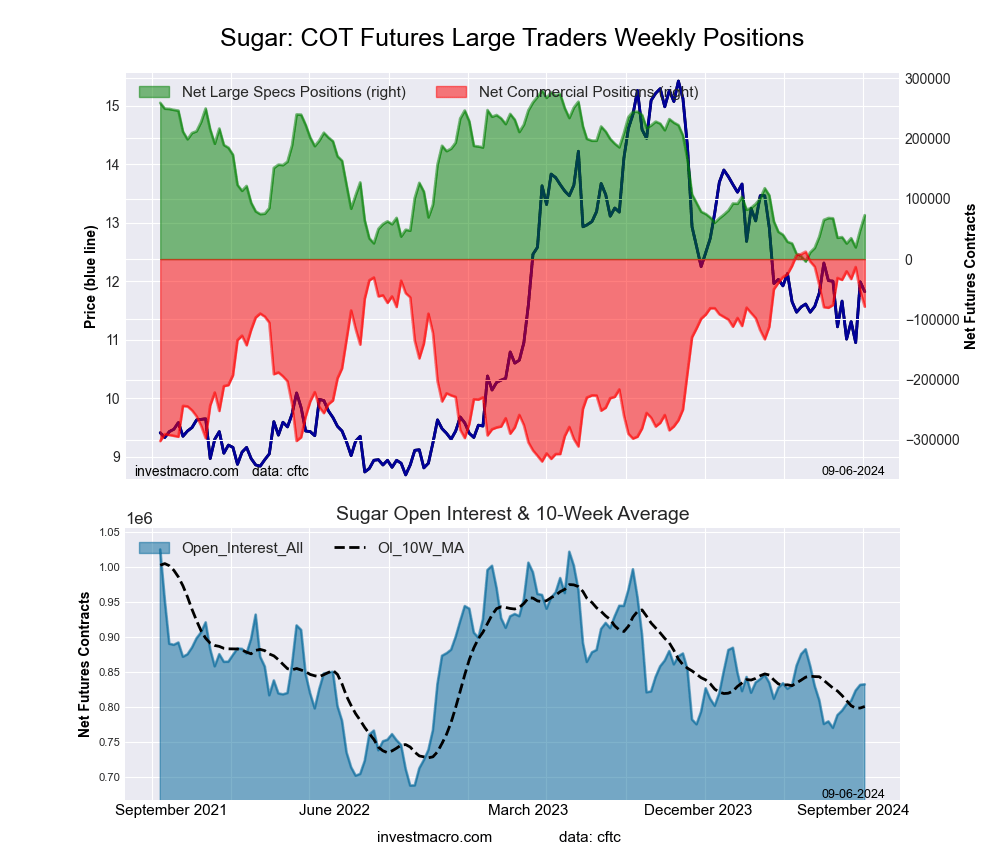 The SUGAR large speculator standing this week resulted in a net position of 72,802 contracts in the data reported through Tuesday. This was a weekly advance of 24,887 contracts from the previous week which had a total of 47,915 net contracts.
This week’s current strength score (the trader positioning range over the past three years, measured from 0 to 100) shows the speculators are currently Bearish with a score of 27.1 percent. The commercials are Bullish with a score of 73.8 percent and the small traders (not shown in chart) are Bearish with a score of 27.5 percent.
Price Trend-Following Model: Downtrend
Our weekly trend-following model classifies the current market price position as: Downtrend. The current action for the model is considered to be: Hold – Maintain Short Position.
| SUGAR Futures Statistics | SPECULATORS | COMMERCIALS | SMALL TRADERS |
| – Percent of Open Interest Longs: | 22.3 | 54.8 | 8.0 |
| – Percent of Open Interest Shorts: | 13.5 | 64.2 | 7.2 |
| – Net Position: | 72,802 | -78,891 | 6,089 |
| – Gross Longs: | 185,306 | 455,449 | 66,162 |
| – Gross Shorts: | 112,504 | 534,340 | 60,073 |
| – Long to Short Ratio: | 1.6 to 1 | 0.9 to 1 | 1.1 to 1 |
| NET POSITION TREND: | | | |
| – Strength Index Score (3 Year Range Pct): | 27.1 | 73.8 | 27.5 |
| – Strength Index Reading (3 Year Range): | Bearish | Bullish | Bearish |
| NET POSITION MOVEMENT INDEX: | | | |
| – 6-Week Change in Strength Index: | 13.2 | -13.7 | 13.0 |
COFFEE Futures:
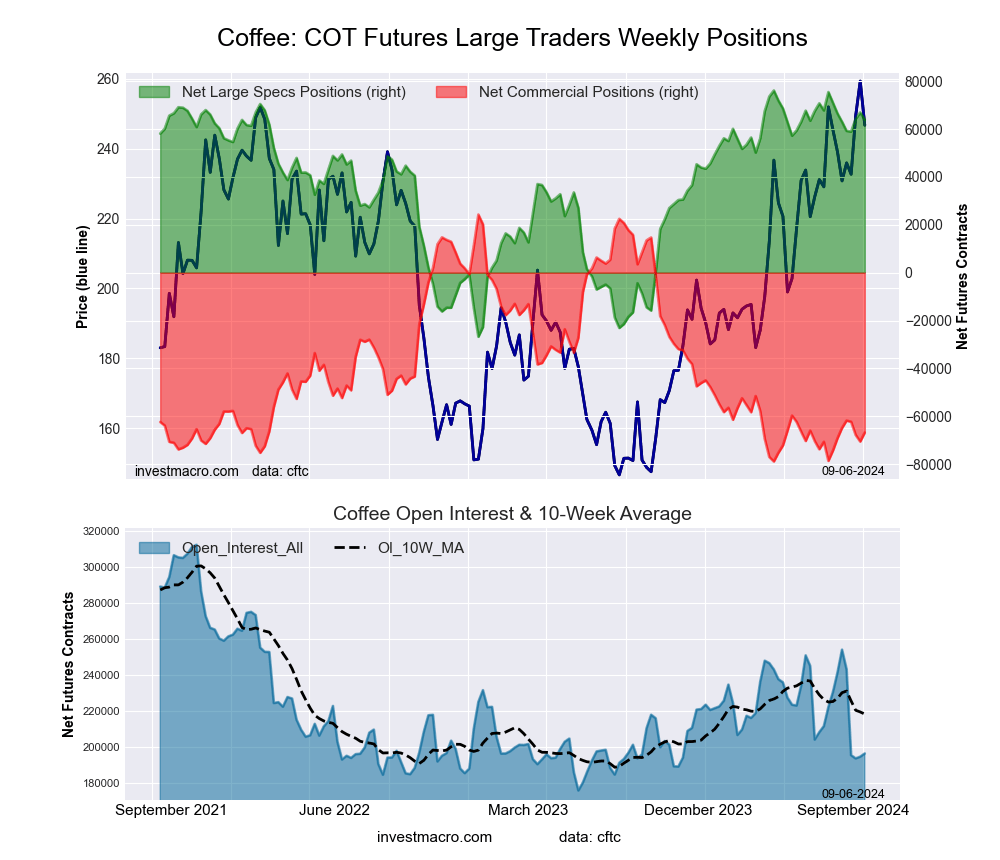 The COFFEE large speculator standing this week resulted in a net position of 63,921 contracts in the data reported through Tuesday. This was a weekly fall of -2,986 contracts from the previous week which had a total of 66,907 net contracts.
This week’s current strength score (the trader positioning range over the past three years, measured from 0 to 100) shows the speculators are currently Bullish-Extreme with a score of 88.2 percent. The commercials are Bearish-Extreme with a score of 11.7 percent and the small traders (not shown in chart) are Bullish with a score of 60.3 percent.
Price Trend-Following Model: Strong Uptrend
Our weekly trend-following model classifies the current market price position as: Strong Uptrend. The current action for the model is considered to be: Hold – Maintain Long Position.
| COFFEE Futures Statistics | SPECULATORS | COMMERCIALS | SMALL TRADERS |
| – Percent of Open Interest Longs: | 41.1 | 37.5 | 4.1 |
| – Percent of Open Interest Shorts: | 8.5 | 71.5 | 2.6 |
| – Net Position: | 63,921 | -66,756 | 2,835 |
| – Gross Longs: | 80,574 | 73,587 | 8,016 |
| – Gross Shorts: | 16,653 | 140,343 | 5,181 |
| – Long to Short Ratio: | 4.8 to 1 | 0.5 to 1 | 1.5 to 1 |
| NET POSITION TREND: | | | |
| – Strength Index Score (3 Year Range Pct): | 88.2 | 11.7 | 60.3 |
| – Strength Index Reading (3 Year Range): | Bullish-Extreme | Bearish-Extreme | Bullish |
| NET POSITION MOVEMENT INDEX: | | | |
| – 6-Week Change in Strength Index: | -2.5 | 2.3 | 2.4 |
SOYBEANS Futures:
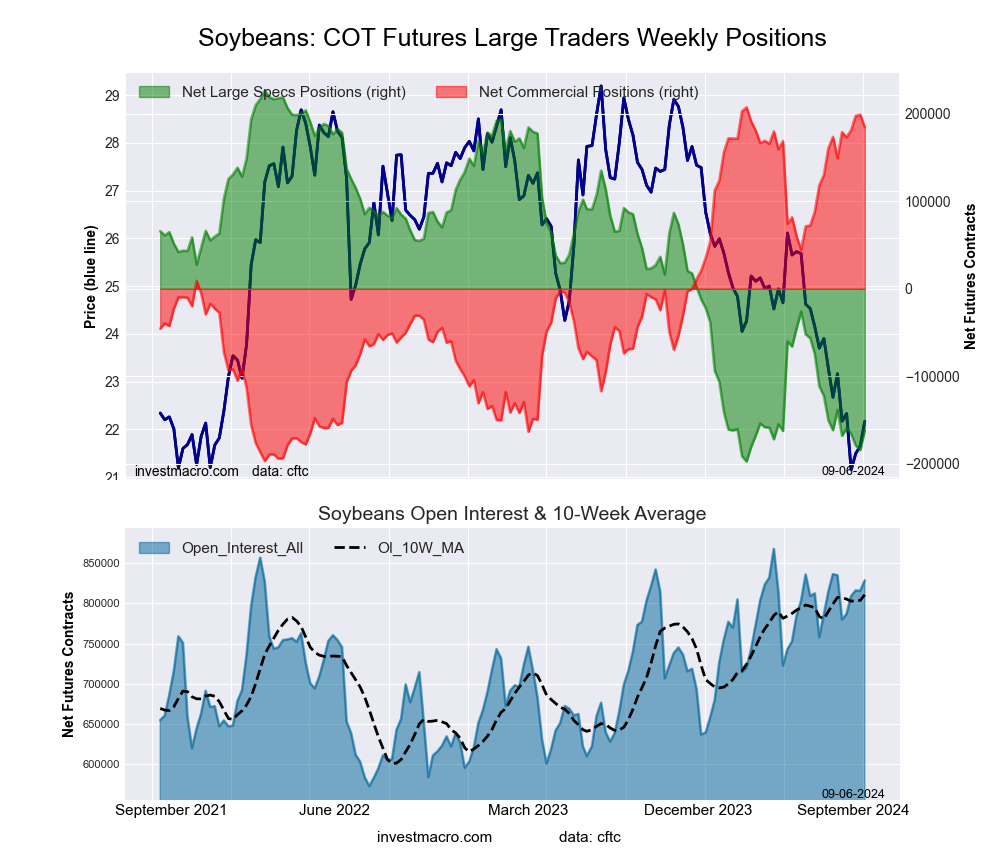 The SOYBEANS large speculator standing this week resulted in a net position of -162,025 contracts in the data reported through Tuesday. This was a weekly advance of 22,241 contracts from the previous week which had a total of -184,266 net contracts.
This week’s current strength score (the trader positioning range over the past three years, measured from 0 to 100) shows the speculators are currently Bearish-Extreme with a score of 8.3 percent. The commercials are Bullish-Extreme with a score of 94.4 percent and the small traders (not shown in chart) are Bullish with a score of 53.6 percent.
Price Trend-Following Model: Downtrend
Our weekly trend-following model classifies the current market price position as: Downtrend. The current action for the model is considered to be: Hold – Maintain Short Position.
| SOYBEANS Futures Statistics | SPECULATORS | COMMERCIALS | SMALL TRADERS |
| – Percent of Open Interest Longs: | 13.4 | 65.0 | 4.8 |
| – Percent of Open Interest Shorts: | 33.0 | 42.7 | 7.5 |
| – Net Position: | -162,025 | 184,576 | -22,551 |
| – Gross Longs: | 111,107 | 538,620 | 39,691 |
| – Gross Shorts: | 273,132 | 354,044 | 62,242 |
| – Long to Short Ratio: | 0.4 to 1 | 1.5 to 1 | 0.6 to 1 |
| NET POSITION TREND: | | | |
| – Strength Index Score (3 Year Range Pct): | 8.3 | 94.4 | 53.6 |
| – Strength Index Reading (3 Year Range): | Bearish-Extreme | Bullish-Extreme | Bullish |
| NET POSITION MOVEMENT INDEX: | | | |
| – 6-Week Change in Strength Index: | -5.6 | 8.7 | -30.6 |
SOYBEAN OIL Futures:
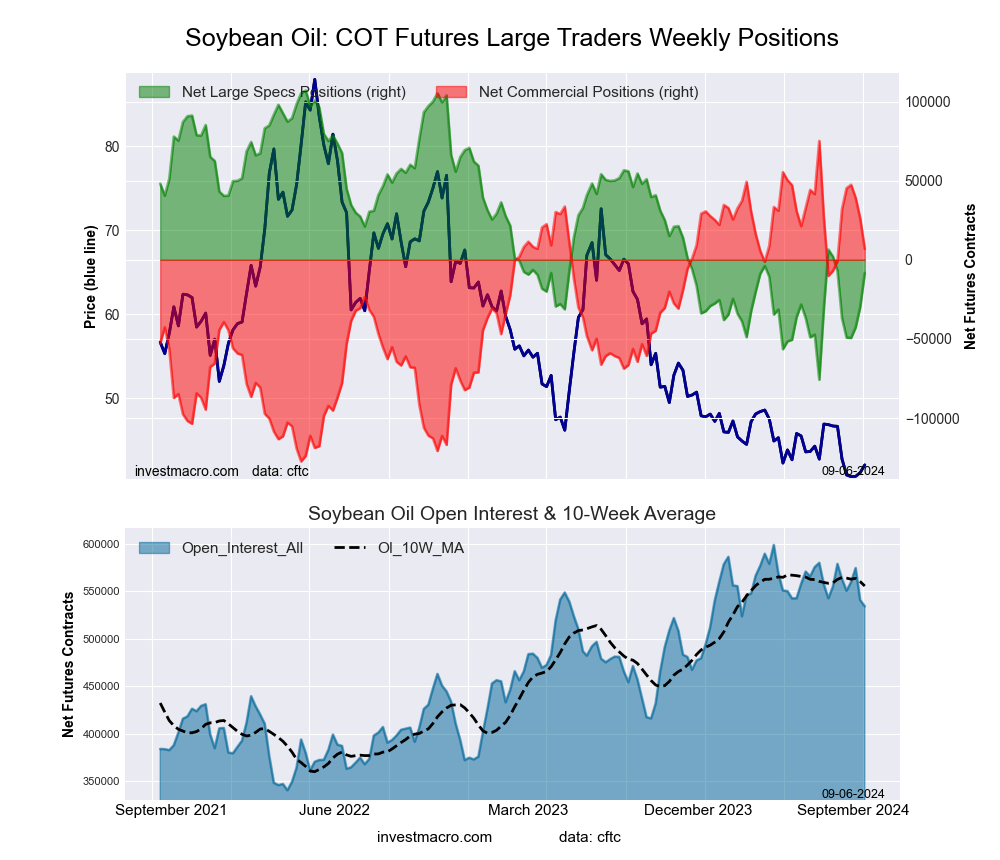 The SOYBEAN OIL large speculator standing this week resulted in a net position of -8,305 contracts in the data reported through Tuesday. This was a weekly gain of 21,488 contracts from the previous week which had a total of -29,793 net contracts.
This week’s current strength score (the trader positioning range over the past three years, measured from 0 to 100) shows the speculators are currently Bearish with a score of 36.9 percent. The commercials are Bullish with a score of 66.3 percent and the small traders (not shown in chart) are Bearish-Extreme with a score of 19.5 percent.
Price Trend-Following Model: Strong Downtrend
Our weekly trend-following model classifies the current market price position as: Strong Downtrend. The current action for the model is considered to be: Hold – Maintain Short Position.
| SOYBEAN OIL Futures Statistics | SPECULATORS | COMMERCIALS | SMALL TRADERS |
| – Percent of Open Interest Longs: | 25.0 | 53.1 | 5.0 |
| – Percent of Open Interest Shorts: | 26.6 | 51.8 | 4.8 |
| – Net Position: | -8,305 | 6,912 | 1,393 |
| – Gross Longs: | 133,596 | 283,945 | 26,951 |
| – Gross Shorts: | 141,901 | 277,033 | 25,558 |
| – Long to Short Ratio: | 0.9 to 1 | 1.0 to 1 | 1.1 to 1 |
| NET POSITION TREND: | | | |
| – Strength Index Score (3 Year Range Pct): | 36.9 | 66.3 | 19.5 |
| – Strength Index Reading (3 Year Range): | Bearish | Bullish | Bearish-Extreme |
| NET POSITION MOVEMENT INDEX: | | | |
| – 6-Week Change in Strength Index: | -0.7 | 3.9 | -25.4 |
SOYBEAN MEAL Futures:
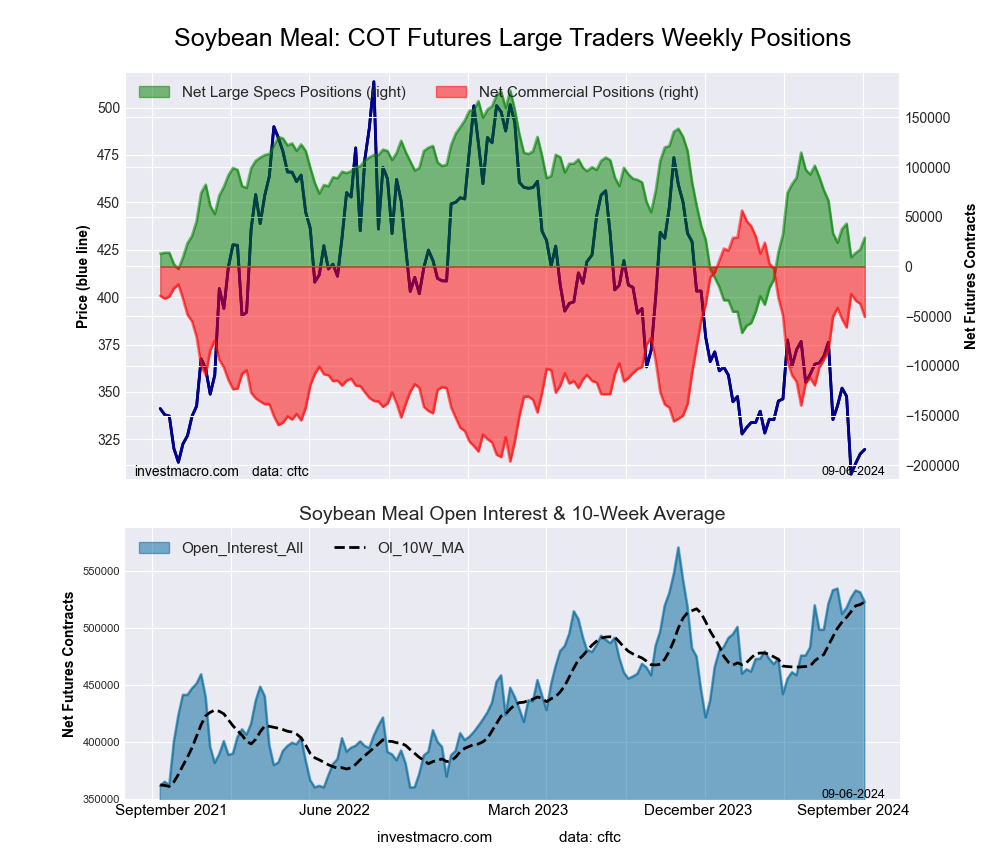 The SOYBEAN MEAL large speculator standing this week resulted in a net position of 29,015 contracts in the data reported through Tuesday. This was a weekly gain of 11,966 contracts from the previous week which had a total of 17,049 net contracts.
This week’s current strength score (the trader positioning range over the past three years, measured from 0 to 100) shows the speculators are currently Bearish with a score of 39.3 percent. The commercials are Bullish with a score of 57.6 percent and the small traders (not shown in chart) are Bullish with a score of 53.1 percent.
Price Trend-Following Model: Strong Downtrend
Our weekly trend-following model classifies the current market price position as: Strong Downtrend. The current action for the model is considered to be: Hold – Maintain Short Position.
| SOYBEAN MEAL Futures Statistics | SPECULATORS | COMMERCIALS | SMALL TRADERS |
| – Percent of Open Interest Longs: | 23.5 | 46.4 | 9.3 |
| – Percent of Open Interest Shorts: | 17.9 | 56.1 | 5.1 |
| – Net Position: | 29,015 | -50,660 | 21,645 |
| – Gross Longs: | 122,853 | 242,812 | 48,556 |
| – Gross Shorts: | 93,838 | 293,472 | 26,911 |
| – Long to Short Ratio: | 1.3 to 1 | 0.8 to 1 | 1.8 to 1 |
| NET POSITION TREND: | | | |
| – Strength Index Score (3 Year Range Pct): | 39.3 | 57.6 | 53.1 |
| – Strength Index Reading (3 Year Range): | Bearish | Bullish | Bullish |
| NET POSITION MOVEMENT INDEX: | | | |
| – 6-Week Change in Strength Index: | 2.1 | -3.6 | 18.1 |
LIVE CATTLE Futures:
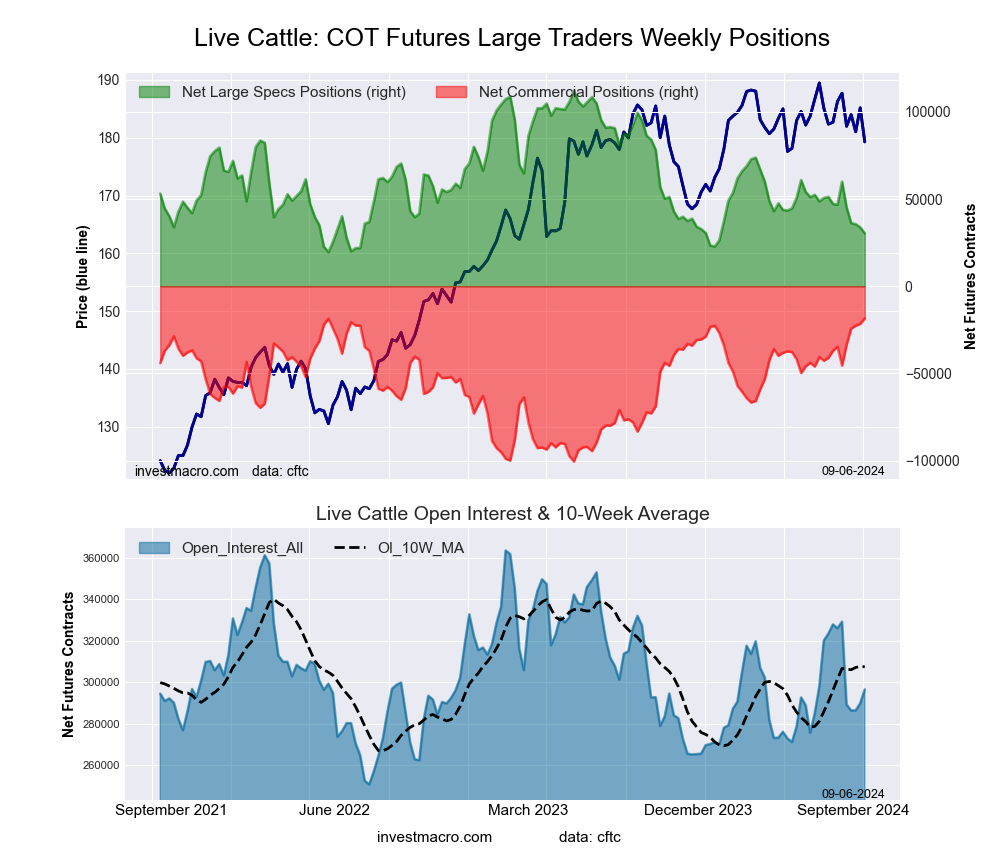 The LIVE CATTLE large speculator standing this week resulted in a net position of 30,329 contracts in the data reported through Tuesday. This was a weekly lowering of -3,440 contracts from the previous week which had a total of 33,769 net contracts.
This week’s current strength score (the trader positioning range over the past three years, measured from 0 to 100) shows the speculators are currently Bearish-Extreme with a score of 11.6 percent. The commercials are Bullish-Extreme with a score of 100.0 percent and the small traders (not shown in chart) are Bearish with a score of 26.0 percent.
Price Trend-Following Model: Weak Uptrend
Our weekly trend-following model classifies the current market price position as: Weak Uptrend. The current action for the model is considered to be: Hold – Maintain Long Position.
| LIVE CATTLE Futures Statistics | SPECULATORS | COMMERCIALS | SMALL TRADERS |
| – Percent of Open Interest Longs: | 32.1 | 36.9 | 9.0 |
| – Percent of Open Interest Shorts: | 21.9 | 43.1 | 13.0 |
| – Net Position: | 30,329 | -18,370 | -11,959 |
| – Gross Longs: | 95,135 | 109,383 | 26,606 |
| – Gross Shorts: | 64,806 | 127,753 | 38,565 |
| – Long to Short Ratio: | 1.5 to 1 | 0.9 to 1 | 0.7 to 1 |
| NET POSITION TREND: | | | |
| – Strength Index Score (3 Year Range Pct): | 11.6 | 100.0 | 26.0 |
| – Strength Index Reading (3 Year Range): | Bearish-Extreme | Bullish-Extreme | Bearish |
| NET POSITION MOVEMENT INDEX: | | | |
| – 6-Week Change in Strength Index: | -17.7 | 19.8 | 0.8 |
LEAN HOGS Futures:
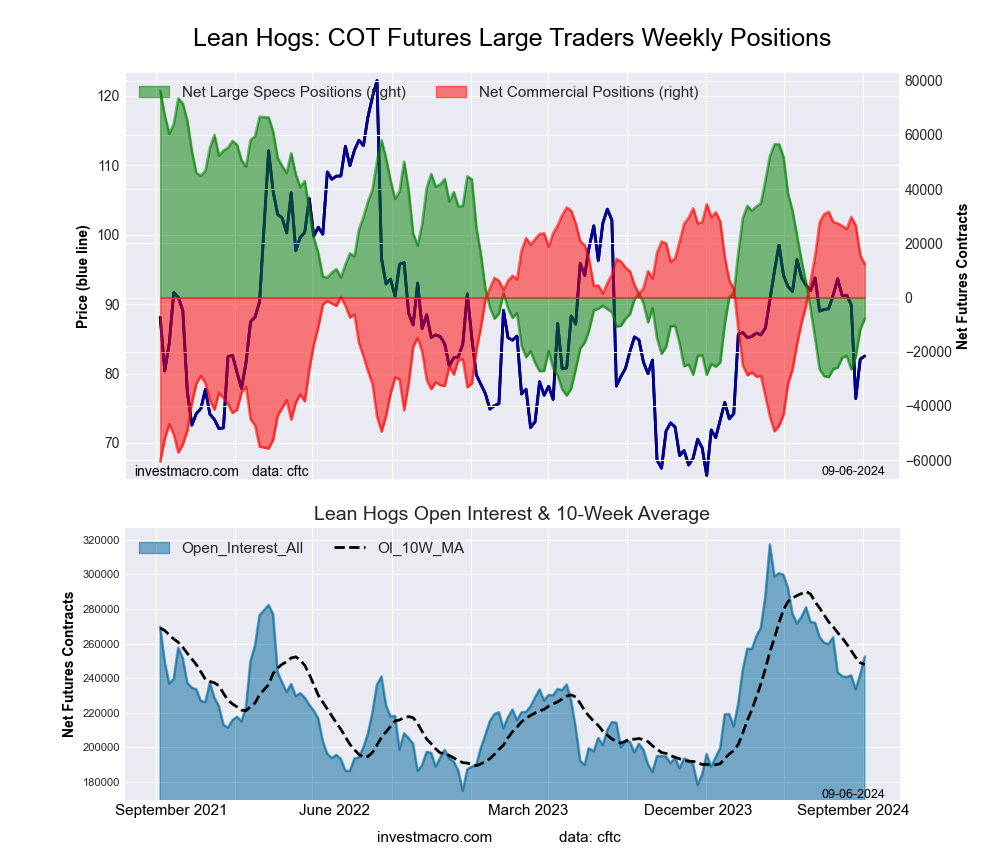 The LEAN HOGS large speculator standing this week resulted in a net position of -7,742 contracts in the data reported through Tuesday. This was a weekly lift of 4,043 contracts from the previous week which had a total of -11,785 net contracts.
This week’s current strength score (the trader positioning range over the past three years, measured from 0 to 100) shows the speculators are currently Bearish with a score of 25.9 percent. The commercials are Bullish with a score of 75.8 percent and the small traders (not shown in chart) are Bullish with a score of 62.7 percent.
Price Trend-Following Model: Strong Downtrend
Our weekly trend-following model classifies the current market price position as: Strong Downtrend. The current action for the model is considered to be: Hold – Maintain Short Position.
| LEAN HOGS Futures Statistics | SPECULATORS | COMMERCIALS | SMALL TRADERS |
| – Percent of Open Interest Longs: | 38.5 | 38.0 | 7.0 |
| – Percent of Open Interest Shorts: | 41.6 | 33.1 | 8.8 |
| – Net Position: | -7,742 | 12,341 | -4,599 |
| – Gross Longs: | 97,199 | 95,993 | 17,559 |
| – Gross Shorts: | 104,941 | 83,652 | 22,158 |
| – Long to Short Ratio: | 0.9 to 1 | 1.1 to 1 | 0.8 to 1 |
| NET POSITION TREND: | | | |
| – Strength Index Score (3 Year Range Pct): | 25.9 | 75.8 | 62.7 |
| – Strength Index Reading (3 Year Range): | Bearish | Bullish | Bullish |
| NET POSITION MOVEMENT INDEX: | | | |
| – 6-Week Change in Strength Index: | 16.5 | -16.4 | -13.7 |
COTTON Futures:
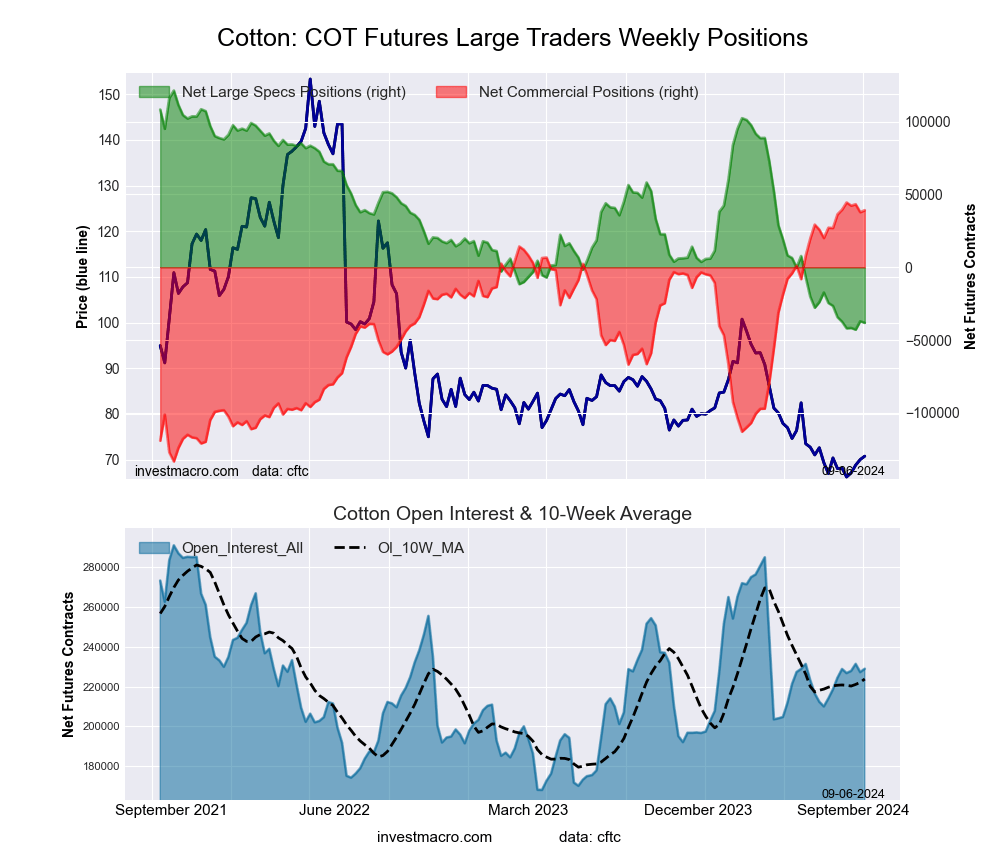 The COTTON large speculator standing this week resulted in a net position of -38,154 contracts in the data reported through Tuesday. This was a weekly lowering of -1,079 contracts from the previous week which had a total of -37,075 net contracts.
This week’s current strength score (the trader positioning range over the past three years, measured from 0 to 100) shows the speculators are currently Bearish-Extreme with a score of 2.8 percent. The commercials are Bullish-Extreme with a score of 97.0 percent and the small traders (not shown in chart) are Bearish-Extreme with a score of 10.5 percent.
Price Trend-Following Model: Downtrend
Our weekly trend-following model classifies the current market price position as: Downtrend. The current action for the model is considered to be: Hold – Maintain Short Position.
| COTTON Futures Statistics | SPECULATORS | COMMERCIALS | SMALL TRADERS |
| – Percent of Open Interest Longs: | 23.3 | 50.3 | 5.8 |
| – Percent of Open Interest Shorts: | 40.0 | 33.2 | 6.2 |
| – Net Position: | -38,154 | 39,133 | -979 |
| – Gross Longs: | 53,387 | 115,192 | 13,259 |
| – Gross Shorts: | 91,541 | 76,059 | 14,238 |
| – Long to Short Ratio: | 0.6 to 1 | 1.5 to 1 | 0.9 to 1 |
| NET POSITION TREND: | | | |
| – Strength Index Score (3 Year Range Pct): | 2.8 | 97.0 | 10.5 |
| – Strength Index Reading (3 Year Range): | Bearish-Extreme | Bullish-Extreme | Bearish-Extreme |
| NET POSITION MOVEMENT INDEX: | | | |
| – 6-Week Change in Strength Index: | -2.4 | 1.6 | 6.2 |
COCOA Futures:
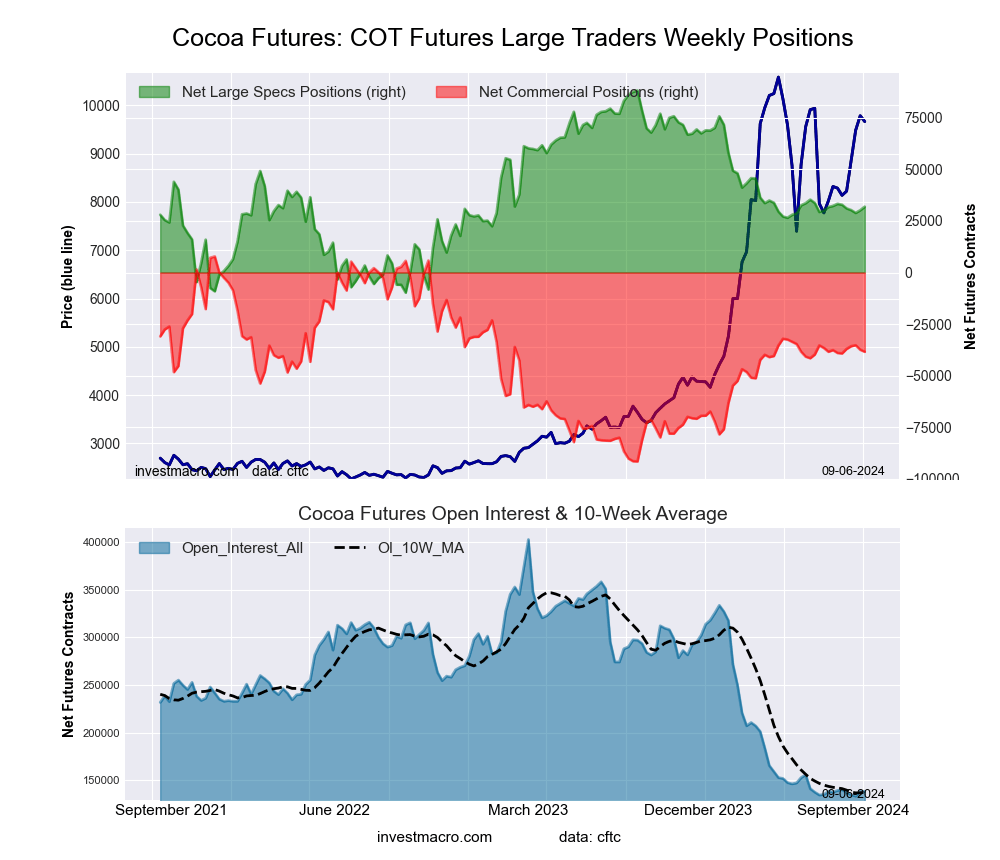 The COCOA large speculator standing this week resulted in a net position of 31,930 contracts in the data reported through Tuesday. This was a weekly advance of 1,738 contracts from the previous week which had a total of 30,192 net contracts.
This week’s current strength score (the trader positioning range over the past three years, measured from 0 to 100) shows the speculators are currently Bearish with a score of 42.5 percent. The commercials are Bullish with a score of 53.5 percent and the small traders (not shown in chart) are Bullish with a score of 67.6 percent.
Price Trend-Following Model: Weak Downtrend
Our weekly trend-following model classifies the current market price position as: Weak Downtrend. The current action for the model is considered to be: Hold – Maintain Short Position.
| COCOA Futures Statistics | SPECULATORS | COMMERCIALS | SMALL TRADERS |
| – Percent of Open Interest Longs: | 37.7 | 32.3 | 8.2 |
| – Percent of Open Interest Shorts: | 14.7 | 60.0 | 3.5 |
| – Net Position: | 31,930 | -38,437 | 6,507 |
| – Gross Longs: | 52,248 | 44,648 | 11,329 |
| – Gross Shorts: | 20,318 | 83,085 | 4,822 |
| – Long to Short Ratio: | 2.6 to 1 | 0.5 to 1 | 2.3 to 1 |
| NET POSITION TREND: | | | |
| – Strength Index Score (3 Year Range Pct): | 42.5 | 53.5 | 67.6 |
| – Strength Index Reading (3 Year Range): | Bearish | Bullish | Bullish |
| NET POSITION MOVEMENT INDEX: | | | |
| – 6-Week Change in Strength Index: | -1.4 | 0.6 | 6.8 |
WHEAT Futures:
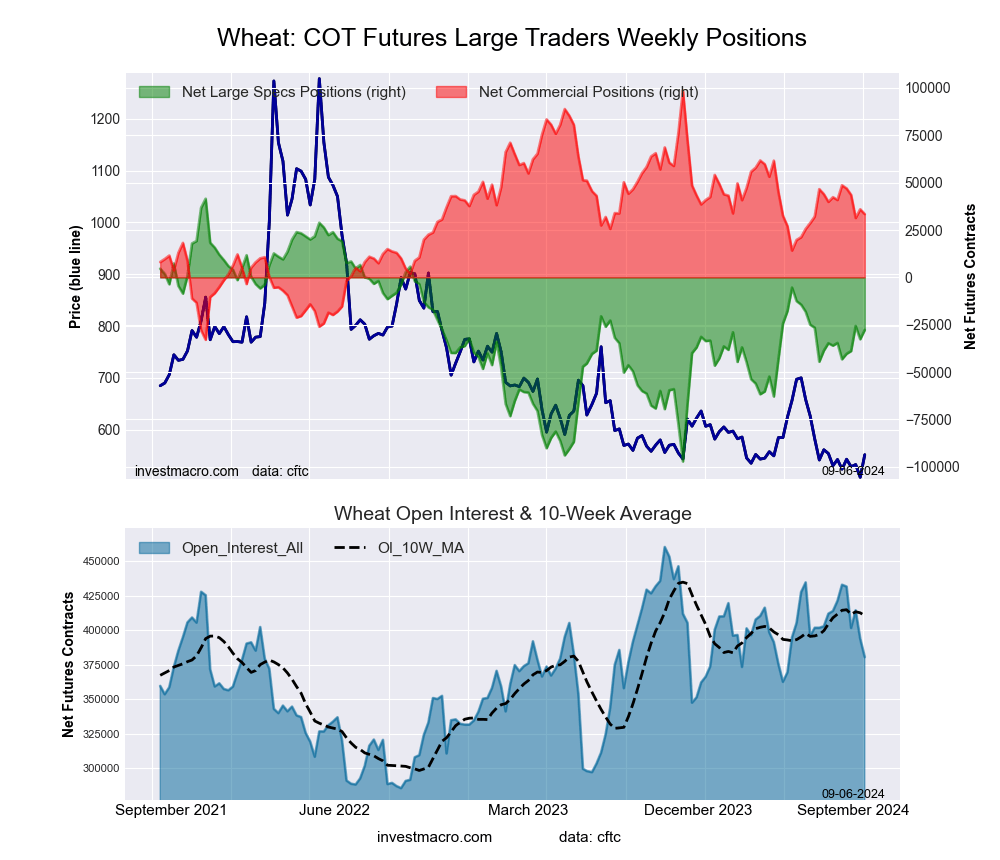 The WHEAT large speculator standing this week resulted in a net position of -27,742 contracts in the data reported through Tuesday. This was a weekly lift of 4,939 contracts from the previous week which had a total of -32,681 net contracts.
This week’s current strength score (the trader positioning range over the past three years, measured from 0 to 100) shows the speculators are currently Bullish with a score of 50.1 percent. The commercials are Bullish with a score of 50.4 percent and the small traders (not shown in chart) are Bearish with a score of 34.1 percent.
Price Trend-Following Model: Downtrend
Our weekly trend-following model classifies the current market price position as: Downtrend. The current action for the model is considered to be: Hold – Maintain Short Position.
| WHEAT Futures Statistics | SPECULATORS | COMMERCIALS | SMALL TRADERS |
| – Percent of Open Interest Longs: | 35.4 | 35.4 | 7.9 |
| – Percent of Open Interest Shorts: | 42.6 | 26.7 | 9.4 |
| – Net Position: | -27,742 | 33,399 | -5,657 |
| – Gross Longs: | 134,551 | 134,830 | 29,968 |
| – Gross Shorts: | 162,293 | 101,431 | 35,625 |
| – Long to Short Ratio: | 0.8 to 1 | 1.3 to 1 | 0.8 to 1 |
| NET POSITION TREND: | | | |
| – Strength Index Score (3 Year Range Pct): | 50.1 | 50.4 | 34.1 |
| – Strength Index Reading (3 Year Range): | Bullish | Bullish | Bearish |
| NET POSITION MOVEMENT INDEX: | | | |
| – 6-Week Change in Strength Index: | 5.0 | -5.7 | 2.8 |
Article By InvestMacro – Receive our weekly COT Newsletter
*COT Report: The COT data, released weekly to the public each Friday, is updated through the most recent Tuesday (data is 3 days old) and shows a quick view of how large speculators or non-commercials (for-profit traders) were positioned in the futures markets.
The CFTC categorizes trader positions according to commercial hedgers (traders who use futures contracts for hedging as part of the business), non-commercials (large traders who speculate to realize trading profits) and nonreportable traders (usually small traders/speculators) as well as their open interest (contracts open in the market at time of reporting). See CFTC criteria here.