By InvestMacro
Here are the latest charts and statistics for the Commitment of Traders (COT) reports data published by the Commodities Futures Trading Commission (CFTC).
The latest COT data is updated through Tuesday September 24th and shows a quick view of how large traders (for-profit speculators and commercial entities) were positioned in the futures markets.
Weekly Speculator Changes led by Sugar & Soybeans
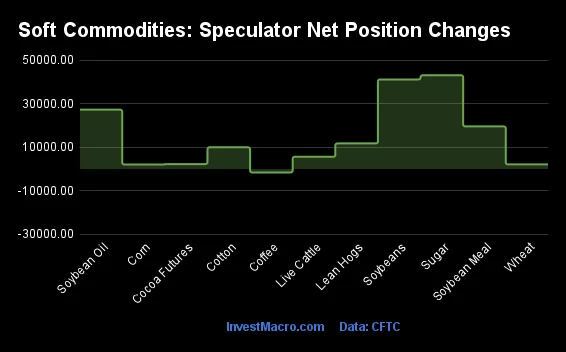
The COT soft commodities markets speculator bets were strongly higher this week as ten out of the eleven softs markets we cover had higher positioning while the other one markets had lower speculator contracts.
Leading the gains for the softs markets was Sugar (43,133 contracts) with Soybeans (41,207 contracts), Soybean Oil (27,295 contracts), Soybean Meal (19,591 contracts), Lean Hogs (11,770 contracts), Cotton (9,974 contracts), Live Cattle (5,609 contracts), Cocoa (2,261 contracts), Wheat (2,099 contracts) and Corn (2,073 contracts) also showing positive weeks.
The only market with a decline in speculator bets this week was Coffee (-1,609 contracts) which took a breather after hitting a nine-week high in speculator positioning last week.
*COT Report: The COT data, released weekly to the public each Friday, is updated through the most recent Tuesday (data is 3 days old) and shows a quick view of how large speculators or non-commercials (for-profit traders) were positioned in the futures markets.
The CFTC categorizes trader positions according to commercial hedgers (traders who use futures contracts for hedging as part of the business), non-commercials (large traders who speculate to realize trading profits) and nonreportable traders (usually small traders/speculators) as well as their open interest (contracts open in the market at time of reporting). See CFTC criteria here.
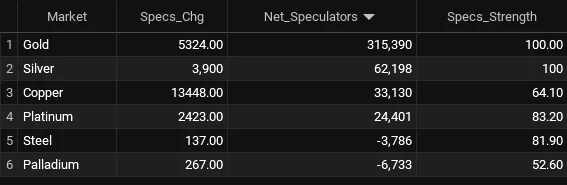
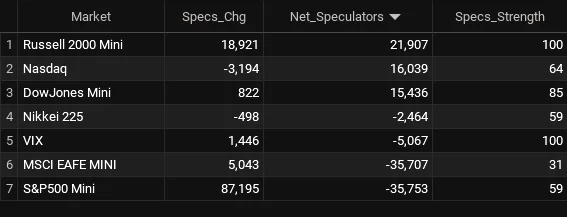
Soft Commodities Net Speculators Leaderboard
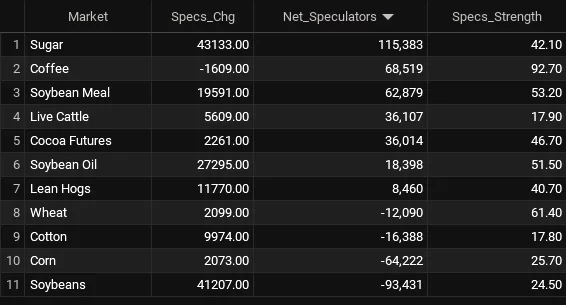
Legend: Weekly Speculators Change | Speculators Current Net Position | Speculators Strength Score compared to last 3-Years (0-100 range)
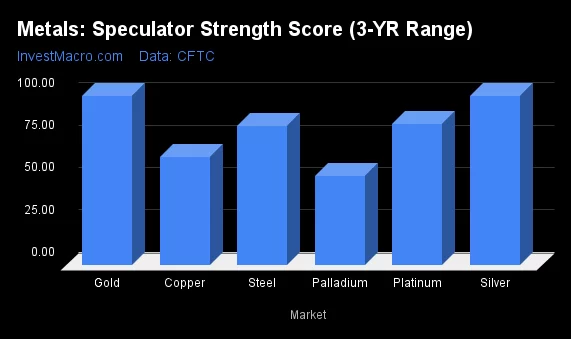
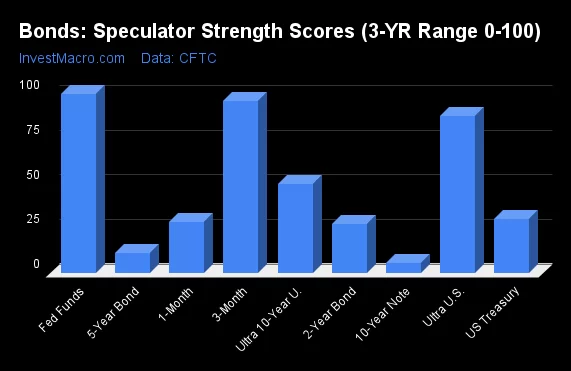
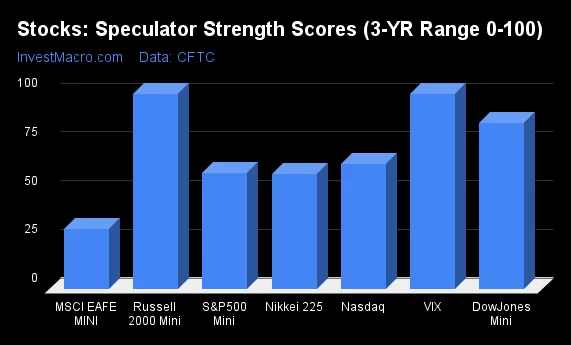
Strength Scores led by Coffee & Wheat
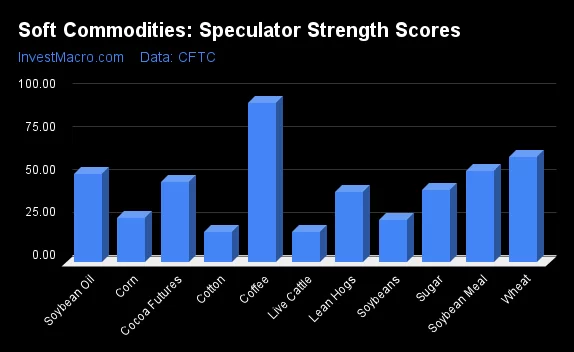
COT Strength Scores (a normalized measure of Speculator positions over a 3-Year range, from 0 to 100 where above 80 is Extreme-Bullish and below 20 is Extreme-Bearish) showed that Coffee (93 percent) and Wheat (61 percent) lead the softs markets this week. Soybean Meal (53 percent), Soybean Oil (52 percent) and Cocoa (47 percent) come in as the next highest in the weekly strength scores.
On the downside, Live Cattle (18 percent) and Cotton (18 percent) come in at the lowest strength levels currently and are in Extreme-Bearish territory (below 20 percent). The next lowest strength scores are the Soybeans (25 percent) and the Corn (26 percent).
Strength Statistics:
Corn (25.7 percent) vs Corn previous week (25.4 percent)
Sugar (42.1 percent) vs Sugar previous week (26.9 percent)
Coffee (92.7 percent) vs Coffee previous week (94.2 percent)
Soybeans (24.5 percent) vs Soybeans previous week (14.8 percent)
Soybean Oil (51.5 percent) vs Soybean Oil previous week (36.6 percent)
Soybean Meal (53.2 percent) vs Soybean Meal previous week (45.2 percent)
Live Cattle (17.9 percent) vs Live Cattle previous week (11.8 percent)
Lean Hogs (40.7 percent) vs Lean Hogs previous week (29.9 percent)
Cotton (17.8 percent) vs Cotton previous week (11.8 percent)
Cocoa (46.7 percent) vs Cocoa previous week (44.4 percent)
Wheat (61.4 percent) vs Wheat previous week (59.9 percent)
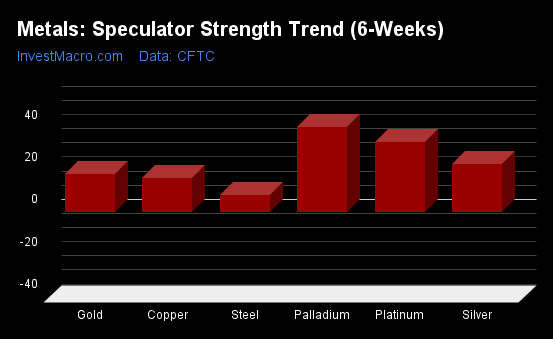
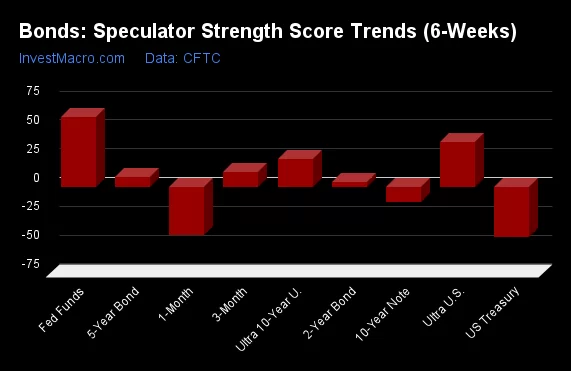
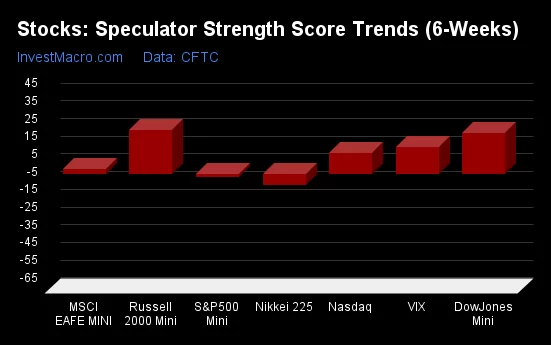
Soybean Oil & Lean Hogs top the 6-Week Strength Trends
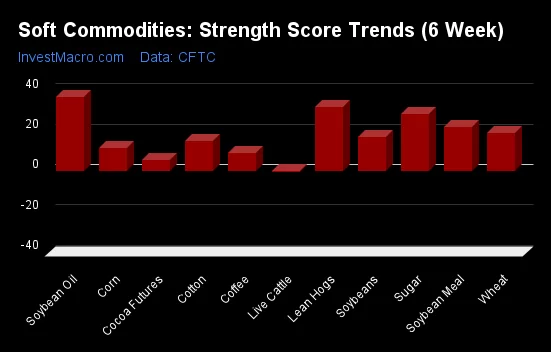
COT Strength Score Trends (or move index, calculates the 6-week changes in strength scores) showed that Soybean Oil (37 percent) and Lean Hogs (32 percent) lead the past six weeks trends for soft commodities. Sugar (29 percent), Soybean Meal (22 percent) and Wheat (19 percent) are the next highest positive movers in the latest trends data.
Live Cattle (-0.1 percent) leads the downside trend scores currently and is the only negative trender.
Strength Trend Statistics:
Corn (11.4 percent) vs Corn previous week (10.9 percent)
Sugar (28.5 percent) vs Sugar previous week (16.4 percent)
Coffee (9.3 percent) vs Coffee previous week (10.6 percent)
Soybeans (17.1 percent) vs Soybeans previous week (5.8 percent)
Soybean Oil (37.1 percent) vs Soybean Oil previous week (22.0 percent)
Soybean Meal (21.9 percent) vs Soybean Meal previous week (0.1 percent)
Live Cattle (-0.1 percent) vs Live Cattle previous week (-15.9 percent)
Lean Hogs (31.9 percent) vs Lean Hogs previous week (16.6 percent)
Cotton (15.1 percent) vs Cotton previous week (9.3 percent)
Cocoa (5.9 percent) vs Cocoa previous week (2.7 percent)
Wheat (19.3 percent) vs Wheat previous week (18.9 percent)
Individual Soft Commodities Markets:
CORN Futures:
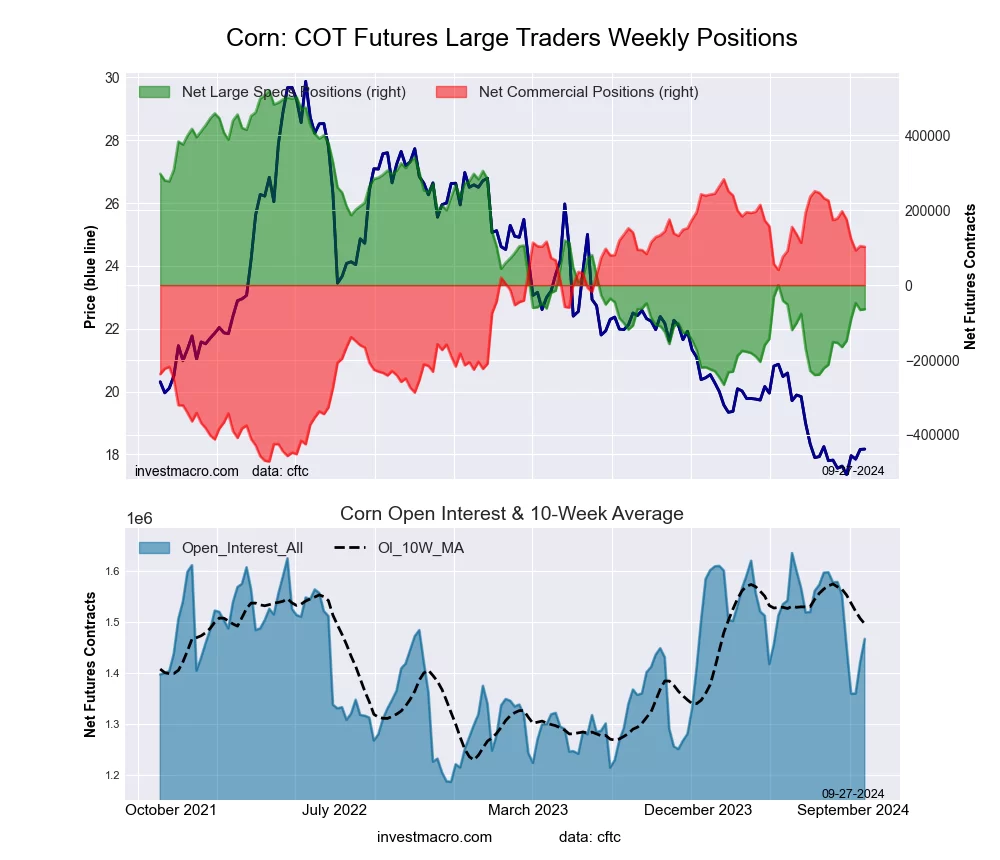 The CORN large speculator standing this week equaled a net position of -64,222 contracts in the data reported through Tuesday. This was a weekly rise of 2,073 contracts from the previous week which had a total of -66,295 net contracts.
This week’s current strength score (the trader positioning range over the past three years, measured from 0 to 100) shows the speculators are currently Bearish with a score of 25.7 percent. The commercials are Bullish with a score of 76.1 percent and the small traders (not shown in chart) are Bullish with a score of 57.2 percent.
Price Trend-Following Model: Downtrend
Our weekly trend-following model classifies the current market price position as: Downtrend.
| CORN Futures Statistics | SPECULATORS | COMMERCIALS | SMALL TRADERS |
| – Percent of Open Interest Longs: | 22.2 | 43.6 | 9.3 |
| – Percent of Open Interest Shorts: | 26.6 | 36.6 | 11.9 |
| – Net Position: | -64,222 | 102,193 | -37,971 |
| – Gross Longs: | 326,166 | 639,476 | 137,018 |
| – Gross Shorts: | 390,388 | 537,283 | 174,989 |
| – Long to Short Ratio: | 0.8 to 1 | 1.2 to 1 | 0.8 to 1 |
| NET POSITION TREND: | | | |
| – Strength Index Score (3 Year Range Pct): | 25.7 | 76.1 | 57.2 |
| – Strength Index Reading (3 Year Range): | Bearish | Bullish | Bullish |
| NET POSITION MOVEMENT INDEX: | | | |
| – 6-Week Change in Strength Index: | 11.4 | -10.1 | -18.4 |
SUGAR Futures:
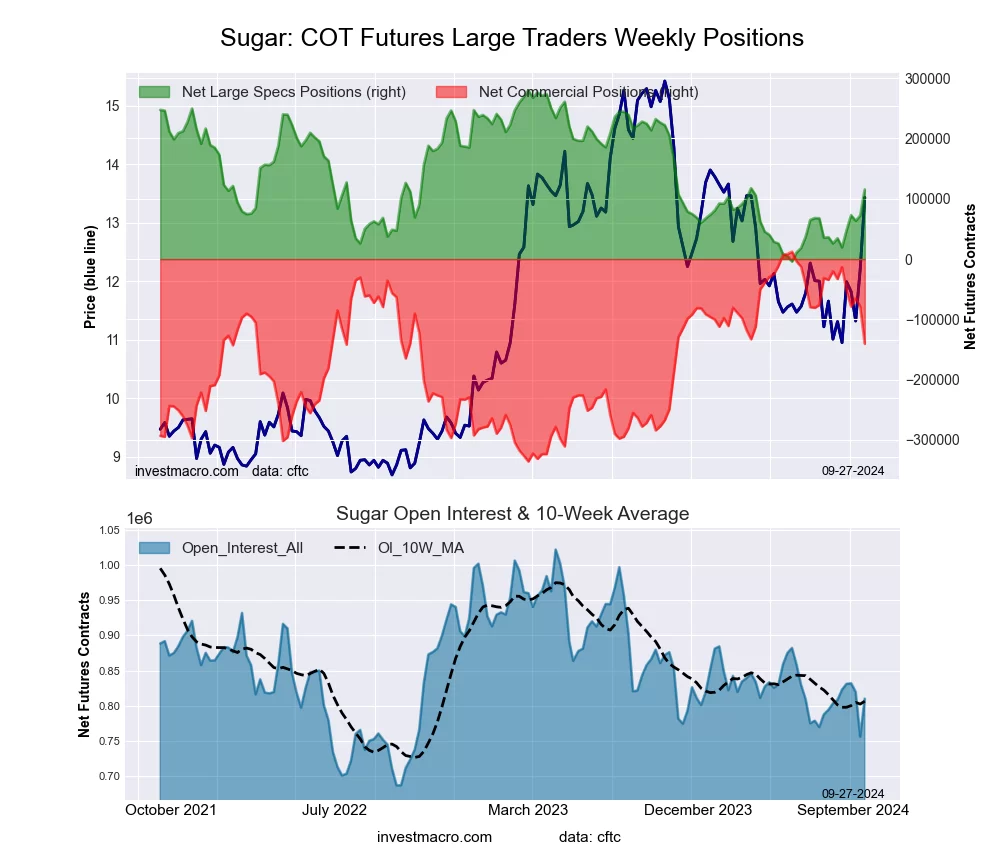 The SUGAR large speculator standing this week equaled a net position of 115,383 contracts in the data reported through Tuesday. This was a weekly boost of 43,133 contracts from the previous week which had a total of 72,250 net contracts.
This week’s current strength score (the trader positioning range over the past three years, measured from 0 to 100) shows the speculators are currently Bearish with a score of 42.1 percent. The commercials are Bullish with a score of 56.1 percent and the small traders (not shown in chart) are Bullish with a score of 52.4 percent.
Price Trend-Following Model: Strong Uptrend
Our weekly trend-following model classifies the current market price position as: Strong Uptrend.
| SUGAR Futures Statistics | SPECULATORS | COMMERCIALS | SMALL TRADERS |
| – Percent of Open Interest Longs: | 24.4 | 53.3 | 9.5 |
| – Percent of Open Interest Shorts: | 10.2 | 70.6 | 6.4 |
| – Net Position: | 115,383 | -140,563 | 25,180 |
| – Gross Longs: | 197,713 | 431,724 | 76,902 |
| – Gross Shorts: | 82,330 | 572,287 | 51,722 |
| – Long to Short Ratio: | 2.4 to 1 | 0.8 to 1 | 1.5 to 1 |
| NET POSITION TREND: | | | |
| – Strength Index Score (3 Year Range Pct): | 42.1 | 56.1 | 52.4 |
| – Strength Index Reading (3 Year Range): | Bearish | Bullish | Bullish |
| NET POSITION MOVEMENT INDEX: | | | |
| – 6-Week Change in Strength Index: | 28.5 | -30.9 | 34.8 |
COFFEE Futures:
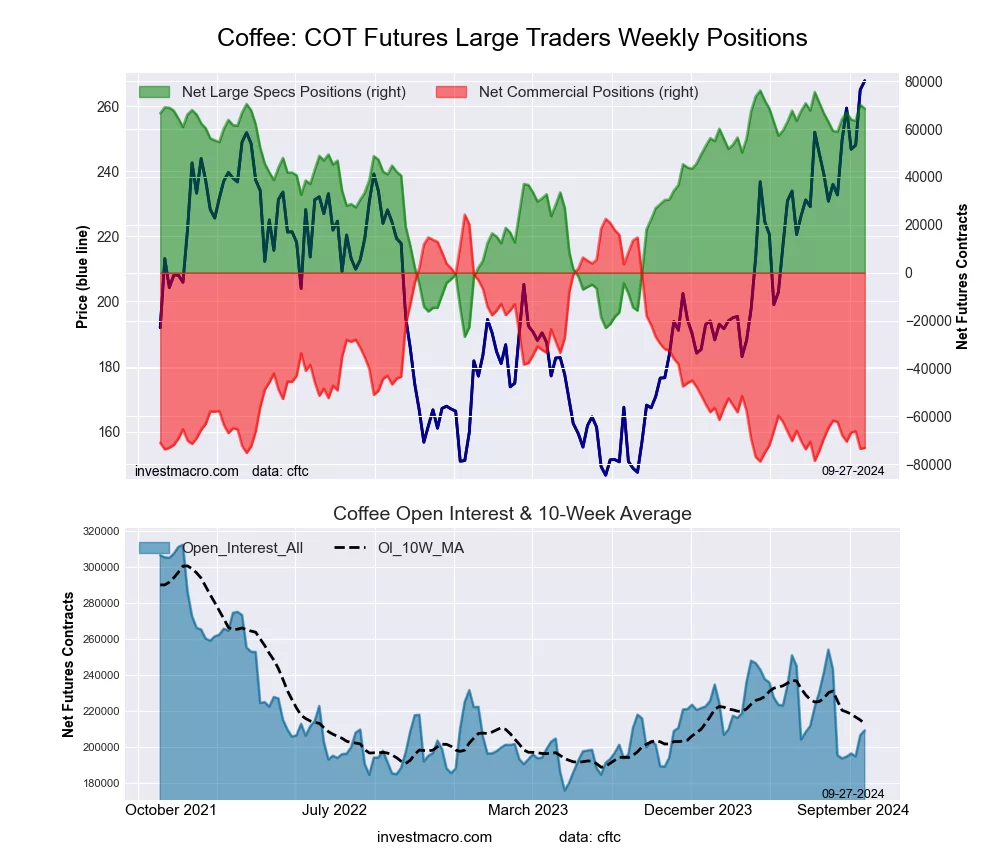 The COFFEE large speculator standing this week equaled a net position of 68,519 contracts in the data reported through Tuesday. This was a weekly lowering of -1,609 contracts from the previous week which had a total of 70,128 net contracts.
This week’s current strength score (the trader positioning range over the past three years, measured from 0 to 100) shows the speculators are currently Bullish-Extreme with a score of 92.7 percent. The commercials are Bearish-Extreme with a score of 5.5 percent and the small traders (not shown in chart) are Bullish-Extreme with a score of 88.7 percent.
Price Trend-Following Model: Strong Uptrend
Our weekly trend-following model classifies the current market price position as: Strong Uptrend.
| COFFEE Futures Statistics | SPECULATORS | COMMERCIALS | SMALL TRADERS |
| – Percent of Open Interest Longs: | 39.3 | 37.8 | 4.6 |
| – Percent of Open Interest Shorts: | 6.5 | 72.8 | 2.4 |
| – Net Position: | 68,519 | -73,178 | 4,659 |
| – Gross Longs: | 82,101 | 78,942 | 9,615 |
| – Gross Shorts: | 13,582 | 152,120 | 4,956 |
| – Long to Short Ratio: | 6.0 to 1 | 0.5 to 1 | 1.9 to 1 |
| NET POSITION TREND: | | | |
| – Strength Index Score (3 Year Range Pct): | 92.7 | 5.5 | 88.7 |
| – Strength Index Reading (3 Year Range): | Bullish-Extreme | Bearish-Extreme | Bullish-Extreme |
| NET POSITION MOVEMENT INDEX: | | | |
| – 6-Week Change in Strength Index: | 9.3 | -10.6 | 20.5 |
SOYBEANS Futures:
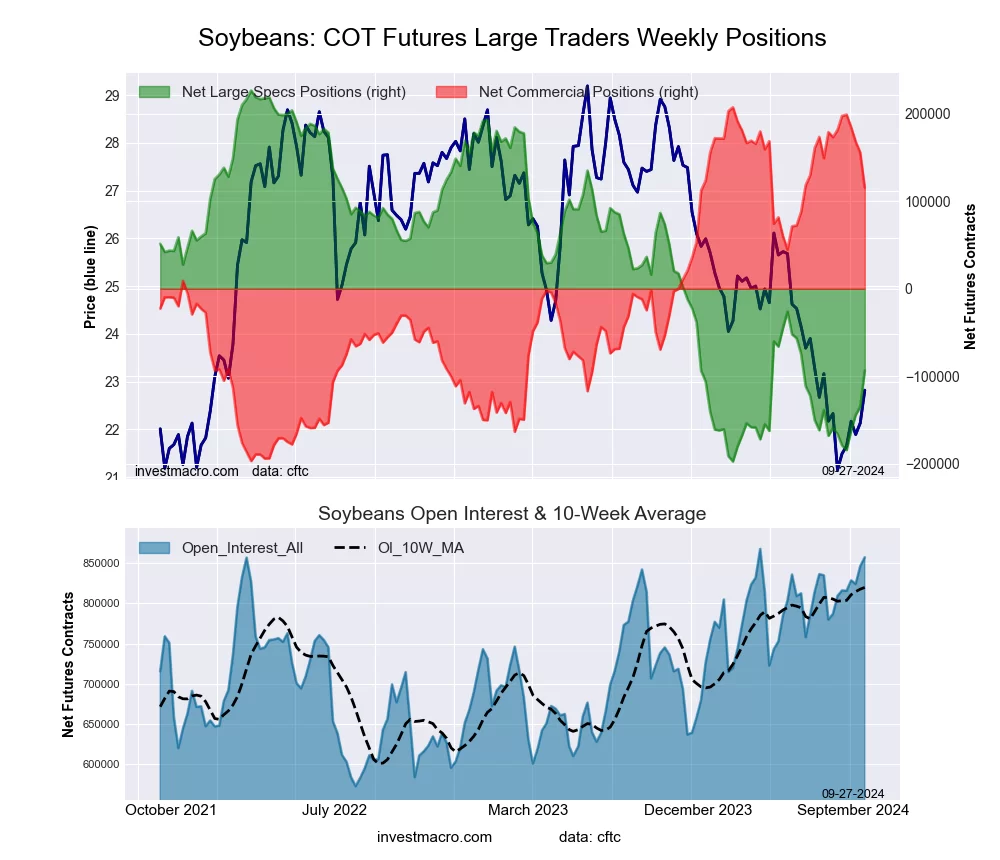 The SOYBEANS large speculator standing this week equaled a net position of -93,431 contracts in the data reported through Tuesday. This was a weekly advance of 41,207 contracts from the previous week which had a total of -134,638 net contracts.
This week’s current strength score (the trader positioning range over the past three years, measured from 0 to 100) shows the speculators are currently Bearish with a score of 24.5 percent. The commercials are Bullish with a score of 77.3 percent and the small traders (not shown in chart) are Bullish with a score of 55.1 percent.
Price Trend-Following Model: Weak Downtrend
Our weekly trend-following model classifies the current market price position as: Weak Downtrend.
| SOYBEANS Futures Statistics | SPECULATORS | COMMERCIALS | SMALL TRADERS |
| – Percent of Open Interest Longs: | 13.9 | 61.0 | 5.2 |
| – Percent of Open Interest Shorts: | 24.8 | 47.5 | 7.7 |
| – Net Position: | -93,431 | 115,399 | -21,968 |
| – Gross Longs: | 118,946 | 522,610 | 44,414 |
| – Gross Shorts: | 212,377 | 407,211 | 66,382 |
| – Long to Short Ratio: | 0.6 to 1 | 1.3 to 1 | 0.7 to 1 |
| NET POSITION TREND: | | | |
| – Strength Index Score (3 Year Range Pct): | 24.5 | 77.3 | 55.1 |
| – Strength Index Reading (3 Year Range): | Bearish | Bullish | Bullish |
| NET POSITION MOVEMENT INDEX: | | | |
| – 6-Week Change in Strength Index: | 17.1 | -16.3 | -17.0 |
SOYBEAN OIL Futures:
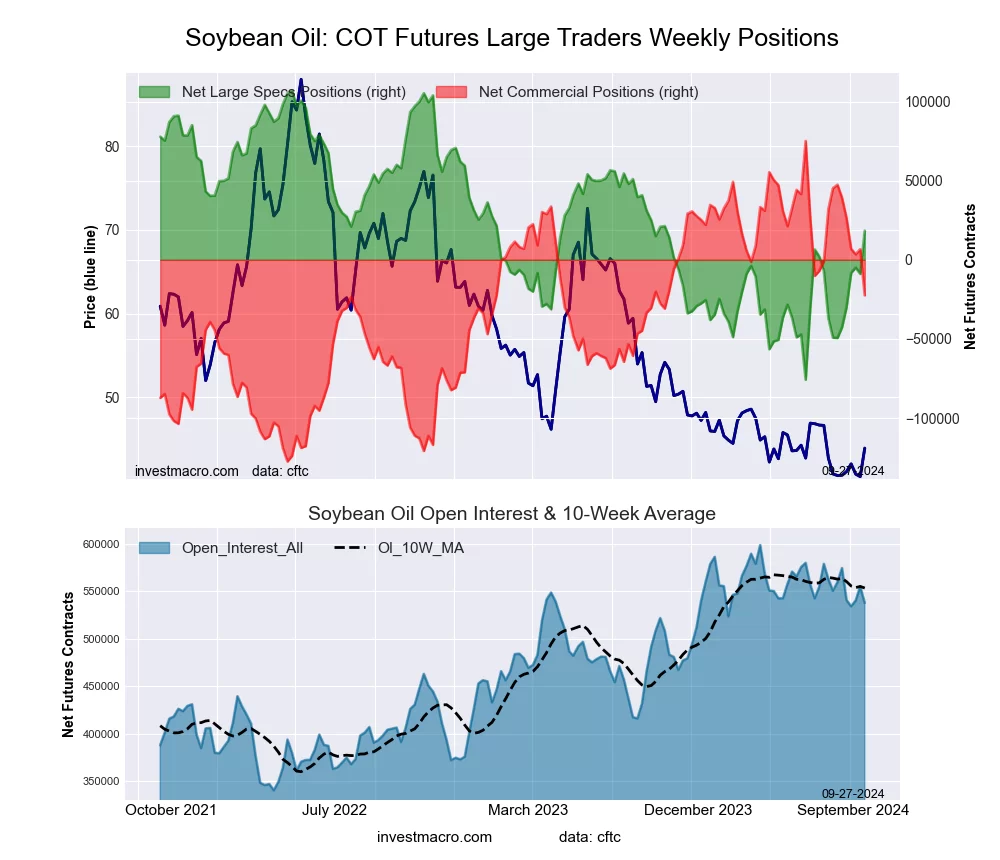 The SOYBEAN OIL large speculator standing this week equaled a net position of 18,398 contracts in the data reported through Tuesday. This was a weekly gain of 27,295 contracts from the previous week which had a total of -8,897 net contracts.
This week’s current strength score (the trader positioning range over the past three years, measured from 0 to 100) shows the speculators are currently Bullish with a score of 51.5 percent. The commercials are Bullish with a score of 51.8 percent and the small traders (not shown in chart) are Bearish with a score of 29.6 percent.
Price Trend-Following Model: Downtrend
Our weekly trend-following model classifies the current market price position as: Downtrend.
| SOYBEAN OIL Futures Statistics | SPECULATORS | COMMERCIALS | SMALL TRADERS |
| – Percent of Open Interest Longs: | 26.4 | 49.6 | 5.5 |
| – Percent of Open Interest Shorts: | 23.0 | 53.8 | 4.7 |
| – Net Position: | 18,398 | -22,416 | 4,018 |
| – Gross Longs: | 142,191 | 267,030 | 29,483 |
| – Gross Shorts: | 123,793 | 289,446 | 25,465 |
| – Long to Short Ratio: | 1.1 to 1 | 0.9 to 1 | 1.2 to 1 |
| NET POSITION TREND: | | | |
| – Strength Index Score (3 Year Range Pct): | 51.5 | 51.8 | 29.6 |
| – Strength Index Reading (3 Year Range): | Bullish | Bullish | Bearish |
| NET POSITION MOVEMENT INDEX: | | | |
| – 6-Week Change in Strength Index: | 37.1 | -34.5 | 8.0 |
SOYBEAN MEAL Futures:
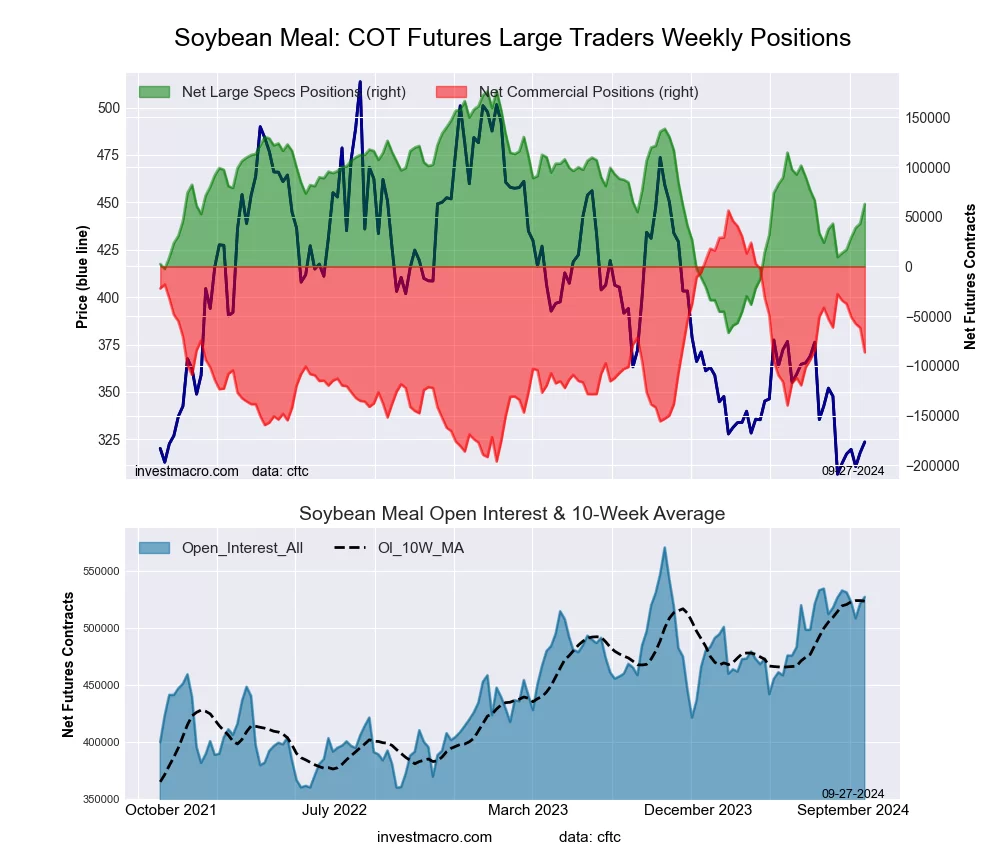 The SOYBEAN MEAL large speculator standing this week equaled a net position of 62,879 contracts in the data reported through Tuesday. This was a weekly advance of 19,591 contracts from the previous week which had a total of 43,288 net contracts.
This week’s current strength score (the trader positioning range over the past three years, measured from 0 to 100) shows the speculators are currently Bullish with a score of 53.2 percent. The commercials are Bearish with a score of 43.5 percent and the small traders (not shown in chart) are Bullish with a score of 61.5 percent.
Price Trend-Following Model: Downtrend
Our weekly trend-following model classifies the current market price position as: Downtrend.
| SOYBEAN MEAL Futures Statistics | SPECULATORS | COMMERCIALS | SMALL TRADERS |
| – Percent of Open Interest Longs: | 25.8 | 44.1 | 9.4 |
| – Percent of Open Interest Shorts: | 13.9 | 60.5 | 4.9 |
| – Net Position: | 62,879 | -86,397 | 23,518 |
| – Gross Longs: | 135,949 | 232,533 | 49,305 |
| – Gross Shorts: | 73,070 | 318,930 | 25,787 |
| – Long to Short Ratio: | 1.9 to 1 | 0.7 to 1 | 1.9 to 1 |
| NET POSITION TREND: | | | |
| – Strength Index Score (3 Year Range Pct): | 53.2 | 43.5 | 61.5 |
| – Strength Index Reading (3 Year Range): | Bullish | Bearish | Bullish |
| NET POSITION MOVEMENT INDEX: | | | |
| – 6-Week Change in Strength Index: | 21.9 | -23.3 | 23.6 |
LIVE CATTLE Futures:
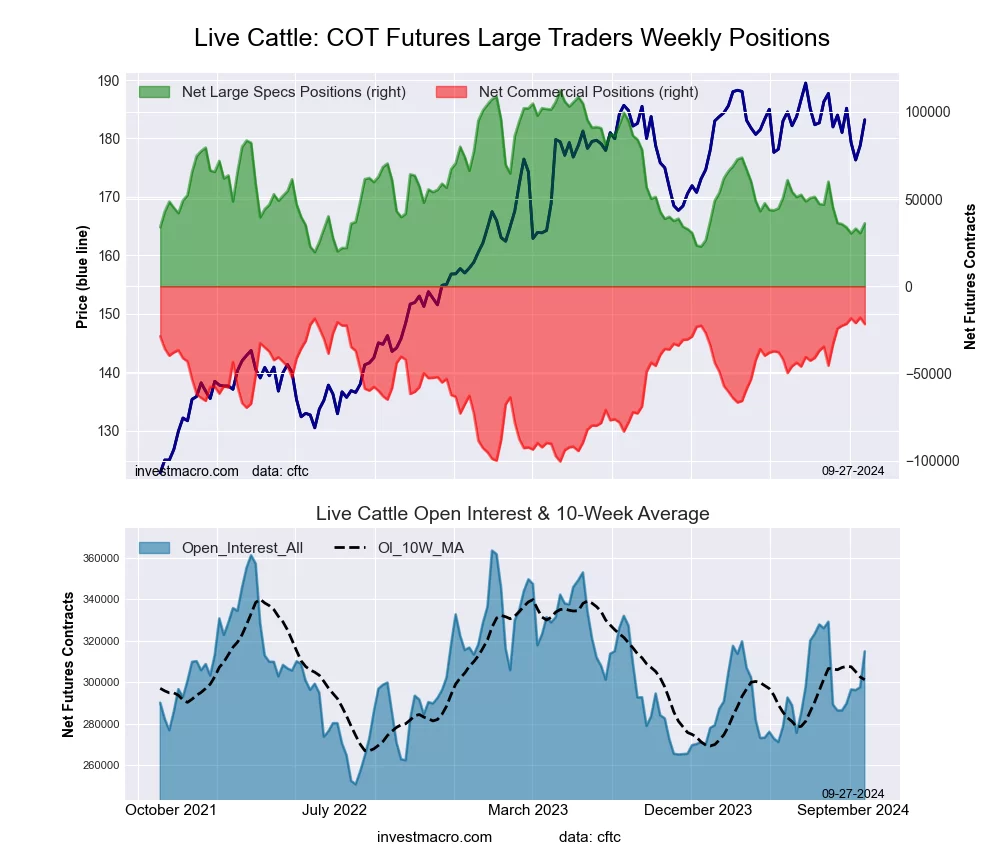 The LIVE CATTLE large speculator standing this week equaled a net position of 36,107 contracts in the data reported through Tuesday. This was a weekly advance of 5,609 contracts from the previous week which had a total of 30,498 net contracts.
This week’s current strength score (the trader positioning range over the past three years, measured from 0 to 100) shows the speculators are currently Bearish-Extreme with a score of 17.9 percent. The commercials are Bullish-Extreme with a score of 95.5 percent and the small traders (not shown in chart) are Bearish-Extreme with a score of 13.0 percent.
Price Trend-Following Model: Weak Downtrend
Our weekly trend-following model classifies the current market price position as: Weak Downtrend.
| LIVE CATTLE Futures Statistics | SPECULATORS | COMMERCIALS | SMALL TRADERS |
| – Percent of Open Interest Longs: | 35.1 | 35.9 | 8.2 |
| – Percent of Open Interest Shorts: | 23.6 | 42.8 | 12.8 |
| – Net Position: | 36,107 | -21,714 | -14,393 |
| – Gross Longs: | 110,464 | 112,852 | 25,895 |
| – Gross Shorts: | 74,357 | 134,566 | 40,288 |
| – Long to Short Ratio: | 1.5 to 1 | 0.8 to 1 | 0.6 to 1 |
| NET POSITION TREND: | | | |
| – Strength Index Score (3 Year Range Pct): | 17.9 | 95.5 | 13.0 |
| – Strength Index Reading (3 Year Range): | Bearish-Extreme | Bullish-Extreme | Bearish-Extreme |
| NET POSITION MOVEMENT INDEX: | | | |
| – 6-Week Change in Strength Index: | -0.1 | 3.1 | -12.9 |
LEAN HOGS Futures:
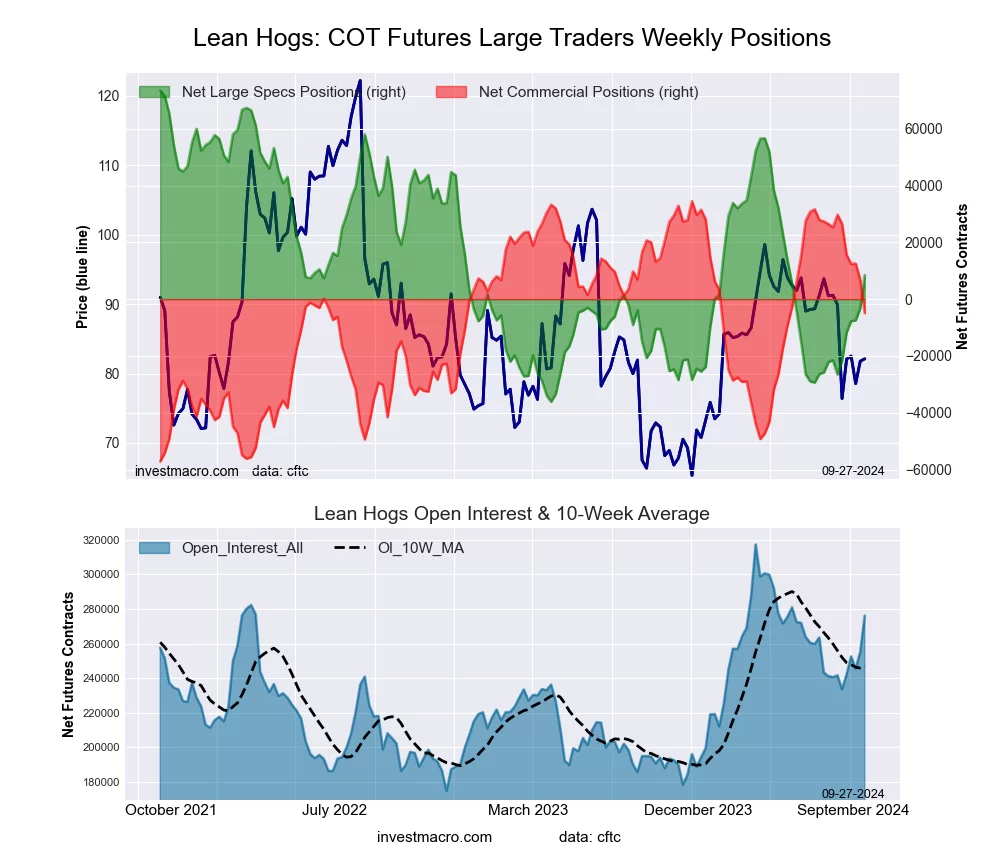 The LEAN HOGS large speculator standing this week equaled a net position of 8,460 contracts in the data reported through Tuesday. This was a weekly rise of 11,770 contracts from the previous week which had a total of -3,310 net contracts.
This week’s current strength score (the trader positioning range over the past three years, measured from 0 to 100) shows the speculators are currently Bearish with a score of 40.7 percent. The commercials are Bullish with a score of 57.0 percent and the small traders (not shown in chart) are Bullish with a score of 67.6 percent.
Price Trend-Following Model: Downtrend
Our weekly trend-following model classifies the current market price position as: Downtrend.
| LEAN HOGS Futures Statistics | SPECULATORS | COMMERCIALS | SMALL TRADERS |
| – Percent of Open Interest Longs: | 38.0 | 36.5 | 7.8 |
| – Percent of Open Interest Shorts: | 34.9 | 38.3 | 9.0 |
| – Net Position: | 8,460 | -4,952 | -3,508 |
| – Gross Longs: | 104,863 | 100,861 | 21,438 |
| – Gross Shorts: | 96,403 | 105,813 | 24,946 |
| – Long to Short Ratio: | 1.1 to 1 | 1.0 to 1 | 0.9 to 1 |
| NET POSITION TREND: | | | |
| – Strength Index Score (3 Year Range Pct): | 40.7 | 57.0 | 67.6 |
| – Strength Index Reading (3 Year Range): | Bearish | Bullish | Bullish |
| NET POSITION MOVEMENT INDEX: | | | |
| – 6-Week Change in Strength Index: | 31.9 | -37.8 | -1.4 |
COTTON Futures:
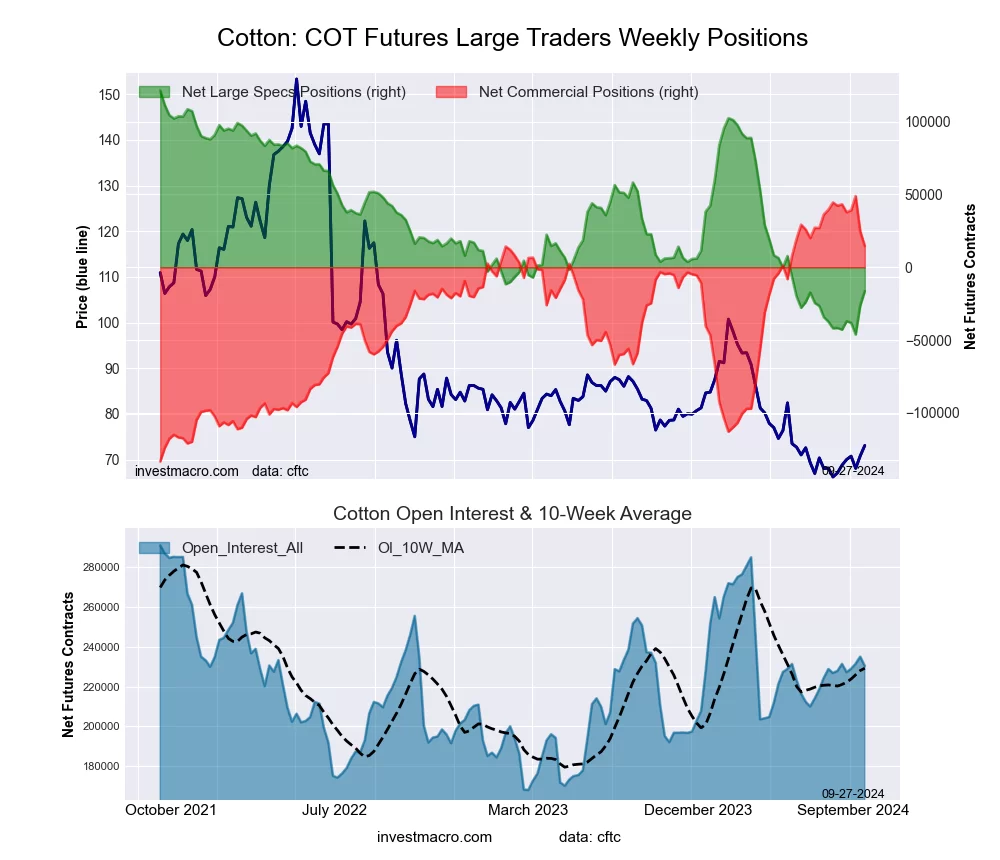 The COTTON large speculator standing this week equaled a net position of -16,388 contracts in the data reported through Tuesday. This was a weekly boost of 9,974 contracts from the previous week which had a total of -26,362 net contracts.
This week’s current strength score (the trader positioning range over the past three years, measured from 0 to 100) shows the speculators are currently Bearish-Extreme with a score of 17.8 percent. The commercials are Bullish-Extreme with a score of 81.2 percent and the small traders (not shown in chart) are Bearish with a score of 27.2 percent.
Price Trend-Following Model: Weak Downtrend
Our weekly trend-following model classifies the current market price position as: Weak Downtrend.
| COTTON Futures Statistics | SPECULATORS | COMMERCIALS | SMALL TRADERS |
| – Percent of Open Interest Longs: | 25.5 | 47.6 | 6.0 |
| – Percent of Open Interest Shorts: | 32.6 | 41.3 | 5.2 |
| – Net Position: | -16,388 | 14,600 | 1,788 |
| – Gross Longs: | 58,681 | 109,728 | 13,821 |
| – Gross Shorts: | 75,069 | 95,128 | 12,033 |
| – Long to Short Ratio: | 0.8 to 1 | 1.2 to 1 | 1.1 to 1 |
| NET POSITION TREND: | | | |
| – Strength Index Score (3 Year Range Pct): | 17.8 | 81.2 | 27.2 |
| – Strength Index Reading (3 Year Range): | Bearish-Extreme | Bullish-Extreme | Bearish |
| NET POSITION MOVEMENT INDEX: | | | |
| – 6-Week Change in Strength Index: | 15.1 | -15.2 | 14.5 |
COCOA Futures:
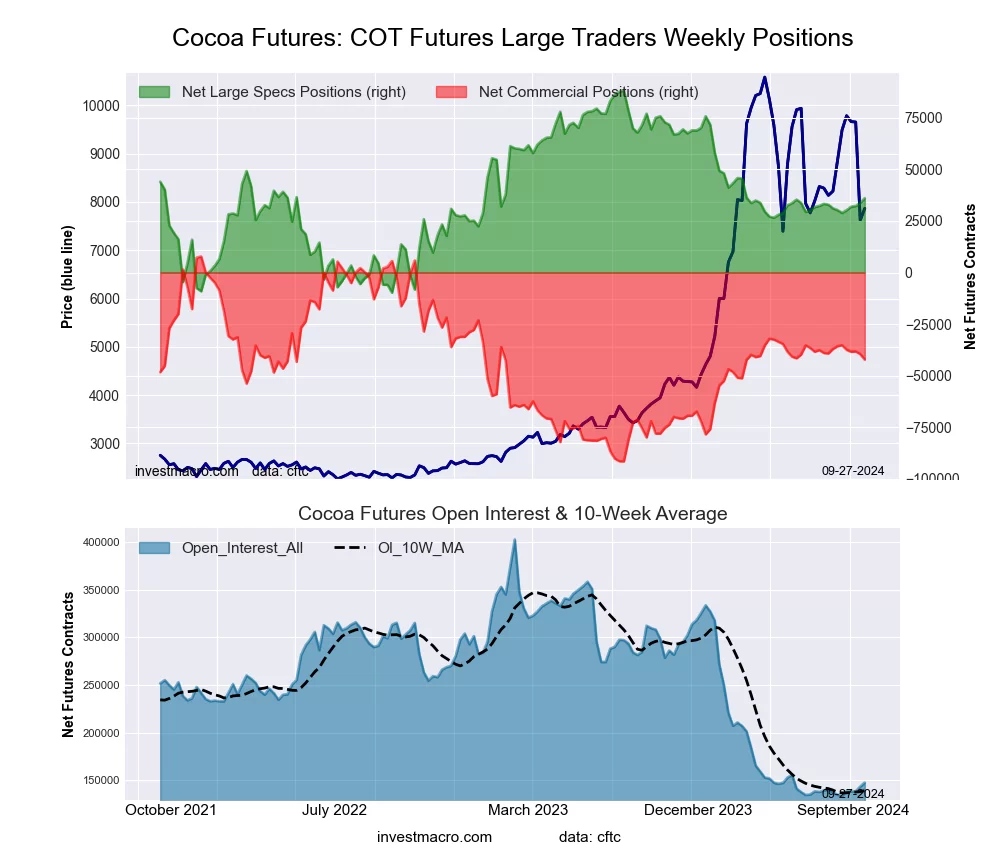 The COCOA large speculator standing this week equaled a net position of 36,014 contracts in the data reported through Tuesday. This was a weekly increase of 2,261 contracts from the previous week which had a total of 33,753 net contracts.
This week’s current strength score (the trader positioning range over the past three years, measured from 0 to 100) shows the speculators are currently Bearish with a score of 46.7 percent. The commercials are Bearish with a score of 49.7 percent and the small traders (not shown in chart) are Bullish with a score of 65.0 percent.
Price Trend-Following Model: Weak Uptrend
Our weekly trend-following model classifies the current market price position as: Weak Uptrend.
| COCOA Futures Statistics | SPECULATORS | COMMERCIALS | SMALL TRADERS |
| – Percent of Open Interest Longs: | 36.0 | 34.4 | 7.3 |
| – Percent of Open Interest Shorts: | 11.6 | 63.0 | 3.1 |
| – Net Position: | 36,014 | -42,210 | 6,196 |
| – Gross Longs: | 53,115 | 50,854 | 10,811 |
| – Gross Shorts: | 17,101 | 93,064 | 4,615 |
| – Long to Short Ratio: | 3.1 to 1 | 0.5 to 1 | 2.3 to 1 |
| NET POSITION TREND: | | | |
| – Strength Index Score (3 Year Range Pct): | 46.7 | 49.7 | 65.0 |
| – Strength Index Reading (3 Year Range): | Bearish | Bearish | Bullish |
| NET POSITION MOVEMENT INDEX: | | | |
| – 6-Week Change in Strength Index: | 5.9 | -6.5 | 6.2 |
WHEAT Futures:
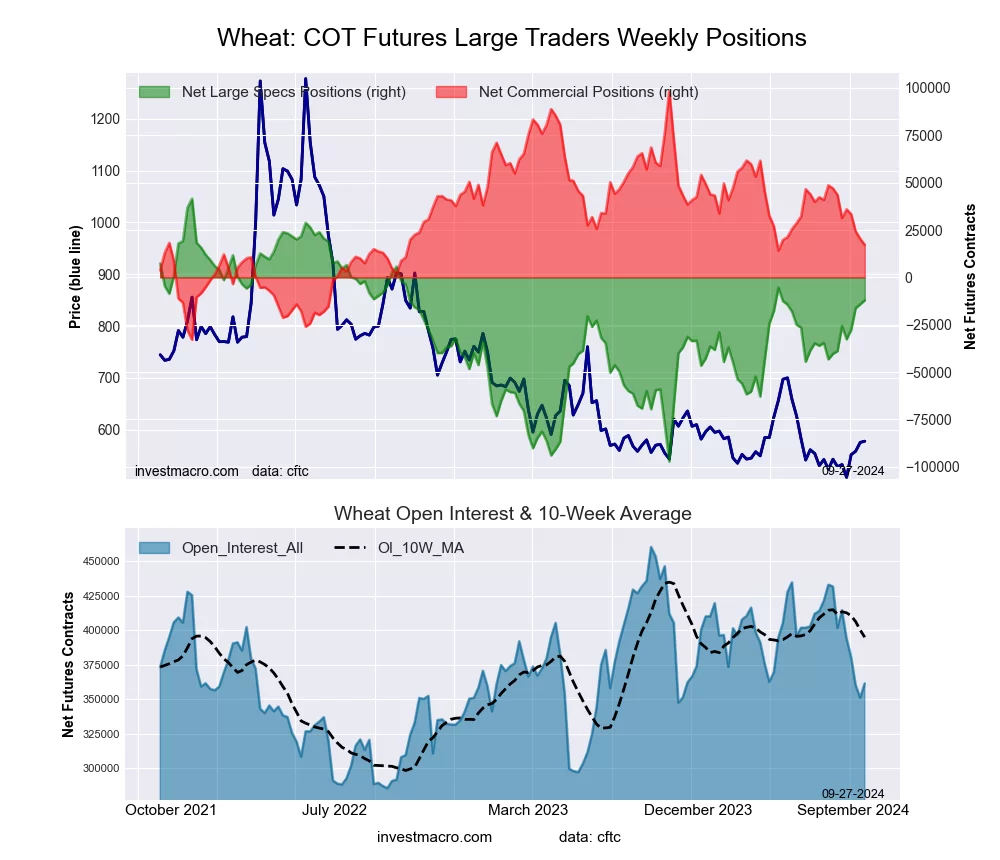 The WHEAT large speculator standing this week equaled a net position of -12,090 contracts in the data reported through Tuesday. This was a weekly gain of 2,099 contracts from the previous week which had a total of -14,189 net contracts.
This week’s current strength score (the trader positioning range over the past three years, measured from 0 to 100) shows the speculators are currently Bullish with a score of 61.4 percent. The commercials are Bearish with a score of 38.1 percent and the small traders (not shown in chart) are Bearish with a score of 31.6 percent.
Price Trend-Following Model: Weak Downtrend
Our weekly trend-following model classifies the current market price position as: Weak Downtrend.
| WHEAT Futures Statistics | SPECULATORS | COMMERCIALS | SMALL TRADERS |
| – Percent of Open Interest Longs: | 33.7 | 35.7 | 8.6 |
| – Percent of Open Interest Shorts: | 37.1 | 30.9 | 10.0 |
| – Net Position: | -12,090 | 17,154 | -5,064 |
| – Gross Longs: | 121,819 | 128,935 | 31,023 |
| – Gross Shorts: | 133,909 | 111,781 | 36,087 |
| – Long to Short Ratio: | 0.9 to 1 | 1.2 to 1 | 0.9 to 1 |
| NET POSITION TREND: | | | |
| – Strength Index Score (3 Year Range Pct): | 61.4 | 38.1 | 31.6 |
| – Strength Index Reading (3 Year Range): | Bullish | Bearish | Bearish |
| NET POSITION MOVEMENT INDEX: | | | |
| – 6-Week Change in Strength Index: | 19.3 | -20.0 | -2.4 |
Article By InvestMacro – Receive our weekly COT Newsletter