
By RoboForex Analytical Department
Gold (XAU/USD) prices have rebounded to 2394 USD per troy ounce, paring previous losses as the likelihood of a US Federal Reserve rate cut increases. Market sentiment is increasingly cautious amid recession fears, influencing stock market dynamics and bolstering the appeal of non-yielding assets like gold.
Current market indicators, notably the CME FedWatch tool, suggest an almost certain probability of a rate reduction by the Federal Reserve in September. Such monetary easing typically enhances the allure of gold, which does not offer interest income.
Investor focus is now on upcoming US unemployment claims data, which will provide further insight into employment market conditions. Recent statistics from China revealed that the People’s Bank of China did not purchase gold bullion in July, marking the third consecutive month without an increase in gold reserves. This suggests a shift towards domestic economic stimulation as the Chinese economy faces challenges.
Ongoing tensions in the Middle East also underscore gold’s status as a safe-haven asset.
Technical analysis of XAU/USD
Free Reports:
 Sign Up for Our Stock Market Newsletter – Get updated on News, Charts & Rankings of Public Companies when you join our Stocks Newsletter
 Get our Weekly Commitment of Traders Reports - See where the biggest traders (Hedge Funds and Commercial Hedgers) are positioned in the futures markets on a weekly basis.
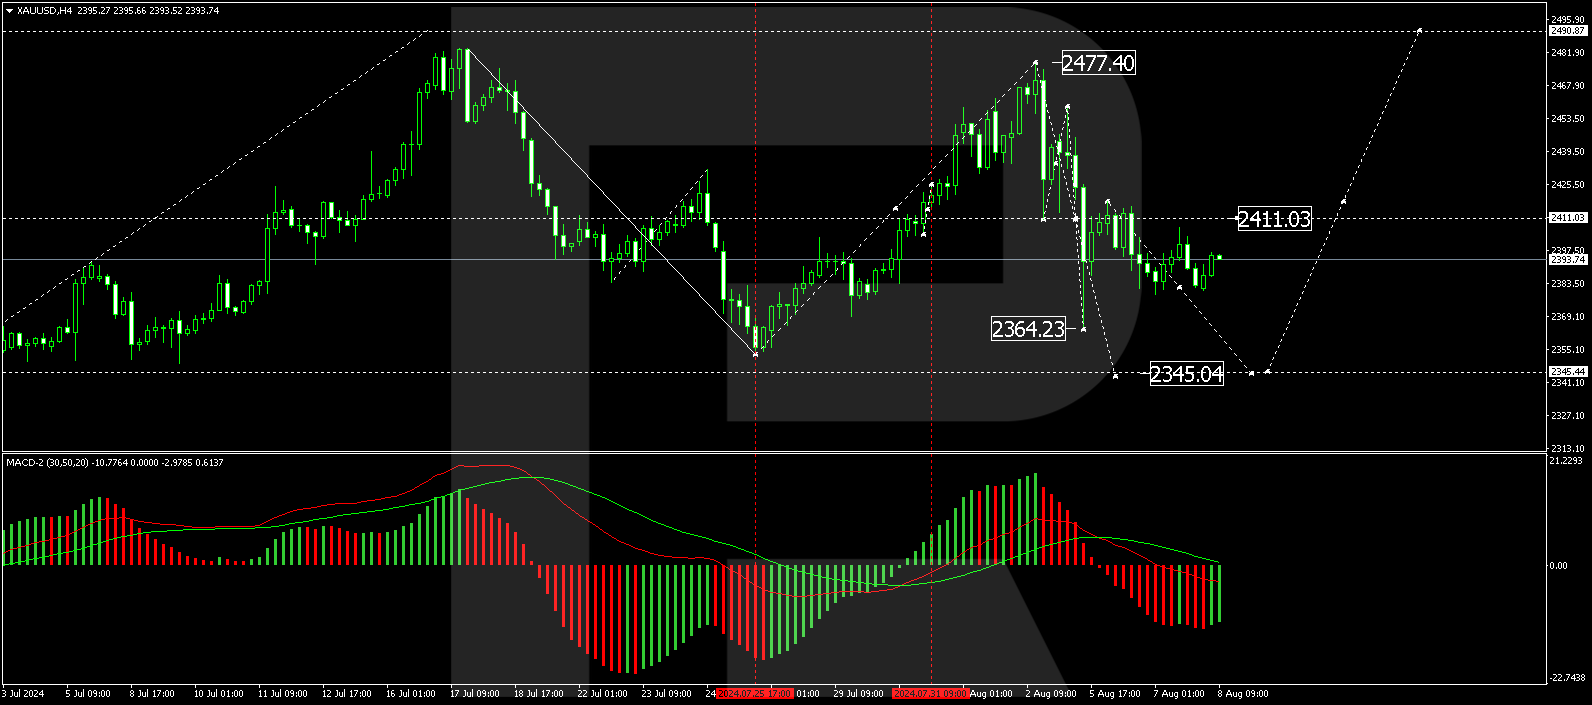
The H4 XAU/USD chart shows a declining trend towards the 2345.00 level, with a local target recently reached at 2364.23, followed by a correction to 2411.00. The market is anticipated to continue this downward trajectory towards 2355.80 before potentially rebounding to 2381.60. A further decline to 2345.00 is likely, aligning with the primary downtrend target. This bearish outlook is supported by the MACD indicator, which shows the signal line trending downwards from above zero.
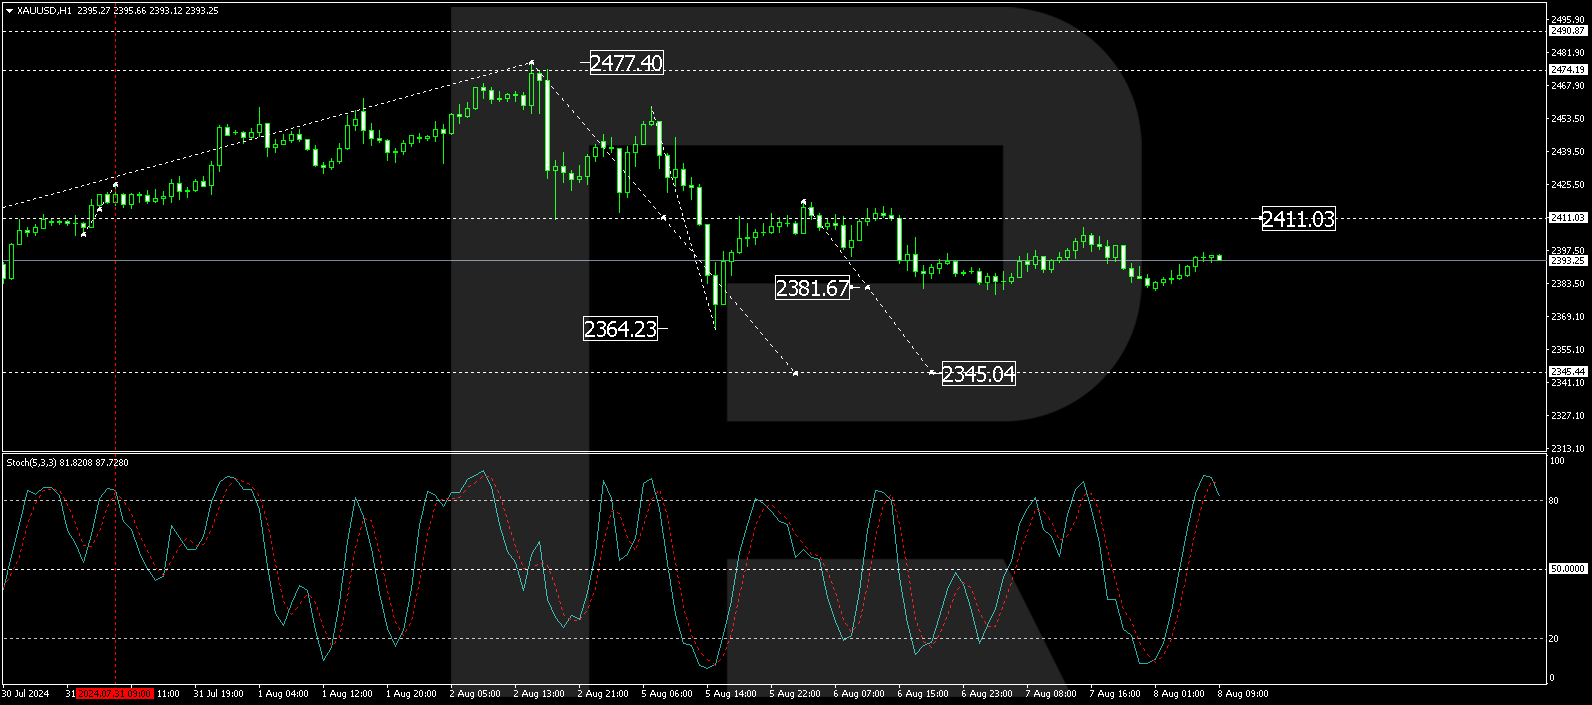
On the H1 chart, gold is currently consolidating above 2381.60. A downward breakout towards 2355.80 is expected, which would serve as a local target. Subsequent retesting of 2381.60 from below may occur before the downward movement continues to 2345.00. This bearish scenario is corroborated by the Stochastic oscillator, with the signal line poised to drop from above 80, suggesting a potential decline.
As investors and traders navigate these dynamics, gold’s status as a hedge against uncertainty remains a key theme in its valuation.
Disclaimer
Any forecasts contained herein are based on the author’s particular opinion. This analysis may not be treated as trading advice. RoboForex bears no responsibility for trading results based on trading recommendations and reviews contained herein.

- The Tech‑heavy NASDAQ Index jumped by more than 3.3%. The offshore yuan is trading at its highest level since 2023 Jul 31, 2026
- USD/JPY After Volatility: Multiple Events in One Day Jul 31, 2026
- The US indices sell off amid renewed US-Iran clashes. Oil jumps by 7% Jul 30, 2026
- USD/JPY Temporary in Equilibrium: Multiple Factors in Focus Jul 30, 2026
- GBP/USD at Month’s Lows: The Outlook Remains Weak Jul 29, 2026
- Crude oil falls below $80 per barrel. Australia sees inflation slowdown Jul 29, 2026
- The US Tech sector hit by sell‑off. Oil prices decline on renewed negotiations Jul 28, 2026
- Gold Declines, Focus on Fed and Falling Oil Prices Jul 28, 2026
- This week will be one of the most crowded for central‑bank meetings Jul 27, 2026
- EUR/USD Ahead of a Key Week: Holding Near Lows Jul 27, 2026