By JustMarkets
At Thursday’s close, the Dow Jones (US30) Index was down 0.44%, while the S&P 500 (US500) Index decreased by 0.17%. The NASDAQ Technology Index (US100) closed negative 0.04%. On Thursday, all three major US indices ended trading in the red as investors fear escalating tensions in the Middle East ahead of the release of the September payrolls report. Sentiment on Wall Street worsened after President Biden voiced support for an Israeli strike on Iran’s oil facilities, raising fears of energy supply disruptions around the world.
Meanwhile, the US service sector data showed growth in September, which briefly lifted markets. The labor market showed signs of cooling, with a slight increase in jobless claims and a drop in planned layoffs. Today, the US will release Non-Farm Payrolls labor market data for September. Economists expect the US economy to expand by 144,000 jobs in September after 142,000 in the previous month. The US Federal Reserve began its rate-cutting cycle in September with a large 50 basis point rate cut. However, the labor market continues to be the focus of investors assessing how quickly the Central Bank will have to cut rates in the coming months. A weak report scenario would put pressure on the dollar index, which would give strength to stock indices and precious metals (gold and silver). The probability of a double rate cut at the November meeting is currently at 50%. On the other hand, unexpectedly strong employment growth could raise concerns that the Fed will not cut rates as much, which would support the US dollar and put pressure on risk assets, especially equities.
Equity markets in Europe were mostly down yesterday. Germany’s DAX (DE40) was down 0.78%, France’s CAC 40 (FR40) closed negative 1.32%, Spain’s IBEX 35 (ES35) was up 0.07%, and the UK’s FTSE 100 (UK100) closed down 0.10%.
The Eurozone PMI for September from S&P was revised upward by 0.7 to 49.6 from the previously released reading of 48.9. Swaps discount the odds of a 25 bp ECB rate cut at the October 17 meeting at 95% and a 25 bp rate cut at the December 12 meeting at 100%.
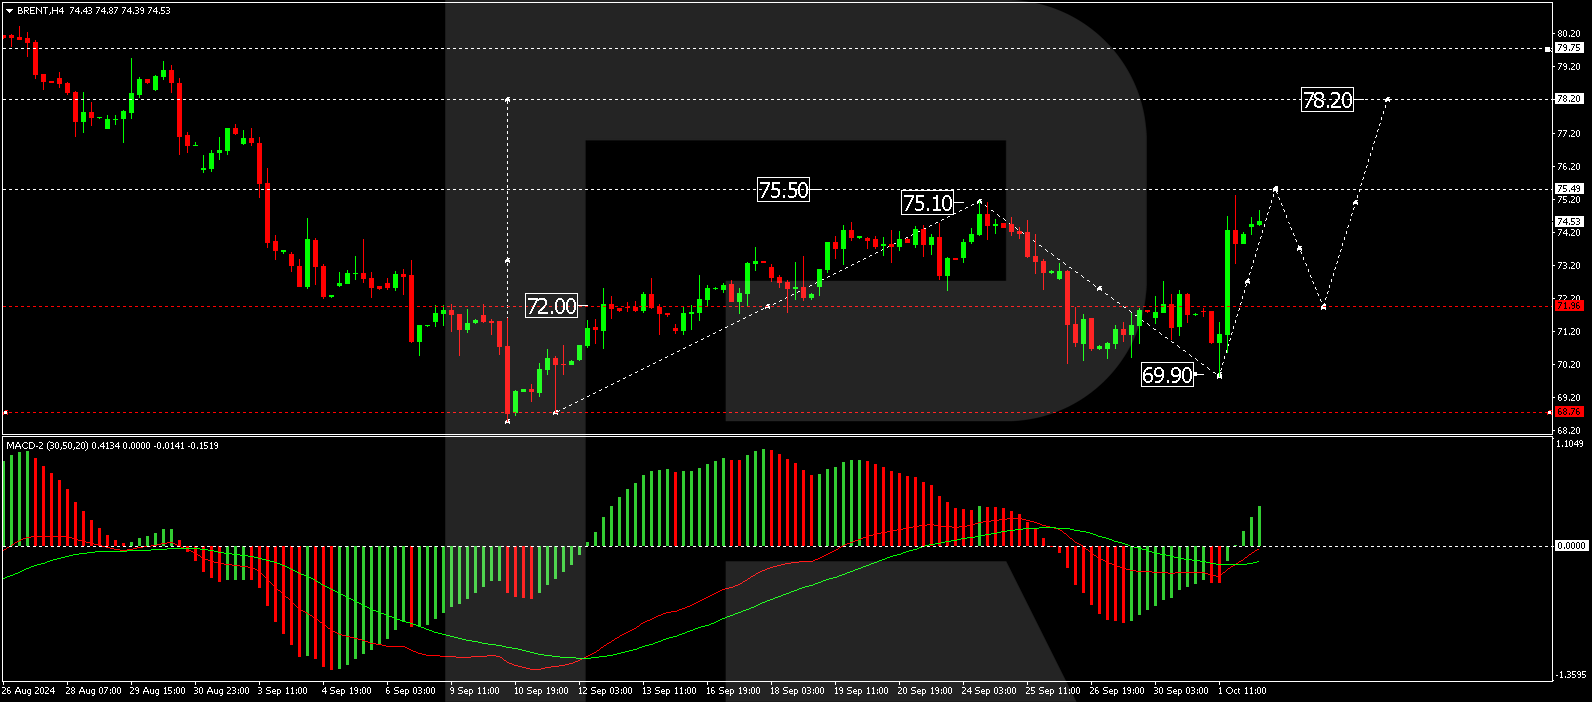
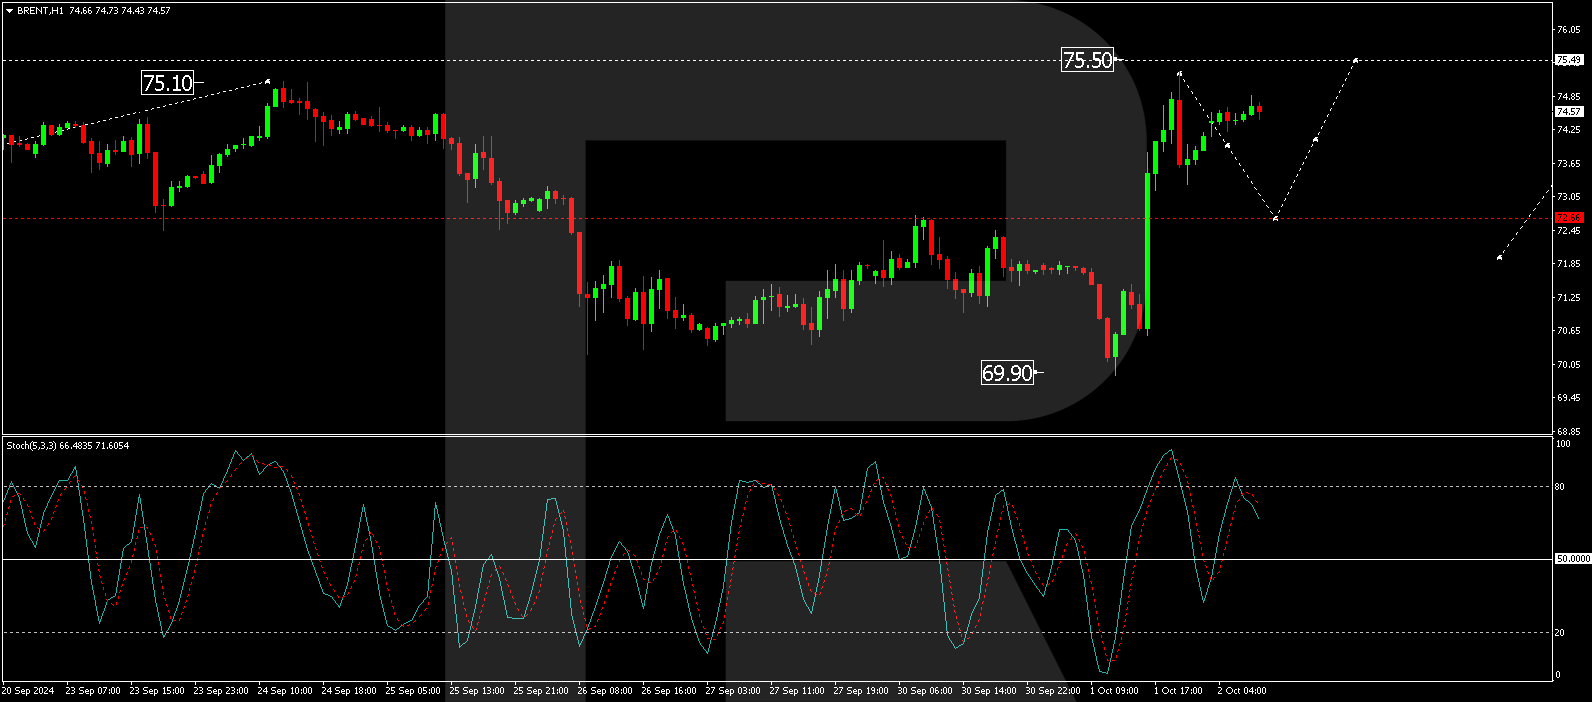
WTI crude oil prices rose 5% to $73.7 per barrel on Thursday, extending the week’s gains to a one-month high after US President Biden refrained from directly condemning the likelihood that Israel could attack Iran’s oil facilities. In addition to the subsequent shock to short-term supplies that such an attack would lead to, oil prices also rose thanks to the risk premium in futures amid the growing escalation of geopolitical tensions in the Middle East. Tel Aviv has vowed to retaliate against Iran with a series of ballistic missiles this week, as well as increase its activity in Beirut as it battles Hezbollah. Meanwhile, signs of resilience in the US economy also supported the outlook for fuel demand in the world’s top oil consumer.
Asian markets traded flat yesterday. Japan’s Nikkei 225 (JP225) was up 1.97%, China’s FTSE China A50 (CHA50) was not trading due to holidays, Hong Kong’s Hang Seng (HK50) was down 1.47%, and Australia’s ASX 200 (AU200) was positive 0.09%. The weakening yen has improved the outlook for Japan’s export-oriented industry and is supporting local equities. Earlier this week, newly inaugurated Prime Minister Shigeru Ishiba and his Economy Minister Ryosei Akazawa urged caution before proceeding with further interest rate hikes.
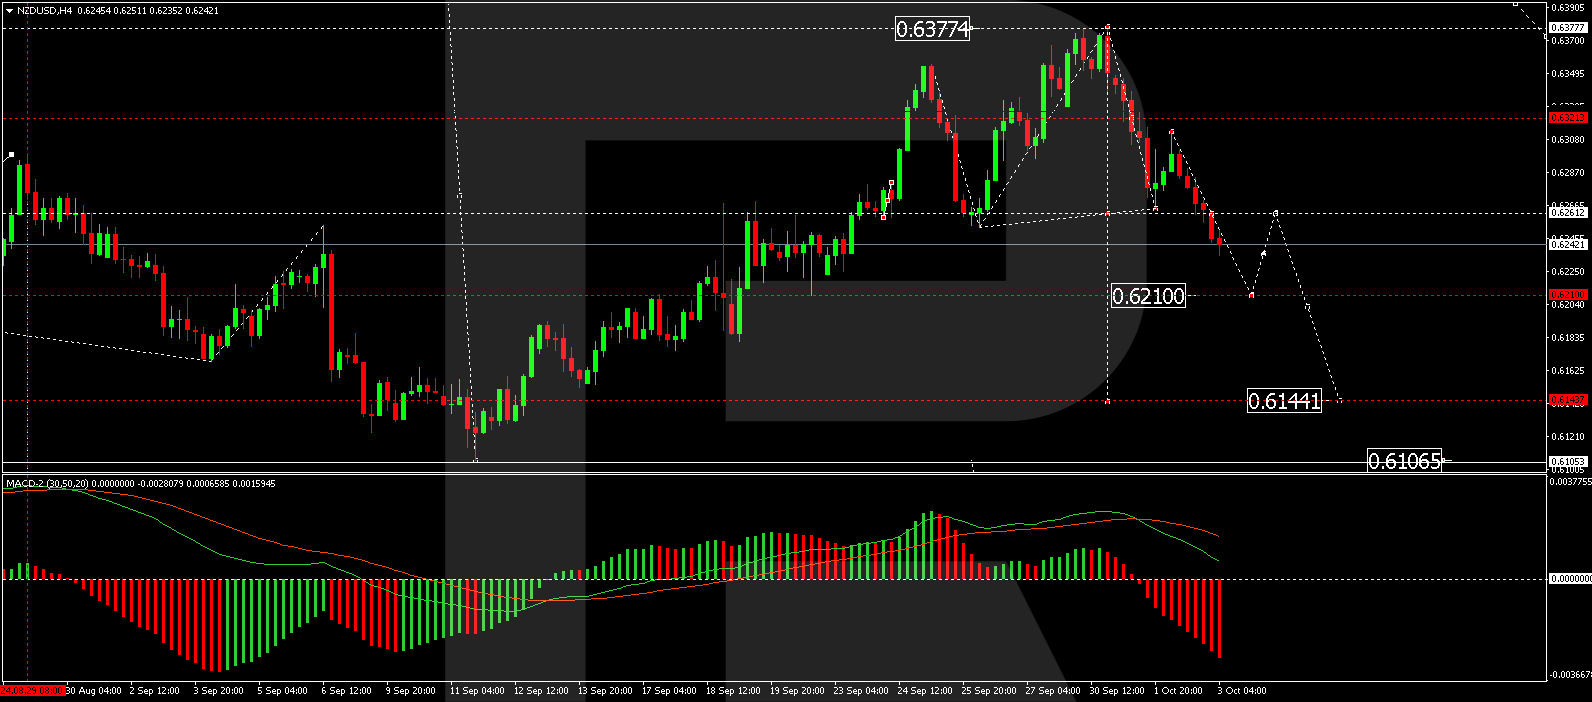
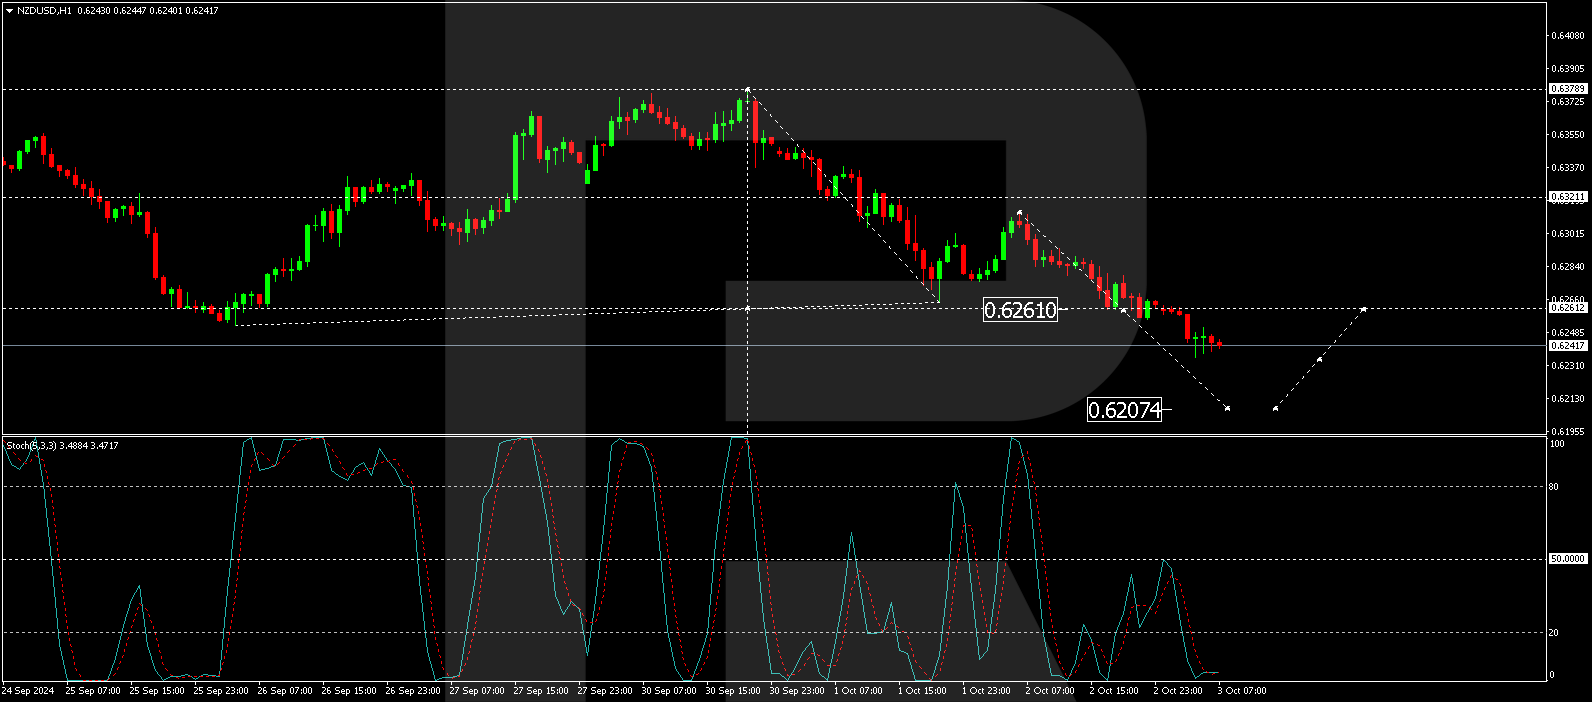
The New Zealand dollar (NZD/USD) fell to a 2-week low. Traders expect a significant interest rate cut by the Reserve Bank of New Zealand (RBNZ) amid concerns over the country’s economic growth prospects. The RBNZ began its monetary easing cycle in August with a 25 basis point rate cut and is expected to make further reductions. Markets are now fully pricing in the possibility of a half-point rate cut at next week’s Central Bank meeting.
S&P 500 (US500) 5,699.94 −9.60 (−0.17%)
Dow Jones (US30) 42,011.59 −184.93 (−0.44%)
DAX (DE40) 19,015.41 −149.34 (−0.78%)
FTSE 100 (UK100) 8,282.52 −8.34 (−0.10%)
USD Index 101.94 +0.26 (+0.26%)
News feed for: 2024.10.04
- Switzerland Unemployment Rate (m/m) at 08:45 (GMT+3);
- UK Construction PMI (m/m) at 11:30 (GMT+3);
- US Nonfarm Payrolls (m/m) at 15:30 (GMT+3);
- US Unemployment Rate (m/m) at 15:30 (GMT+3);
- US FOMC Member Williams Speaks (m/m) at 16:00 (GMT+3);
- Canada Ivey PMI (m/m) at 17:00 (GMT+3).
By JustMarkets
This article reflects a personal opinion and should not be interpreted as an investment advice, and/or offer, and/or a persistent request for carrying out financial transactions, and/or a guarantee, and/or a forecast of future events.