By InvestMacro
Here are the latest charts and statistics for the Commitment of Traders (COT) data published by the Commodities Futures Trading Commission (CFTC).
The latest COT data is updated through Tuesday October 15th and shows a quick view of how large traders (for-profit speculators and commercial entities) were positioned in the futures markets.
Weekly Speculator Changes led by Gold & Platinum
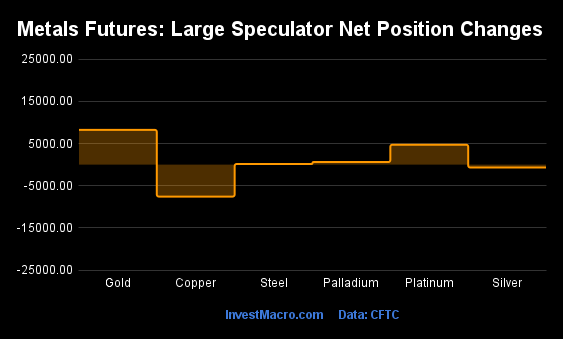
The COT metals markets speculator bets were overall higher this week as four out of the six metals markets we cover had higher positioning while the other two markets had lower speculator contracts.
Leading the gains for the metals was Gold (8,254 contracts) with Platinum (4,730 contracts), Palladium (619 contracts), and Steel (159 contracts) also showing positive weeks.
The markets with declines in speculator bets for the week were Copper (-7,574 contracts) with Silver (-683 contracts) registering lower bets on the week as well.
Metals Net Speculators Leaderboard
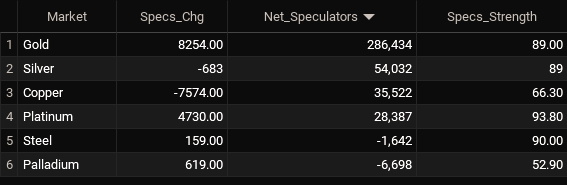
Legend: Weekly Speculators Change | Speculators Current Net Position | Speculators Strength Score compared to last 3-Years (0-100 range)
Strength Scores led by Platinum & Steel
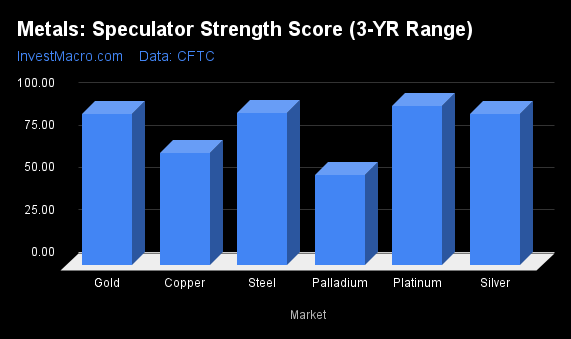
COT Strength Scores (a normalized measure of Speculator positions over a 3-Year range, from 0 to 100 where above 80 is Extreme-Bullish and below 20 is Extreme-Bearish) showed that Platinum (94 percent) and Steel (90 percent) lead the metals markets this week. Silver (89 percent) and Gold (89 percent) come in as the next highest in the weekly strength scores.
Palladium (53 percent) comes in at the lowest strength level currently but remains higher than its 3-Year midpoint (50 percent).
Strength Statistics:
Gold (89.0 percent) vs Gold previous week (85.9 percent)
Silver (89.1 percent) vs Silver previous week (90.0 percent)
Copper (66.3 percent) vs Copper previous week (73.4 percent)
Platinum (93.8 percent) vs Platinum previous week (81.2 percent)
Palladium (52.9 percent) vs Palladium previous week (48.4 percent)
Steel (90.0 percent) vs Palladium previous week (89.4 percent)
Platinum & Palladium top the 6-Week Strength Trends
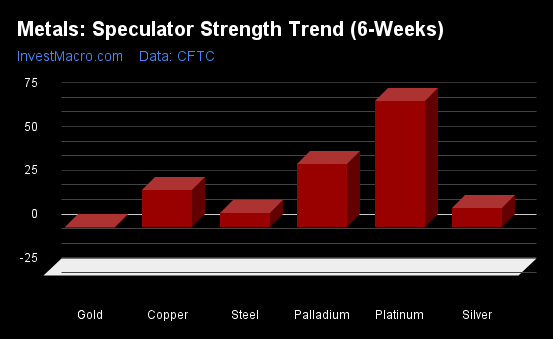
COT Strength Score Trends (or move index, calculates the 6-week changes in strength scores) showed that Platinum (72 percent) and Palladium (36 percent) lead the past six weeks trends for metals.
Gold (-0.4 percent) leads the downside trend scores currently with the only negative trend.
Move Statistics:
Gold (-0.4 percent) vs Gold previous week (-6.2 percent)
Silver (10.6 percent) vs Silver previous week (3.4 percent)
Copper (21.0 percent) vs Copper previous week (24.2 percent)
Platinum (72.1 percent) vs Platinum previous week (21.2 percent)
Palladium (36.2 percent) vs Palladium previous week (33.3 percent)
Steel (8.0 percent) vs Steel previous week (11.8 percent)
Individual Markets:
Gold Comex Futures:
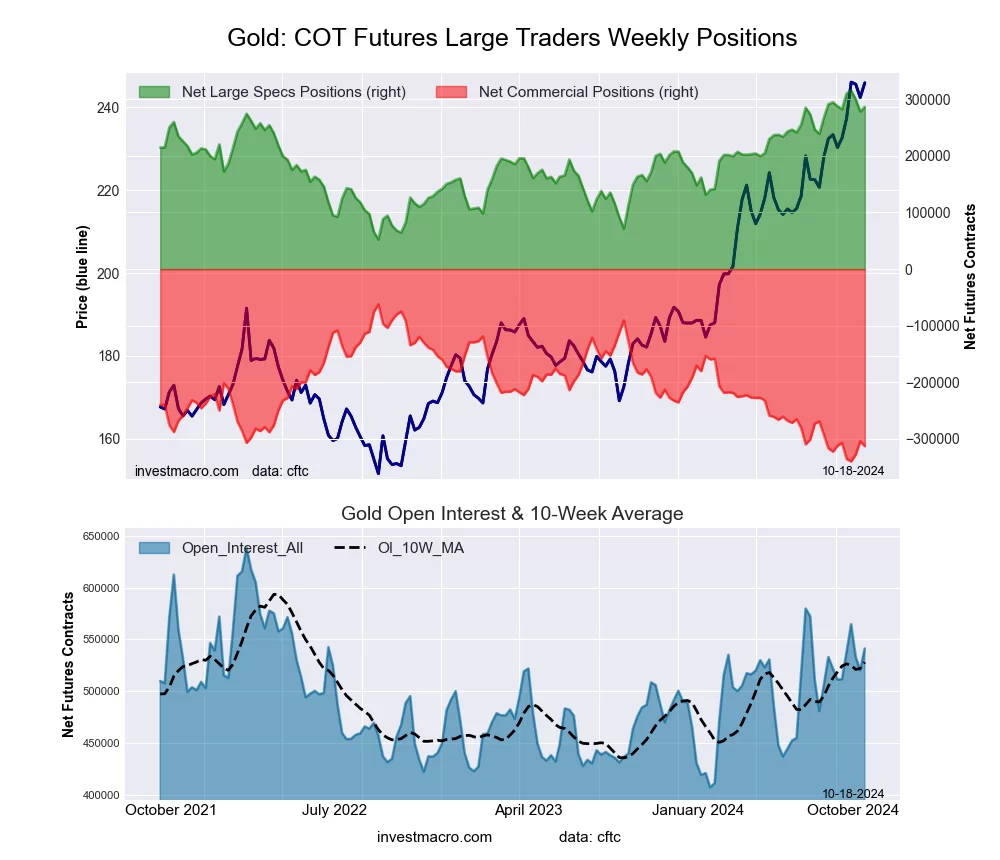 The Gold Comex Futures large speculator standing this week recorded a net position of 286,434 contracts in the data reported through Tuesday. This was a weekly lift of 8,254 contracts from the previous week which had a total of 278,180 net contracts.
This week’s current strength score (the trader positioning range over the past three years, measured from 0 to 100) shows the speculators are currently Bullish-Extreme with a score of 89.0 percent. The commercials are Bearish-Extreme with a score of 9.7 percent and the small traders (not shown in chart) are Bullish with a score of 65.6 percent.
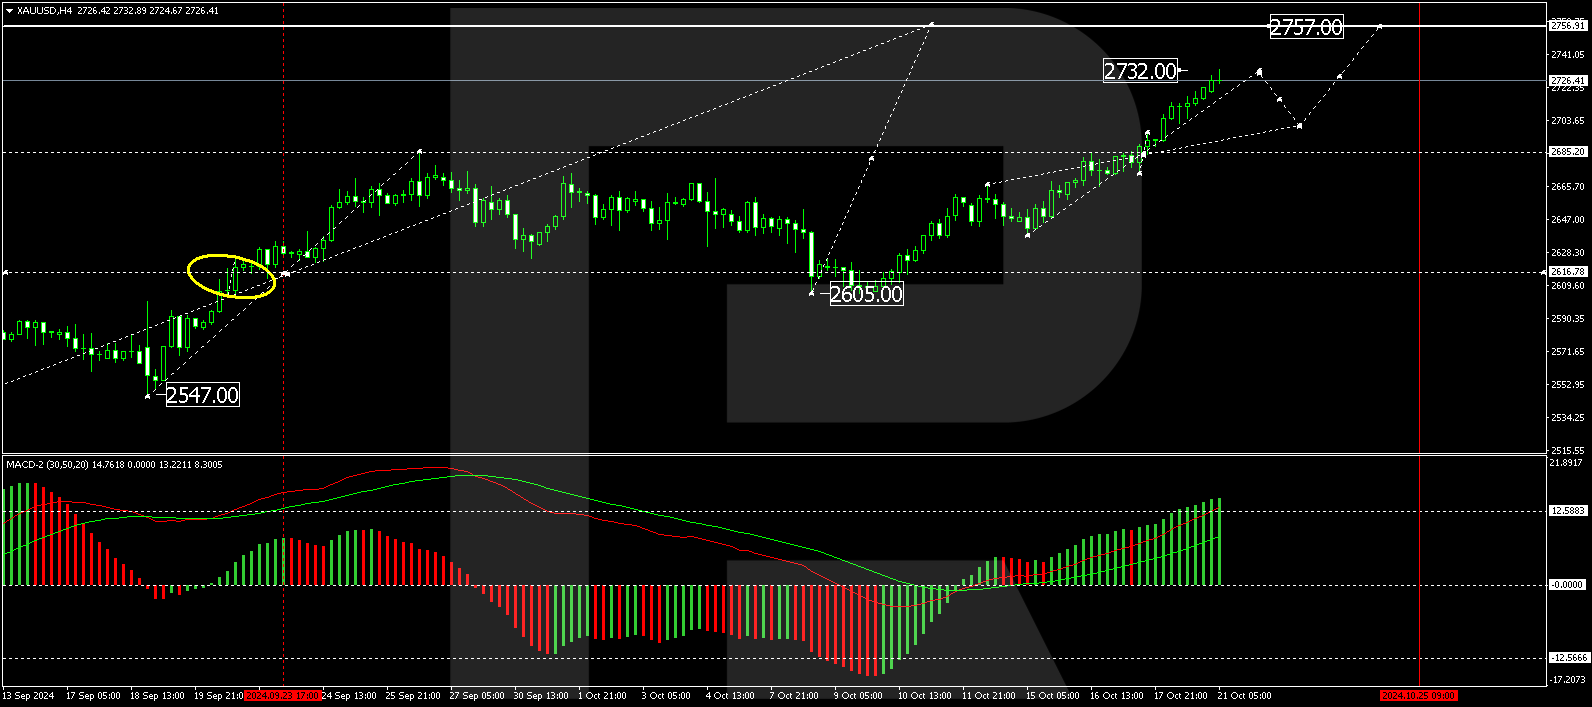
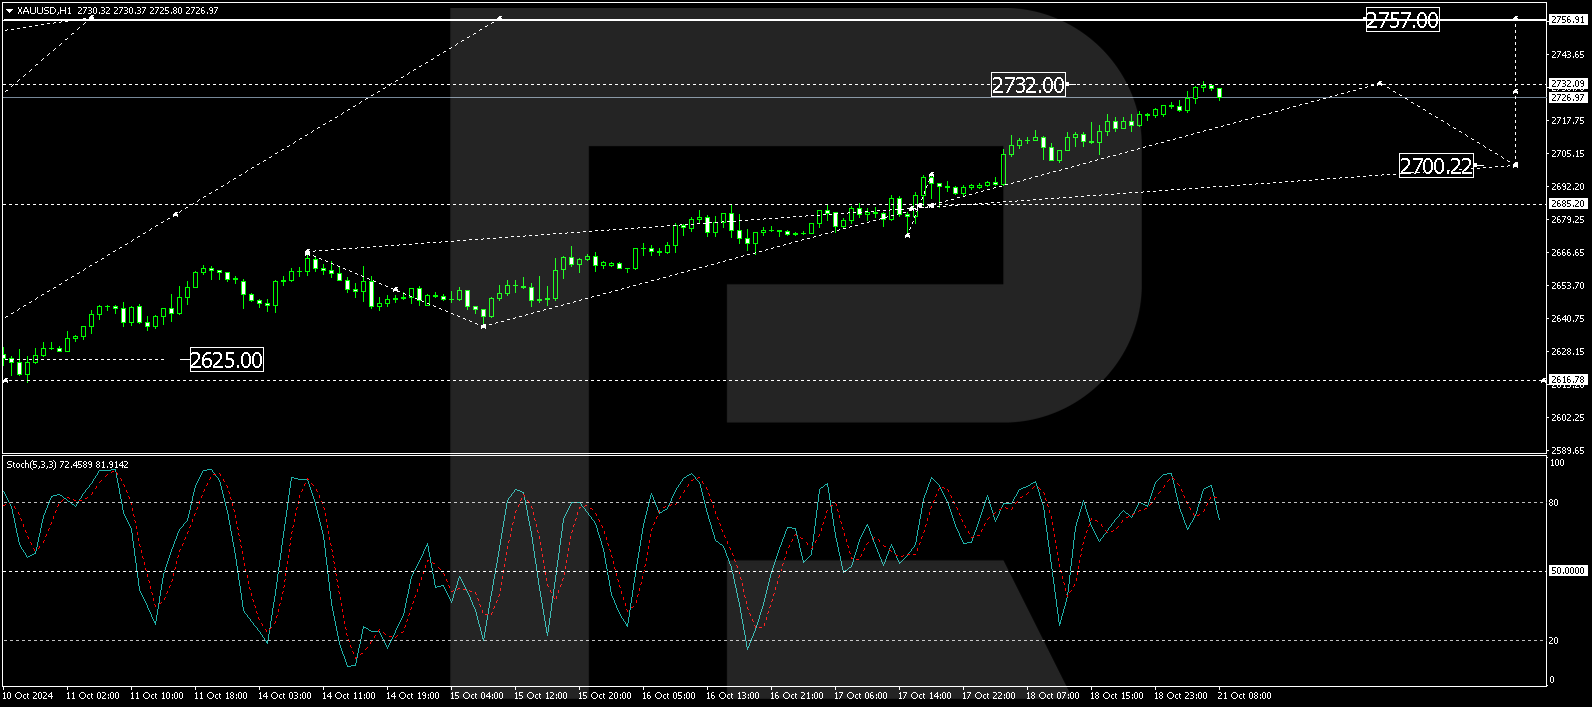
Price Trend-Following Model: Strong Uptrend
Our weekly trend-following model classifies the current market price position as: Strong Uptrend.
| Gold Futures Statistics | SPECULATORS | COMMERCIALS | SMALL TRADERS |
| – Percent of Open Interest Longs: | 66.1 | 12.9 | 9.3 |
| – Percent of Open Interest Shorts: | 13.1 | 70.7 | 4.5 |
| – Net Position: | 286,434 | -312,658 | 26,224 |
| – Gross Longs: | 357,494 | 70,028 | 50,490 |
| – Gross Shorts: | 71,060 | 382,686 | 24,266 |
| – Long to Short Ratio: | 5.0 to 1 | 0.2 to 1 | 2.1 to 1 |
| NET POSITION TREND: | | | |
| – Strength Index Score (3 Year Range Pct): | 89.0 | 9.7 | 65.6 |
| – Strength Index Reading (3 Year Range): | Bullish-Extreme | Bearish-Extreme | Bullish |
| NET POSITION MOVEMENT INDEX: | | | |
| – 6-Week Change in Strength Index: | -0.4 | -0.3 | 6.8 |
Silver Comex Futures:
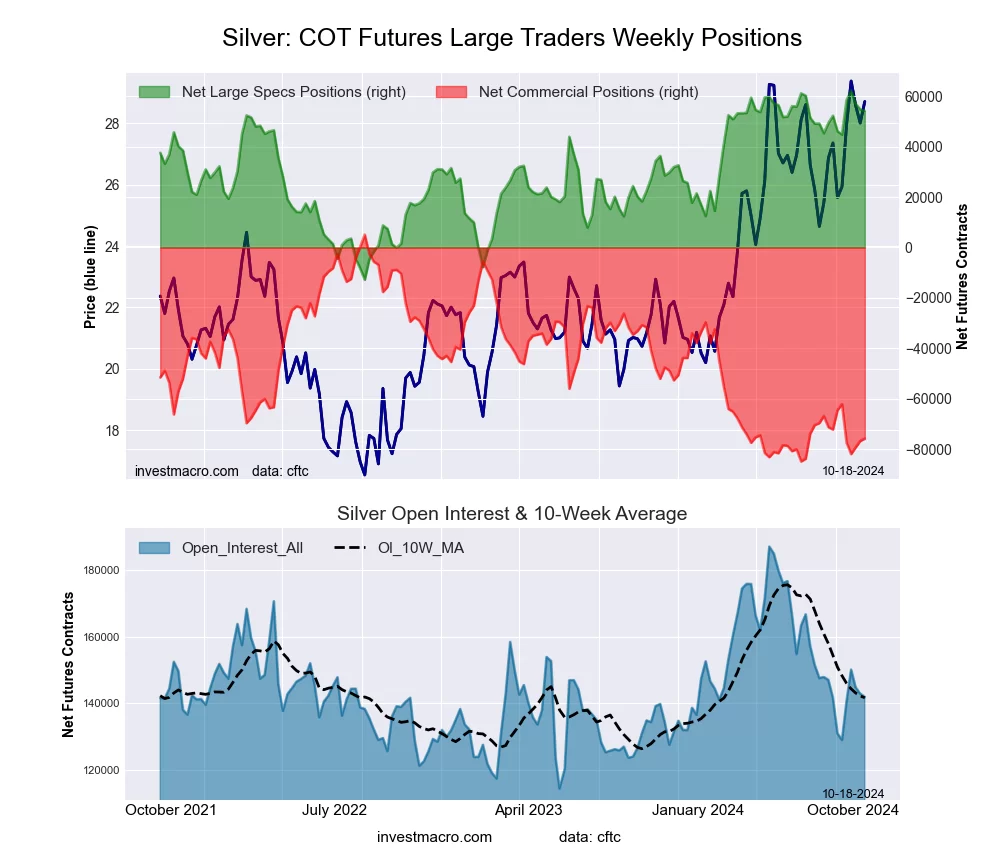 The Silver Comex Futures large speculator standing this week recorded a net position of 54,032 contracts in the data reported through Tuesday. This was a weekly decrease of -683 contracts from the previous week which had a total of 54,715 net contracts.
This week’s current strength score (the trader positioning range over the past three years, measured from 0 to 100) shows the speculators are currently Bullish-Extreme with a score of 89.1 percent. The commercials are Bearish-Extreme with a score of 10.1 percent and the small traders (not shown in chart) are Bullish with a score of 75.8 percent.
Price Trend-Following Model: Strong Uptrend
Our weekly trend-following model classifies the current market price position as: Strong Uptrend.
| Silver Futures Statistics | SPECULATORS | COMMERCIALS | SMALL TRADERS |
| – Percent of Open Interest Longs: | 49.3 | 21.1 | 22.3 |
| – Percent of Open Interest Shorts: | 11.3 | 74.5 | 7.0 |
| – Net Position: | 54,032 | -75,758 | 21,726 |
| – Gross Longs: | 70,024 | 29,913 | 31,621 |
| – Gross Shorts: | 15,992 | 105,671 | 9,895 |
| – Long to Short Ratio: | 4.4 to 1 | 0.3 to 1 | 3.2 to 1 |
| NET POSITION TREND: | | | |
| – Strength Index Score (3 Year Range Pct): | 89.1 | 10.1 | 75.8 |
| – Strength Index Reading (3 Year Range): | Bullish-Extreme | Bearish-Extreme | Bullish |
| NET POSITION MOVEMENT INDEX: | | | |
| – 6-Week Change in Strength Index: | 10.6 | -12.5 | 15.8 |
Copper Grade #1 Futures:
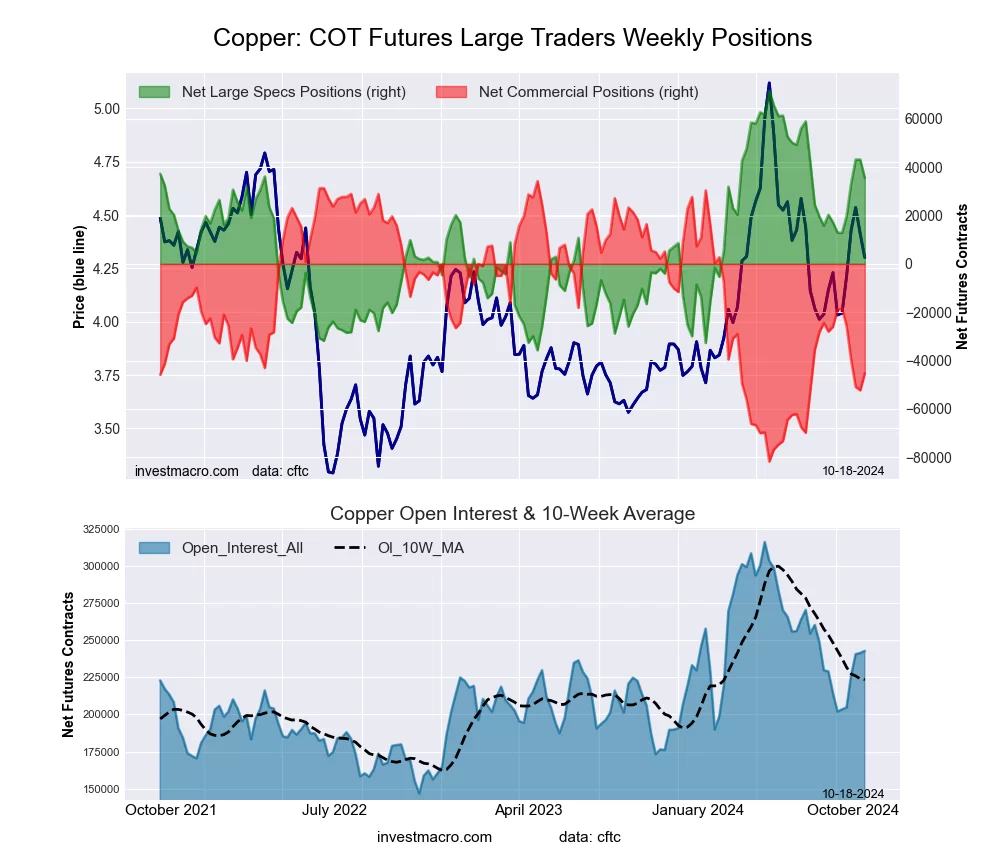 The Copper Grade #1 Futures large speculator standing this week recorded a net position of 35,522 contracts in the data reported through Tuesday. This was a weekly lowering of -7,574 contracts from the previous week which had a total of 43,096 net contracts.
This week’s current strength score (the trader positioning range over the past three years, measured from 0 to 100) shows the speculators are currently Bullish with a score of 66.3 percent. The commercials are Bearish with a score of 31.5 percent and the small traders (not shown in chart) are Bullish with a score of 76.4 percent.
Price Trend-Following Model: Downtrend
Our weekly trend-following model classifies the current market price position as: Downtrend.
| Copper Futures Statistics | SPECULATORS | COMMERCIALS | SMALL TRADERS |
| – Percent of Open Interest Longs: | 40.8 | 31.0 | 8.1 |
| – Percent of Open Interest Shorts: | 26.2 | 49.7 | 4.1 |
| – Net Position: | 35,522 | -45,219 | 9,697 |
| – Gross Longs: | 99,036 | 75,372 | 19,752 |
| – Gross Shorts: | 63,514 | 120,591 | 10,055 |
| – Long to Short Ratio: | 1.6 to 1 | 0.6 to 1 | 2.0 to 1 |
| NET POSITION TREND: | | | |
| – Strength Index Score (3 Year Range Pct): | 66.3 | 31.5 | 76.4 |
| – Strength Index Reading (3 Year Range): | Bullish | Bearish | Bullish |
| NET POSITION MOVEMENT INDEX: | | | |
| – 6-Week Change in Strength Index: | 21.0 | -22.6 | 22.4 |
Platinum Futures:
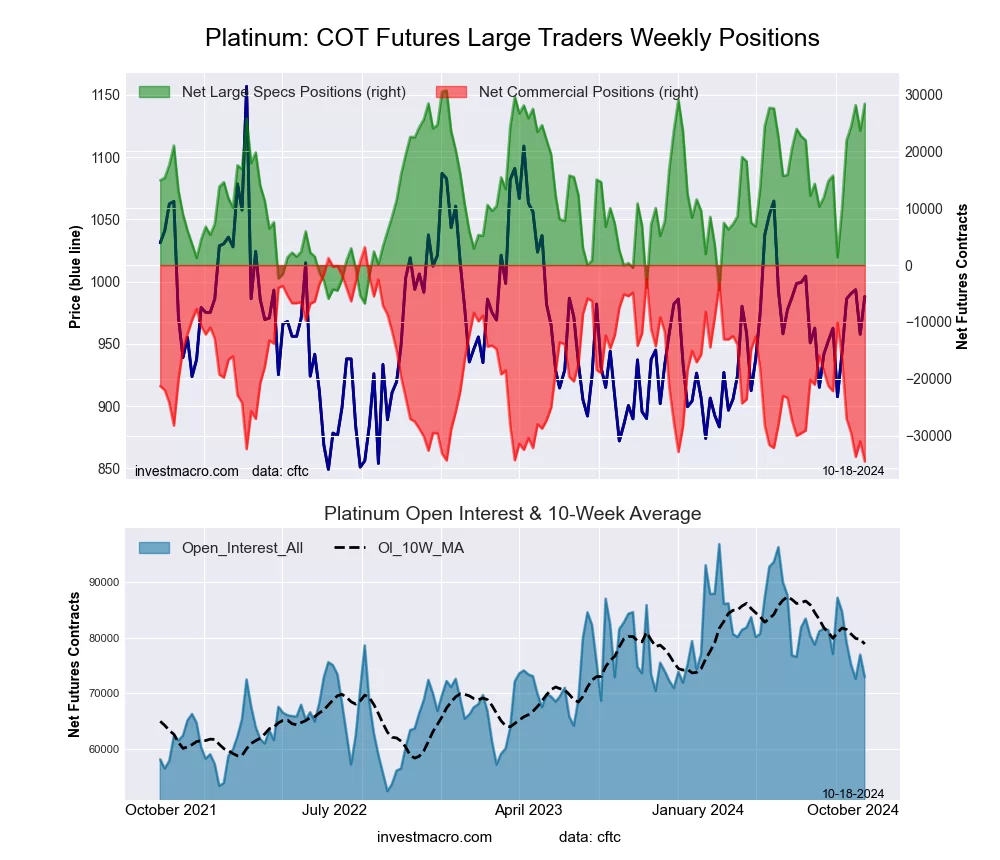 The Platinum Futures large speculator standing this week recorded a net position of 28,387 contracts in the data reported through Tuesday. This was a weekly increase of 4,730 contracts from the previous week which had a total of 23,657 net contracts.
This week’s current strength score (the trader positioning range over the past three years, measured from 0 to 100) shows the speculators are currently Bullish-Extreme with a score of 93.8 percent. The commercials are Bearish-Extreme with a score of 0.0 percent and the small traders (not shown in chart) are Bullish with a score of 59.3 percent.
Price Trend-Following Model: Weak Downtrend
Our weekly trend-following model classifies the current market price position as: Weak Downtrend.
| Platinum Futures Statistics | SPECULATORS | COMMERCIALS | SMALL TRADERS |
| – Percent of Open Interest Longs: | 63.8 | 19.4 | 12.1 |
| – Percent of Open Interest Shorts: | 24.9 | 66.8 | 3.7 |
| – Net Position: | 28,387 | -34,539 | 6,152 |
| – Gross Longs: | 46,523 | 14,171 | 8,855 |
| – Gross Shorts: | 18,136 | 48,710 | 2,703 |
| – Long to Short Ratio: | 2.6 to 1 | 0.3 to 1 | 3.3 to 1 |
| NET POSITION TREND: | | | |
| – Strength Index Score (3 Year Range Pct): | 93.8 | 0.0 | 59.3 |
| – Strength Index Reading (3 Year Range): | Bullish-Extreme | Bearish-Extreme | Bullish |
| NET POSITION MOVEMENT INDEX: | | | |
| – 6-Week Change in Strength Index: | 72.1 | -64.7 | -40.7 |
Palladium Futures:
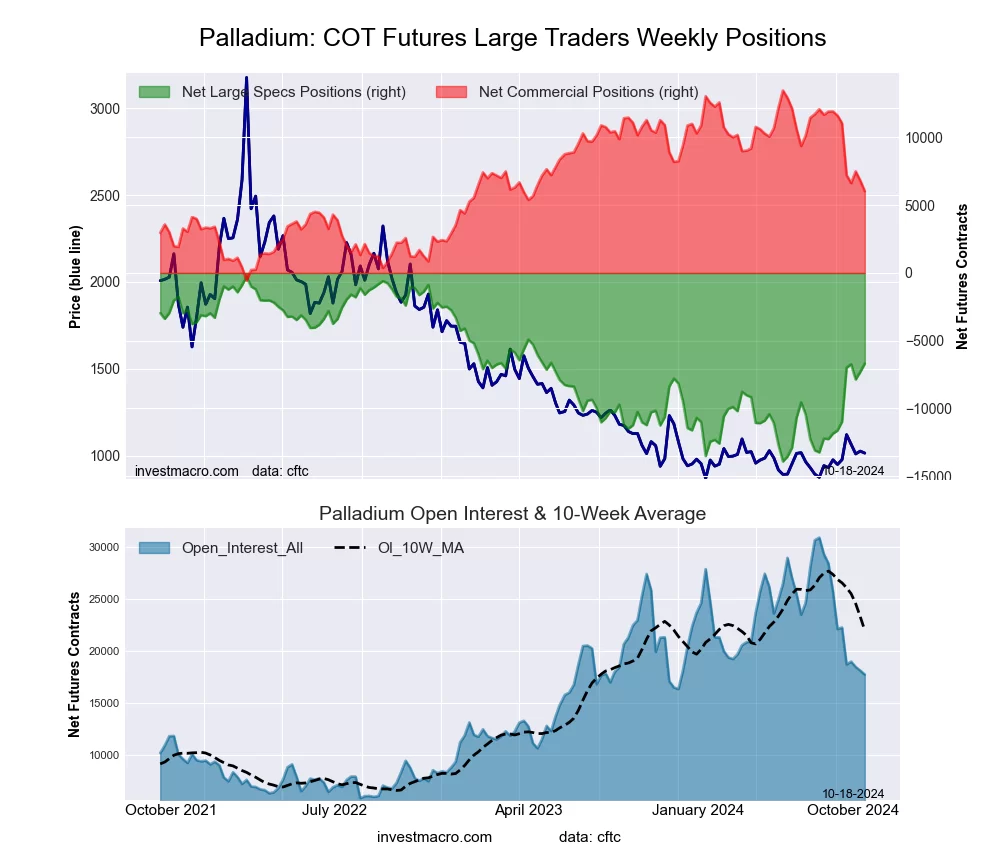 The Palladium Futures large speculator standing this week recorded a net position of -6,698 contracts in the data reported through Tuesday. This was a weekly advance of 619 contracts from the previous week which had a total of -7,317 net contracts.
This week’s current strength score (the trader positioning range over the past three years, measured from 0 to 100) shows the speculators are currently Bullish with a score of 52.9 percent. The commercials are Bearish with a score of 47.0 percent and the small traders (not shown in chart) are Bullish with a score of 65.6 percent.
Price Trend-Following Model: Strong Uptrend
Our weekly trend-following model classifies the current market price position as: Strong Uptrend.
| Palladium Futures Statistics | SPECULATORS | COMMERCIALS | SMALL TRADERS |
| – Percent of Open Interest Longs: | 25.6 | 58.0 | 11.2 |
| – Percent of Open Interest Shorts: | 63.4 | 24.0 | 7.4 |
| – Net Position: | -6,698 | 6,032 | 666 |
| – Gross Longs: | 4,537 | 10,294 | 1,987 |
| – Gross Shorts: | 11,235 | 4,262 | 1,321 |
| – Long to Short Ratio: | 0.4 to 1 | 2.4 to 1 | 1.5 to 1 |
| NET POSITION TREND: | | | |
| – Strength Index Score (3 Year Range Pct): | 52.9 | 47.0 | 65.6 |
| – Strength Index Reading (3 Year Range): | Bullish | Bearish | Bullish |
| NET POSITION MOVEMENT INDEX: | | | |
| – 6-Week Change in Strength Index: | 36.2 | -39.9 | 31.6 |
Steel Futures Futures:
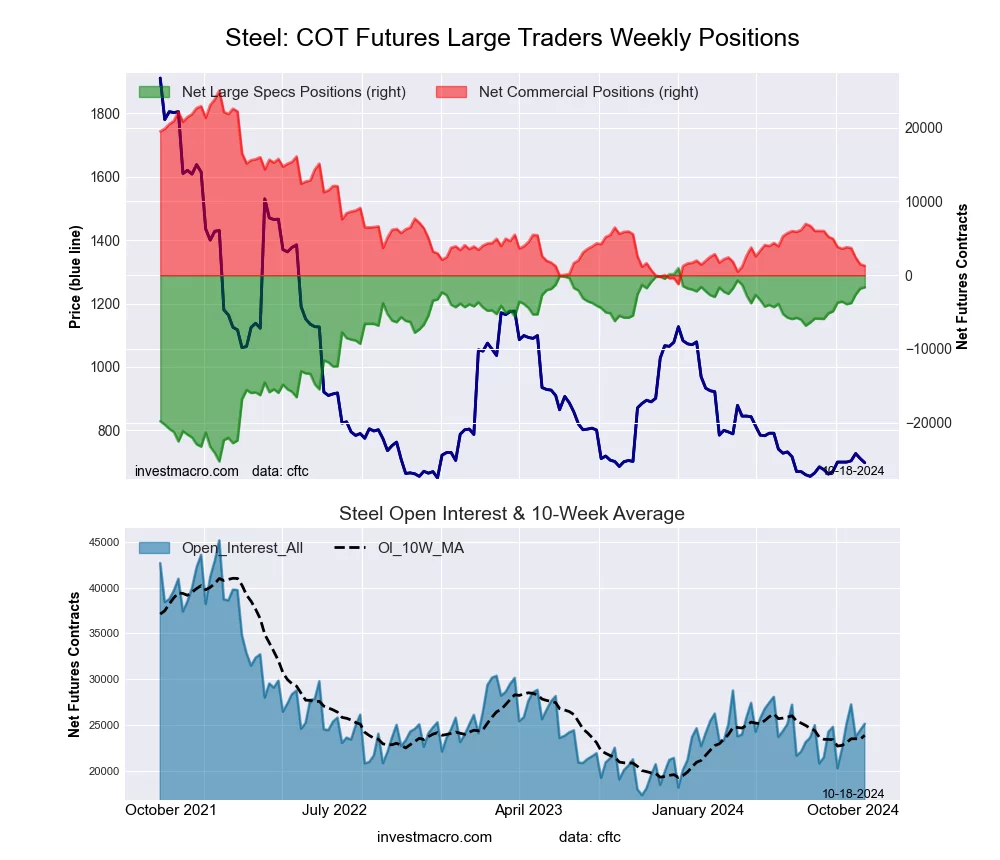 The Steel Futures large speculator standing this week recorded a net position of -1,642 contracts in the data reported through Tuesday. This was a weekly boost of 159 contracts from the previous week which had a total of -1,801 net contracts.
This week’s current strength score (the trader positioning range over the past three years, measured from 0 to 100) shows the speculators are currently Bullish-Extreme with a score of 90.0 percent. The commercials are Bearish-Extreme with a score of 9.5 percent and the small traders (not shown in chart) are Bullish with a score of 71.9 percent.
Price Trend-Following Model: Uptrend
Our weekly trend-following model classifies the current market price position as: Uptrend.
| Steel Futures Statistics | SPECULATORS | COMMERCIALS | SMALL TRADERS |
| – Percent of Open Interest Longs: | 22.5 | 69.9 | 1.9 |
| – Percent of Open Interest Shorts: | 29.1 | 64.8 | 0.5 |
| – Net Position: | -1,642 | 1,281 | 361 |
| – Gross Longs: | 5,668 | 17,562 | 481 |
| – Gross Shorts: | 7,310 | 16,281 | 120 |
| – Long to Short Ratio: | 0.8 to 1 | 1.1 to 1 | 4.0 to 1 |
| NET POSITION TREND: | | | |
| – Strength Index Score (3 Year Range Pct): | 90.0 | 9.5 | 71.9 |
| – Strength Index Reading (3 Year Range): | Bullish-Extreme | Bearish-Extreme | Bullish |
| NET POSITION MOVEMENT INDEX: | | | |
| – 6-Week Change in Strength Index: | 8.0 | -9.7 | 50.9 |
Article By InvestMacro – Receive our weekly COT Newsletter
*COT Report: The COT data, released weekly to the public each Friday, is updated through the most recent Tuesday (data is 3 days old) and shows a quick view of how large speculators or non-commercials (for-profit traders) were positioned in the futures markets.
The CFTC categorizes trader positions according to commercial hedgers (traders who use futures contracts for hedging as part of the business), non-commercials (large traders who speculate to realize trading profits) and nonreportable traders (usually small traders/speculators) as well as their open interest (contracts open in the market at time of reporting). See CFTC criteria here.