
By RoboForex Analytical Department
The AUD/USD pair shows signs of potential resurgence as it trades near 0.6802, consolidating within a sideways range at its local peaks towards the end of August. The Australian dollar has appreciated by almost 4% over the month, bolstered by high consumer price index figures that underline persistent inflationary pressures in Australia.
In July, Australian inflation was recorded at 3.5% year-over-year, slightly decelerating from June’s figures but still surpassing expectations of 3.4%. This has supported the Reserve Bank of Australia’s (RBA) decision to maintain a tight monetary policy stance. Despite the challenges in effectively curbing high inflation, the RBA has adopted a watchful rather than aggressive approach, which could yield favourable outcomes over a longer horizon.
During the last RBA meeting, discussions were held regarding a potential rate hike, though it was ultimately decided to keep rates unchanged. The RBA’s cautious approach, combined with the earlier general weakness of the US dollar, has provided a solid backdrop for the Australian dollar’s strength.
AUD/USD technical analysis
Free Reports:
 Get our Weekly Commitment of Traders Reports - See where the biggest traders (Hedge Funds and Commercial Hedgers) are positioned in the futures markets on a weekly basis.
 Sign Up for Our Stock Market Newsletter – Get updated on News, Charts & Rankings of Public Companies when you join our Stocks Newsletter
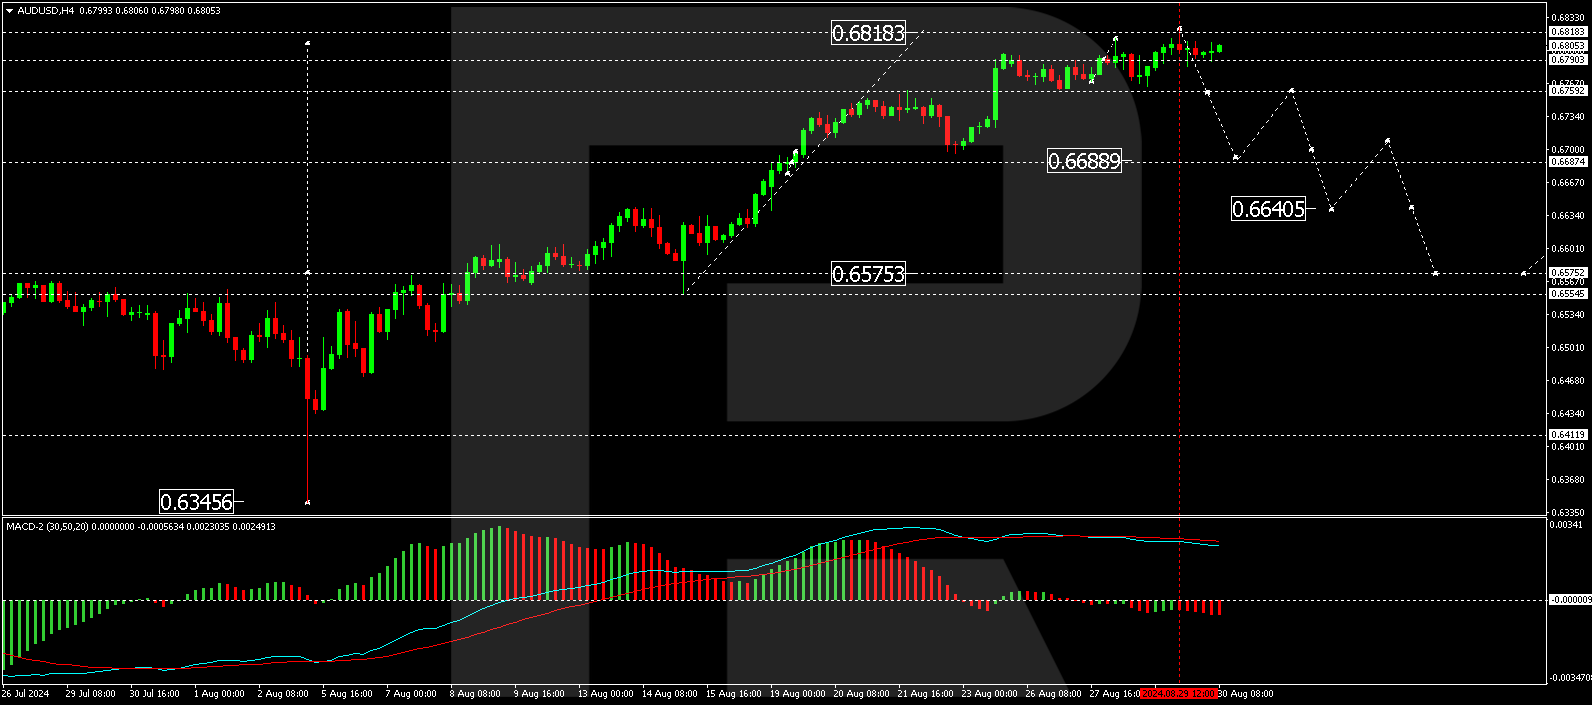
On the H4 chart, AUD/USD recently completed an upward wave to 0.6822, followed by a downward impulse to 0.6784. Currently, a corrective movement to 0.6816 is anticipated, potentially establishing the upper limits of the consolidation range. A downward exit from this range could initiate a new decline to 0.6760. A break below this level might signal the start of a new downward trend towards 0.6640, with a potential continuation to 0.6575. The MACD indicator supports this bearish scenario, with its signal line at the highs and trending downward.
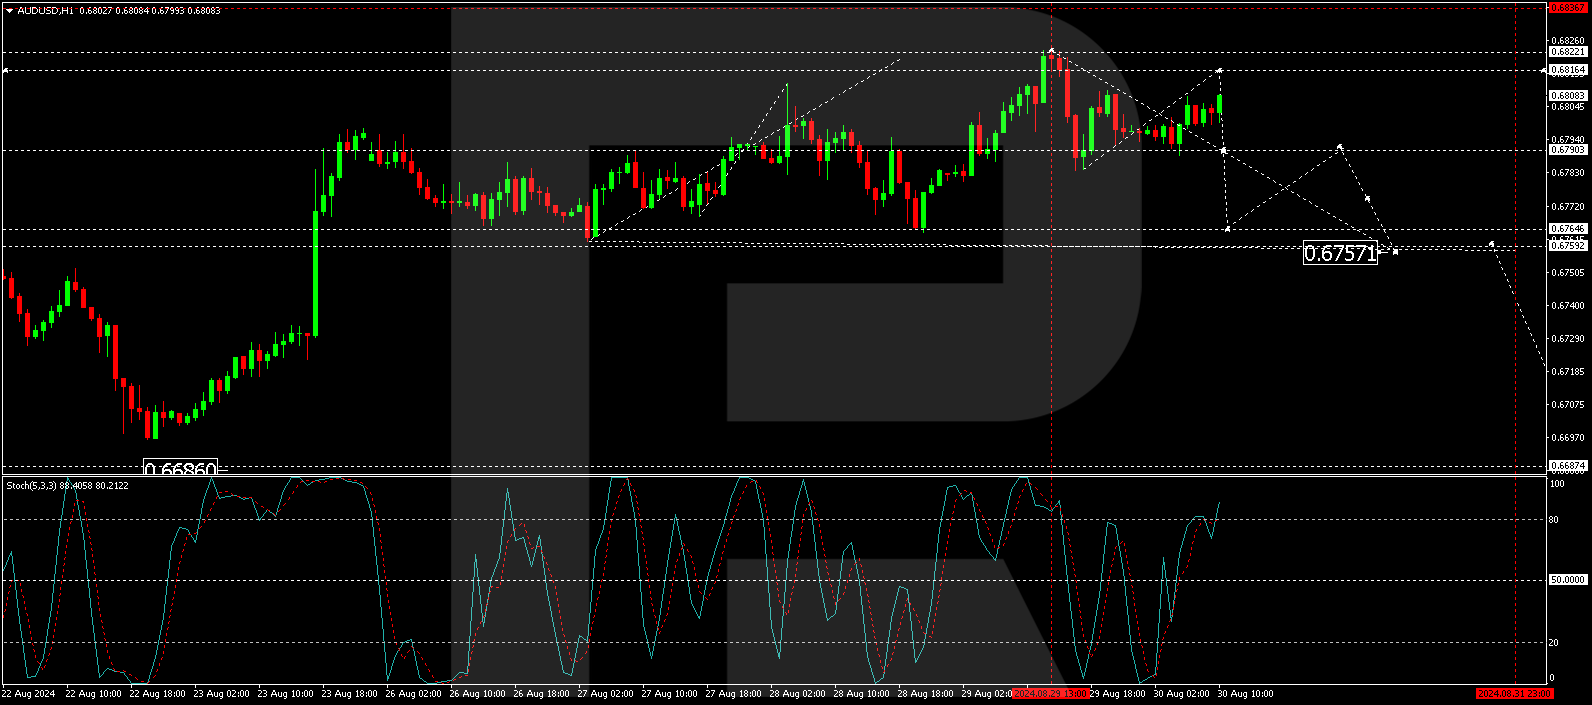
On the H1 chart, the pair is forming a correction to 0.6816. Following this correction, a downward movement to 0.6764 is expected, potentially extending to 0.6757. The Stochastic oscillator, currently above 80, indicates a likely decline to 20, supporting the possibility of continued downward momentum after the correction.
Disclaimer
Any forecasts contained herein are based on the author’s particular opinion. This analysis may not be treated as trading advice. RoboForex bears no responsibility for trading results based on trading recommendations and reviews contained herein.

- The US indices sell off amid renewed US-Iran clashes. Oil jumps by 7% Jul 30, 2026
- USD/JPY Temporary in Equilibrium: Multiple Factors in Focus Jul 30, 2026
- GBP/USD at Month’s Lows: The Outlook Remains Weak Jul 29, 2026
- Crude oil falls below $80 per barrel. Australia sees inflation slowdown Jul 29, 2026
- The US Tech sector hit by sell‑off. Oil prices decline on renewed negotiations Jul 28, 2026
- Gold Declines, Focus on Fed and Falling Oil Prices Jul 28, 2026
- This week will be one of the most crowded for central‑bank meetings Jul 27, 2026
- EUR/USD Ahead of a Key Week: Holding Near Lows Jul 27, 2026
- COT Metals Charts: Weekly Speculator Changes led by Copper Jul 26, 2026
- COT Bonds Charts: Speculator Bets led by SOFR 3-Months & 5-Year Bonds Jul 26, 2026