By InvestMacro
Here are the latest charts and statistics for the Commitment of Traders (COT) data published by the Commodities Futures Trading Commission (CFTC).
The latest COT data is updated through Tuesday November 12th and shows a quick view of how large market participants (for-profit speculators and commercial traders) were positioned in the futures markets. All currency positions are in direct relation to the US dollar where, for example, a bet for the euro is a bet that the euro will rise versus the dollar while a bet against the euro will be a bet that the euro will decline versus the dollar.
Weekly Large Speculator bets led by EuroFX & British Pound
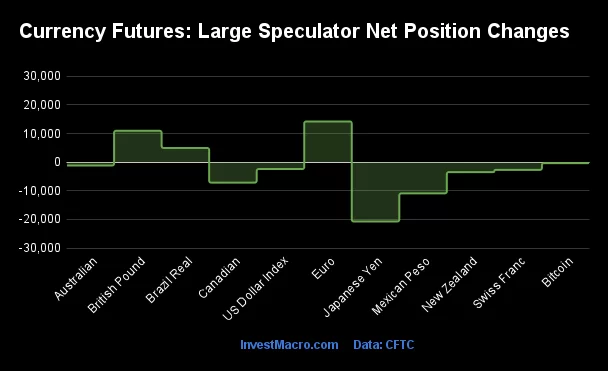
The COT currency market speculator bets were overall lower this week as three out of the eleven currency markets we cover had higher positioning while the other eight markets had lower speculator contracts.
Leading the gains for the currency markets was the EuroFX (14,216 contracts) with the British Pound (10,966 contracts) and the Brazilian Real (4,948 contracts) also pulling out a positive week.
The currencies seeing declines in speculator bets on the week were the Japanese Yen (-20,735 contracts), the Mexican Peso (-10,902 contracts), the Canadian Dollar (-7,160 contracts), the New Zealand Dollar (-3,461 contracts), the Swiss Franc (-2,713 contracts), the US Dollar Index (-2,407 contracts), the Australian Dollar (-1,181 contracts) and with Bitcoin (-341 contracts) also seeing lower bets on the week.
Speculators cut US Dollar Index bets despite rising price
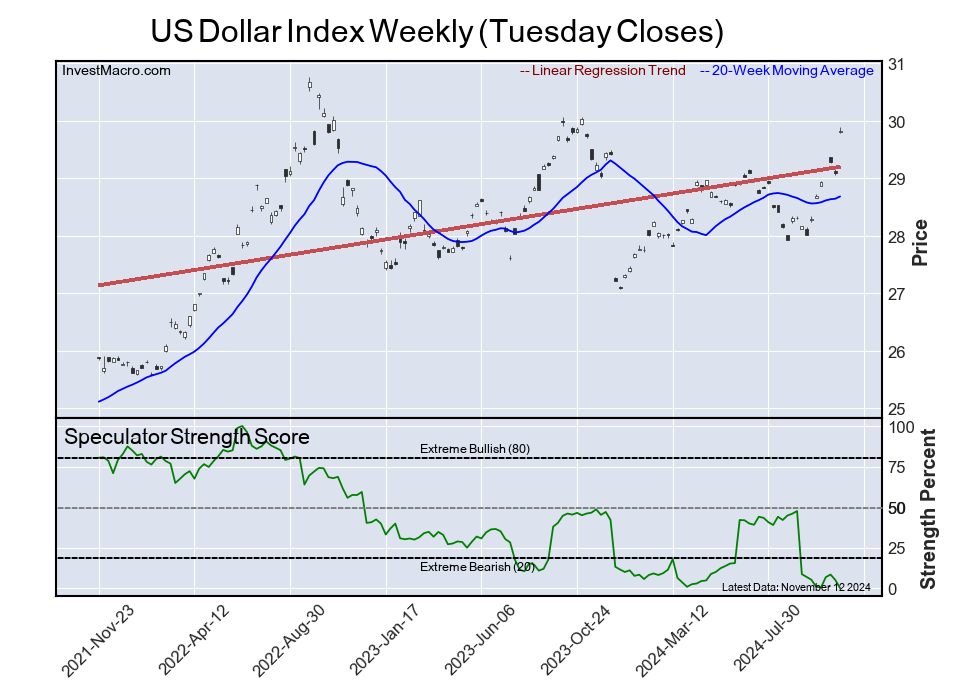
Highlighting the COT currency’s data this week is the decrease in the speculative bets for the US Dollar Index market despite the rising Dollar Index price.
The large speculative US Dollar Index positions fell this week for the second straight week and have now declined for seven out of the past nine weeks. The nine-week decrease amounts to a total of -22,522 contracts being taken off the speculator position. This weakness has now taken the US Dollar Index spec standing, currently at -2,312 contracts, to the lowest level since March 9th of 2021, a distance of 192 weeks ago.
The US Dollar Index speculator positioning is currently in stark contrast with the pricing action of the USD at the moment. The Dollar Index or DX futures prices have been on a strong uptrend with gains in six out of the past seven weeks. The DX has gone from a price of approximately 100.20 at the end of September to this week’s close at 106.61 on Friday. This is a strong rise of over 6 percent in just seven weeks.
Speculators, especially in currencies, usually act as trend-followers and are typically buying prices that are on the rise (or selling prices on the decline) but have not been participating in this move on a net basis.
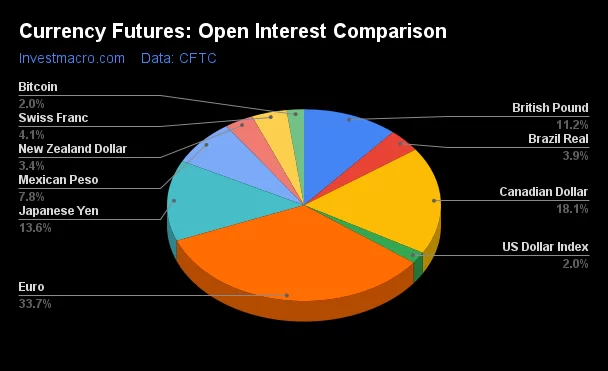
One way for this situation to resolve itself can be with the speculators closing out their shorts and switching to longs which could add to the Dollar’s strength, and potentially push the USD Index through the resistance area of 106.50-107.00. Prices recently were stopped at this resistance level in October of 2023 and in April of 2024. Otherwise, prices could stall out here at this level again and head lower which would bring prices back in line with the current small bearish speculator positioning. One helpful clue will be if open interest (OI) starts to rise as currently OI is relatively low at just approximately 33 percent of the 3-Year range. An increase in open interest is needed to bring more fuel to the market and keep a trend going.
The US Federal Reserve also has their next central bank interest rate meeting on December 18th and the currently, there is a 62 percent probability for a 25 basis point rate cut and a 38 percent probability for a rate hold at the current level of 4.5-4.75 percent, according to the CME Fedwatch Tool. The coming weeks and into the new year will likely be pivotal in terms of where the Dollar heads to next.
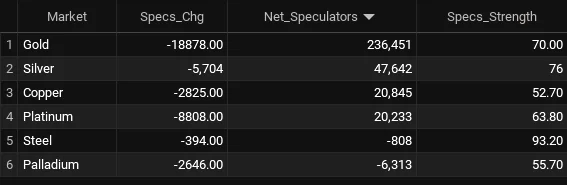
Currencies Net Speculators Leaderboard
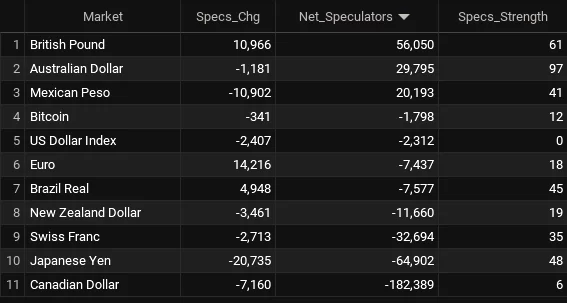
Legend: Weekly Speculators Change | Speculators Current Net Position | Speculators Strength Score compared to last 3-Years (0-100 range)
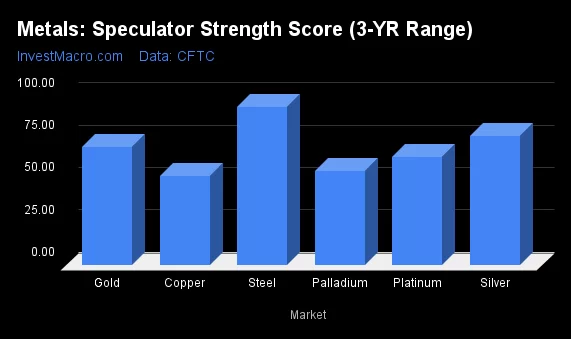
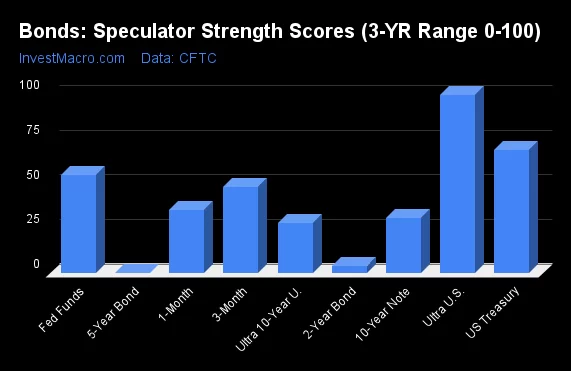
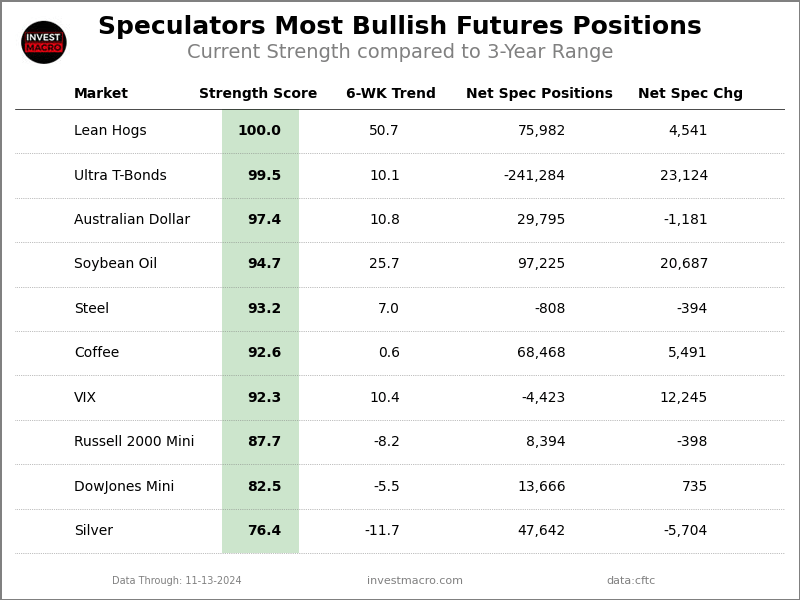
Strength Scores led by Australian Dollar
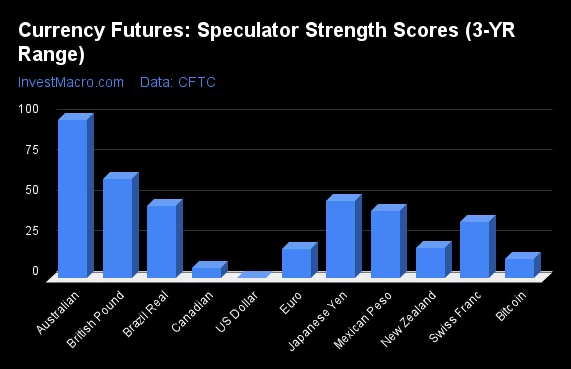
COT Strength Scores (a normalized measure of Speculator positions over a 3-Year range, from 0 to 100 where above 80 is Extreme-Bullish and below 20 is Extreme-Bearish) showed that the Australian Dollar (97 percent) leads the currency markets this week. The British Pound (61 percent), the Japanese Yen (48 percent), the Brazilian Real (45 percent) and the Mexican Peso (41 percent) come in as the next highest in the weekly strength scores.
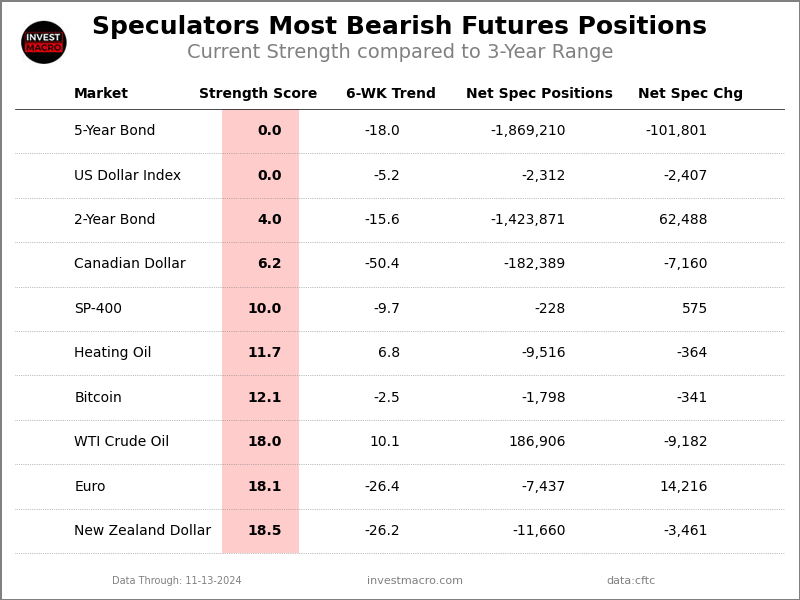
On the downside, the US Dollar Index (0 percent), the Canadian Dollar (6 percent), Bitcoin (12 percent), the Euro (18 percent) and the New Zealand Dollar (18 percent) come in at the lowest strength levels currently and are in Extreme-Bearish territory (below 20 percent).
3-Year Strength Statistics:
US Dollar Index (0.0 percent) vs US Dollar Index previous week (5.1 percent)
EuroFX (18.1 percent) vs EuroFX previous week (12.1 percent)
British Pound Sterling (61.3 percent) vs British Pound Sterling previous week (56.4 percent)
Japanese Yen (47.7 percent) vs Japanese Yen previous week (56.0 percent)
Swiss Franc (34.6 percent) vs Swiss Franc previous week (40.1 percent)
Canadian Dollar (6.2 percent) vs Canadian Dollar previous week (9.4 percent)
Australian Dollar (97.4 percent) vs Australian Dollar previous week (98.3 percent)
New Zealand Dollar (18.5 percent) vs New Zealand Dollar previous week (25.1 percent)
Mexican Peso (41.4 percent) vs Mexican Peso previous week (46.7 percent)
Brazilian Real (44.9 percent) vs Brazilian Real previous week (40.2 percent)
Bitcoin (12.1 percent) vs Bitcoin previous week (19.5 percent)
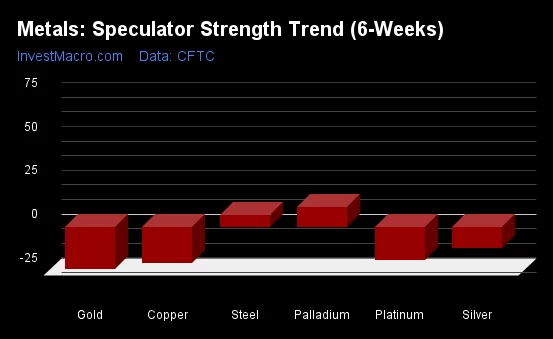
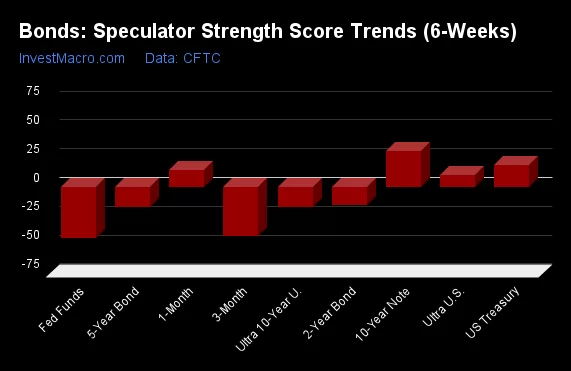
Brazilian Real & Australian Dollar top the 6-Week Strength Trends
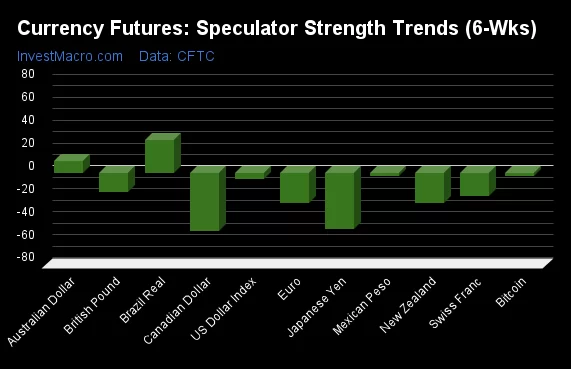
COT Strength Score Trends (or move index, calculates the 6-week changes in strength scores) showed that the Brazilian Real (29 percent) and the Australian Dollar (11 percent) lead the past six weeks trends for the currencies.
The Canadian Dollar (-50 percent) leads the downside trend scores currently with the Japanese Yen (-49 percent), the New Zealand Dollar (-26 percent) and the Euro (-26 percent) following next with lower trend scores.
3-Year Strength Trends:
US Dollar Index (-5.2 percent) vs US Dollar Index previous week (-1.8 percent)
EuroFX (-26.4 percent) vs EuroFX previous week (-39.3 percent)
British Pound Sterling (-16.9 percent) vs British Pound Sterling previous week (-18.8 percent)
Japanese Yen (-48.6 percent) vs Japanese Yen previous week (-44.0 percent)
Swiss Franc (-19.9 percent) vs Swiss Franc previous week (-21.7 percent)
Canadian Dollar (-50.4 percent) vs Canadian Dollar previous week (-49.1 percent)
Australian Dollar (10.8 percent) vs Australian Dollar previous week (30.0 percent)
New Zealand Dollar (-26.2 percent) vs New Zealand Dollar previous week (-13.0 percent)
Mexican Peso (-3.0 percent) vs Mexican Peso previous week (9.2 percent)
Brazilian Real (29.1 percent) vs Brazilian Real previous week (23.5 percent)
Bitcoin (-2.5 percent) vs Bitcoin previous week (1.9 percent)
Individual COT Forex Markets:
US Dollar Index Futures:
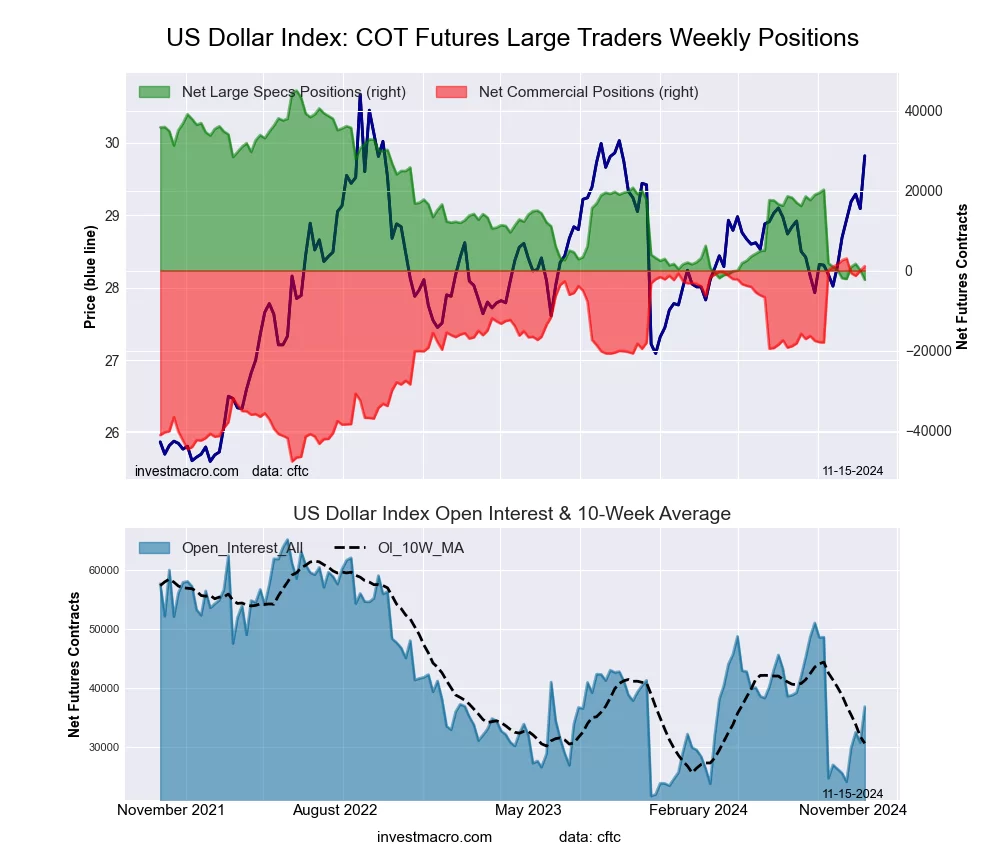 The US Dollar Index large speculator standing this week totaled a net position of -2,312 contracts in the data reported through Tuesday. This was a weekly fall of -2,407 contracts from the previous week which had a total of 95 net contracts.
This week’s current strength score (the trader positioning range over the past three years, measured from 0 to 100) shows the speculators are currently Bearish-Extreme with a score of 0.0 percent. The commercials are Bullish-Extreme with a score of 96.2 percent and the small traders (not shown in chart) are Bearish with a score of 36.1 percent.
Price Trend-Following Model: Strong Uptrend
Our weekly trend-following model classifies the current market price position as: Strong Uptrend.
| US DOLLAR INDEX Statistics | SPECULATORS | COMMERCIALS | SMALL TRADERS |
| – Percent of Open Interest Longs: | 62.3 | 21.1 | 12.0 |
| – Percent of Open Interest Shorts: | 68.5 | 18.1 | 8.8 |
| – Net Position: | -2,312 | 1,100 | 1,212 |
| – Gross Longs: | 22,958 | 7,778 | 4,443 |
| – Gross Shorts: | 25,270 | 6,678 | 3,231 |
| – Long to Short Ratio: | 0.9 to 1 | 1.2 to 1 | 1.4 to 1 |
| NET POSITION TREND: | | | |
| – Strength Index Score (3 Year Range Pct): | 0.0 | 96.2 | 36.1 |
| – Strength Index Reading (3 Year Range): | Bearish-Extreme | Bullish-Extreme | Bearish |
| NET POSITION MOVEMENT INDEX: | | | |
| – 6-Week Change in Strength Index: | -5.2 | -0.9 | 30.6 |
Euro Currency Futures:
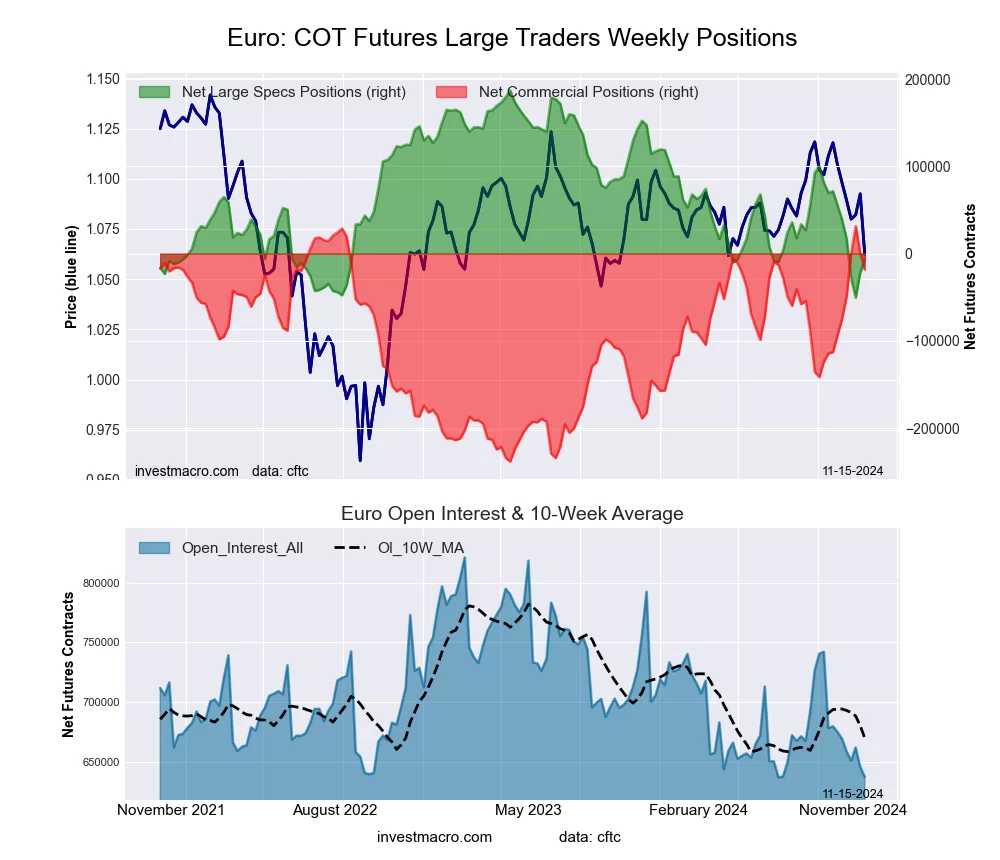 The Euro Currency large speculator standing this week totaled a net position of -7,437 contracts in the data reported through Tuesday. This was a weekly rise of 14,216 contracts from the previous week which had a total of -21,653 net contracts.
This week’s current strength score (the trader positioning range over the past three years, measured from 0 to 100) shows the speculators are currently Bearish-Extreme with a score of 18.1 percent. The commercials are Bullish-Extreme with a score of 81.6 percent and the small traders (not shown in chart) are Bearish with a score of 28.6 percent.
Price Trend-Following Model: Strong Downtrend
Our weekly trend-following model classifies the current market price position as: Strong Downtrend.
| EURO Currency Statistics | SPECULATORS | COMMERCIALS | SMALL TRADERS |
| – Percent of Open Interest Longs: | 25.1 | 57.6 | 12.3 |
| – Percent of Open Interest Shorts: | 26.3 | 60.4 | 8.3 |
| – Net Position: | -7,437 | -18,274 | 25,711 |
| – Gross Longs: | 160,003 | 366,805 | 78,432 |
| – Gross Shorts: | 167,440 | 385,079 | 52,721 |
| – Long to Short Ratio: | 1.0 to 1 | 1.0 to 1 | 1.5 to 1 |
| NET POSITION TREND: | | | |
| – Strength Index Score (3 Year Range Pct): | 18.1 | 81.6 | 28.6 |
| – Strength Index Reading (3 Year Range): | Bearish-Extreme | Bullish-Extreme | Bearish |
| NET POSITION MOVEMENT INDEX: | | | |
| – 6-Week Change in Strength Index: | -26.4 | 28.0 | -28.9 |
British Pound Sterling Futures:
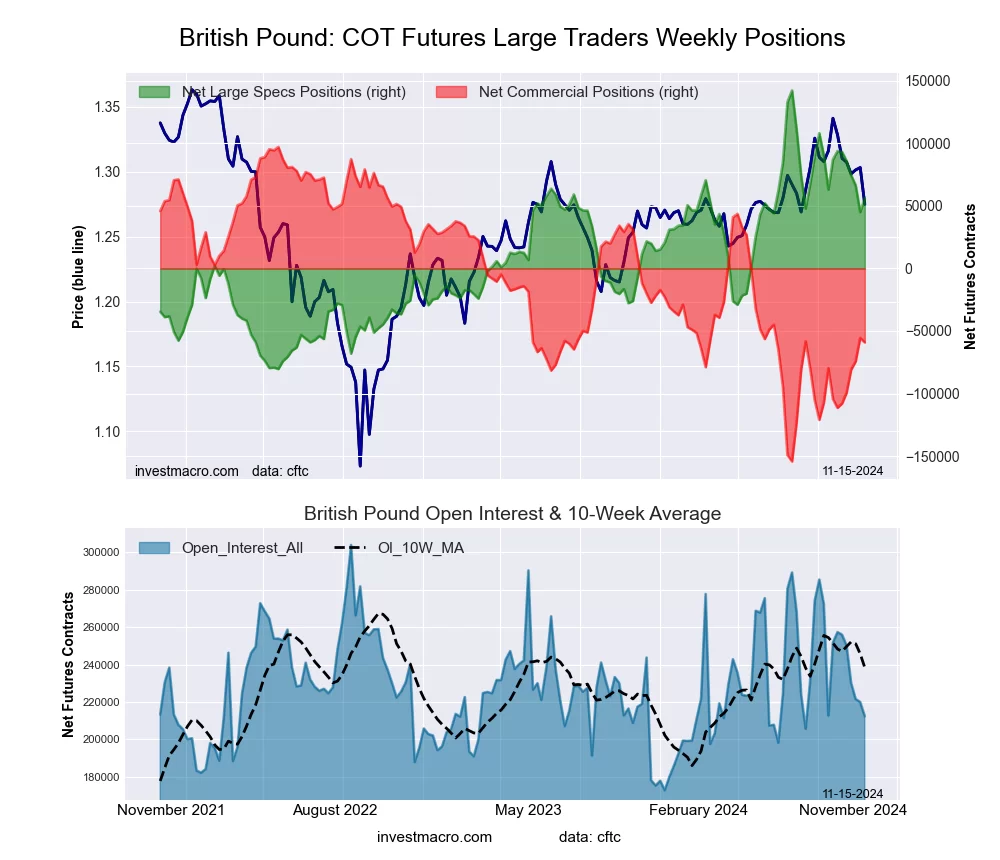 The British Pound Sterling large speculator standing this week totaled a net position of 56,050 contracts in the data reported through Tuesday. This was a weekly advance of 10,966 contracts from the previous week which had a total of 45,084 net contracts.
This week’s current strength score (the trader positioning range over the past three years, measured from 0 to 100) shows the speculators are currently Bullish with a score of 61.3 percent. The commercials are Bearish with a score of 37.8 percent and the small traders (not shown in chart) are Bullish with a score of 68.7 percent.
Price Trend-Following Model: Weak Uptrend
Our weekly trend-following model classifies the current market price position as: Weak Uptrend.
| BRITISH POUND Statistics | SPECULATORS | COMMERCIALS | SMALL TRADERS |
| – Percent of Open Interest Longs: | 56.5 | 25.7 | 13.8 |
| – Percent of Open Interest Shorts: | 30.1 | 53.6 | 12.4 |
| – Net Position: | 56,050 | -59,148 | 3,098 |
| – Gross Longs: | 119,992 | 54,642 | 29,405 |
| – Gross Shorts: | 63,942 | 113,790 | 26,307 |
| – Long to Short Ratio: | 1.9 to 1 | 0.5 to 1 | 1.1 to 1 |
| NET POSITION TREND: | | | |
| – Strength Index Score (3 Year Range Pct): | 61.3 | 37.8 | 68.7 |
| – Strength Index Reading (3 Year Range): | Bullish | Bearish | Bullish |
| NET POSITION MOVEMENT INDEX: | | | |
| – 6-Week Change in Strength Index: | -16.9 | 20.8 | -30.6 |
Japanese Yen Futures:
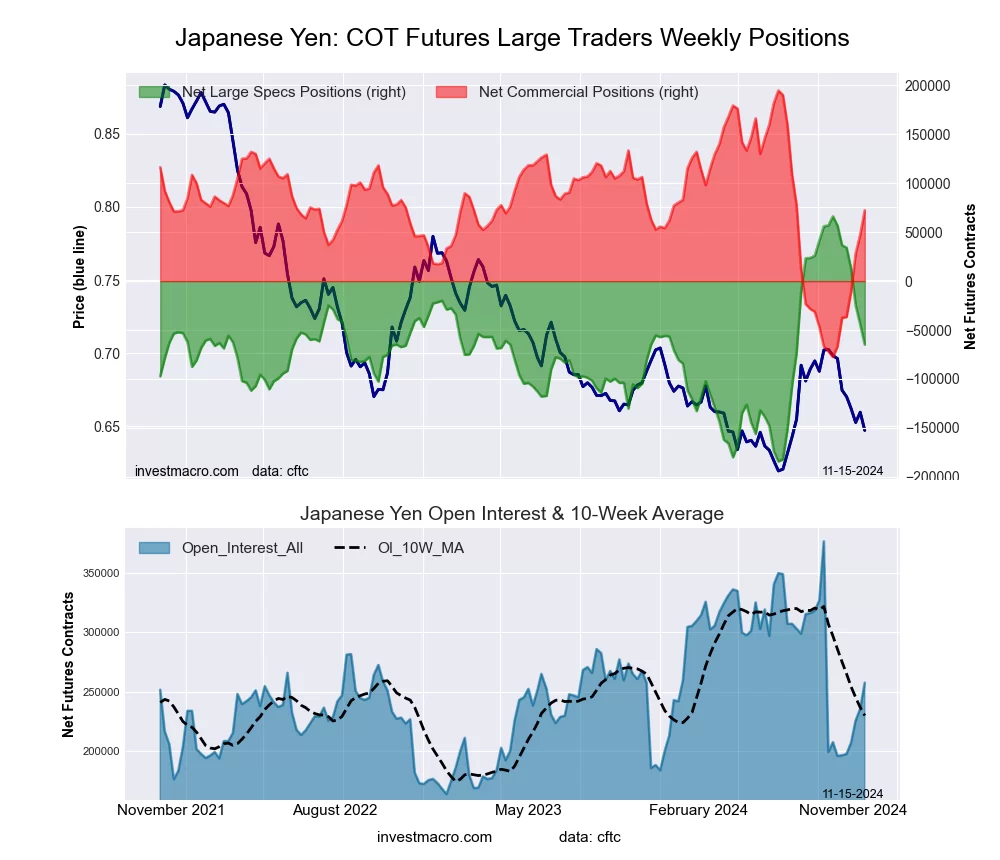 The Japanese Yen large speculator standing this week totaled a net position of -64,902 contracts in the data reported through Tuesday. This was a weekly decline of -20,735 contracts from the previous week which had a total of -44,167 net contracts.
This week’s current strength score (the trader positioning range over the past three years, measured from 0 to 100) shows the speculators are currently Bearish with a score of 47.7 percent. The commercials are Bullish with a score of 55.0 percent and the small traders (not shown in chart) are Bearish with a score of 46.1 percent.
Price Trend-Following Model: Weak Uptrend
Our weekly trend-following model classifies the current market price position as: Weak Uptrend.
| JAPANESE YEN Statistics | SPECULATORS | COMMERCIALS | SMALL TRADERS |
| – Percent of Open Interest Longs: | 24.9 | 59.7 | 13.9 |
| – Percent of Open Interest Shorts: | 50.0 | 31.7 | 16.8 |
| – Net Position: | -64,902 | 72,173 | -7,271 |
| – Gross Longs: | 64,038 | 153,738 | 35,915 |
| – Gross Shorts: | 128,940 | 81,565 | 43,186 |
| – Long to Short Ratio: | 0.5 to 1 | 1.9 to 1 | 0.8 to 1 |
| NET POSITION TREND: | | | |
| – Strength Index Score (3 Year Range Pct): | 47.7 | 55.0 | 46.1 |
| – Strength Index Reading (3 Year Range): | Bearish | Bullish | Bearish |
| NET POSITION MOVEMENT INDEX: | | | |
| – 6-Week Change in Strength Index: | -48.6 | 51.1 | -41.8 |
Swiss Franc Futures:
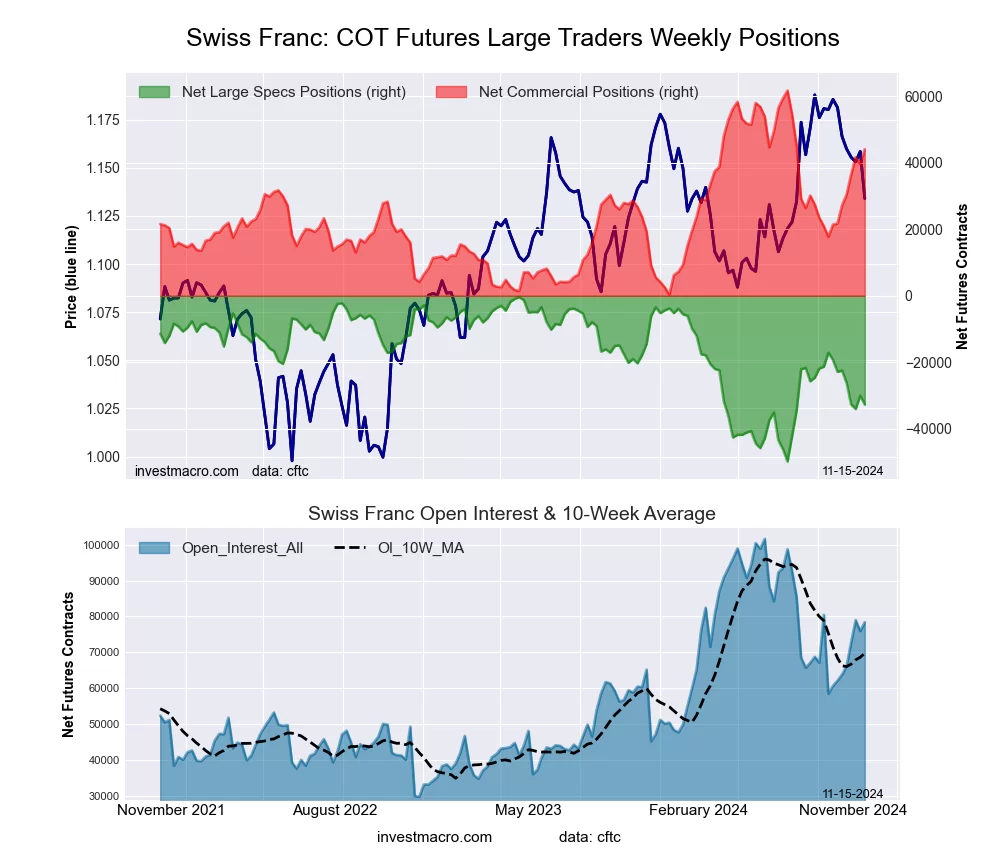 The Swiss Franc large speculator standing this week totaled a net position of -32,694 contracts in the data reported through Tuesday. This was a weekly reduction of -2,713 contracts from the previous week which had a total of -29,981 net contracts.
This week’s current strength score (the trader positioning range over the past three years, measured from 0 to 100) shows the speculators are currently Bearish with a score of 34.6 percent. The commercials are Bullish with a score of 71.2 percent and the small traders (not shown in chart) are Bearish with a score of 24.9 percent.
Price Trend-Following Model: Weak Uptrend
Our weekly trend-following model classifies the current market price position as: Weak Uptrend.
| SWISS FRANC Statistics | SPECULATORS | COMMERCIALS | SMALL TRADERS |
| – Percent of Open Interest Longs: | 6.8 | 80.2 | 12.6 |
| – Percent of Open Interest Shorts: | 48.6 | 24.0 | 27.0 |
| – Net Position: | -32,694 | 44,011 | -11,317 |
| – Gross Longs: | 5,365 | 62,851 | 9,858 |
| – Gross Shorts: | 38,059 | 18,840 | 21,175 |
| – Long to Short Ratio: | 0.1 to 1 | 3.3 to 1 | 0.5 to 1 |
| NET POSITION TREND: | | | |
| – Strength Index Score (3 Year Range Pct): | 34.6 | 71.2 | 24.9 |
| – Strength Index Reading (3 Year Range): | Bearish | Bullish | Bearish |
| NET POSITION MOVEMENT INDEX: | | | |
| – 6-Week Change in Strength Index: | -19.9 | 36.3 | -57.3 |
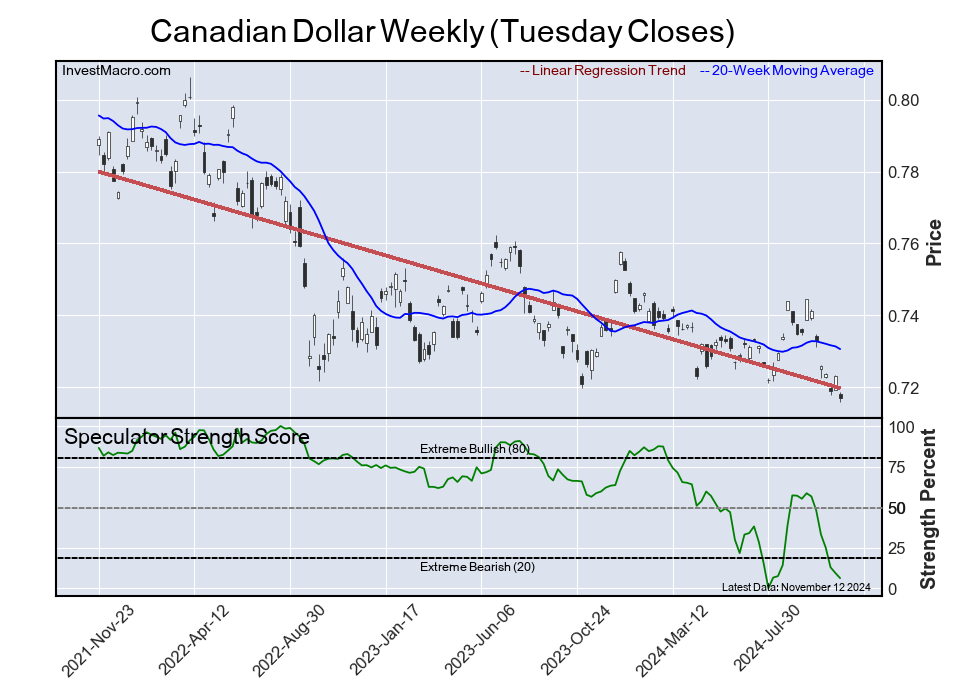
Canadian Dollar Futures:
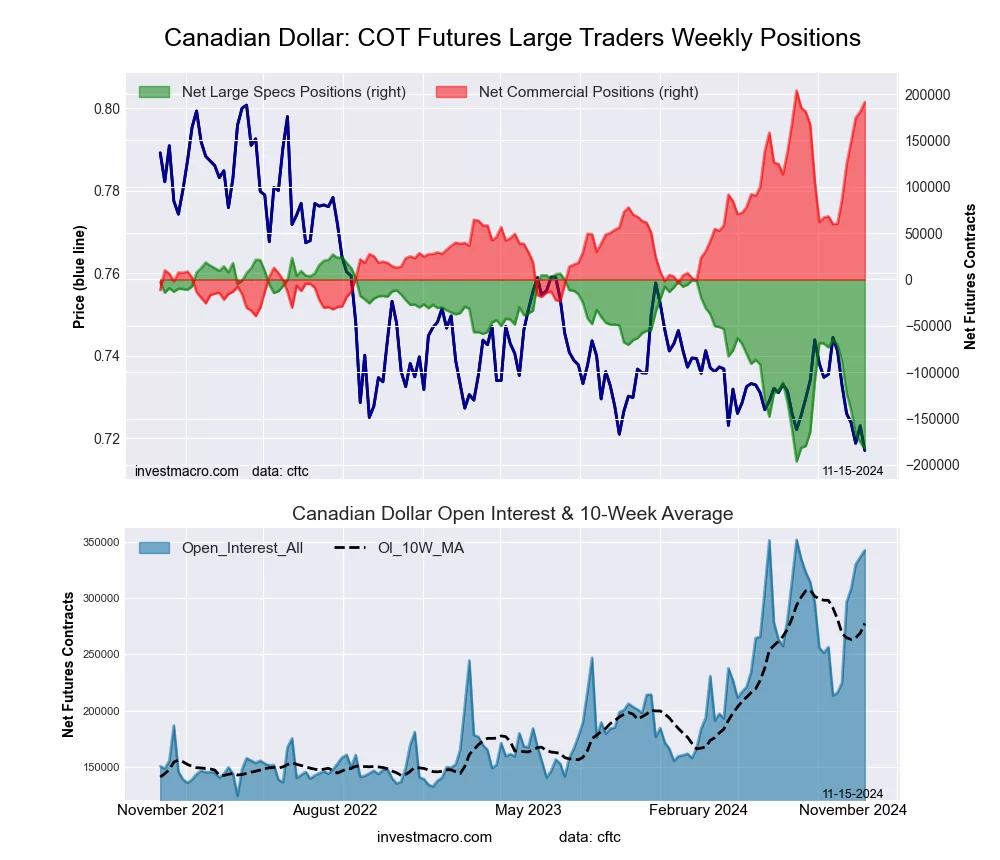 The Canadian Dollar large speculator standing this week totaled a net position of -182,389 contracts in the data reported through Tuesday. This was a weekly decrease of -7,160 contracts from the previous week which had a total of -175,229 net contracts.
This week’s current strength score (the trader positioning range over the past three years, measured from 0 to 100) shows the speculators are currently Bearish-Extreme with a score of 6.2 percent. The commercials are Bullish-Extreme with a score of 94.9 percent and the small traders (not shown in chart) are Bearish-Extreme with a score of 4.4 percent.
Price Trend-Following Model: Strong Downtrend
Our weekly trend-following model classifies the current market price position as: Strong Downtrend.
| CANADIAN DOLLAR Statistics | SPECULATORS | COMMERCIALS | SMALL TRADERS |
| – Percent of Open Interest Longs: | 6.4 | 82.7 | 8.4 |
| – Percent of Open Interest Shorts: | 59.7 | 26.8 | 11.0 |
| – Net Position: | -182,389 | 191,332 | -8,943 |
| – Gross Longs: | 22,011 | 283,278 | 28,728 |
| – Gross Shorts: | 204,400 | 91,946 | 37,671 |
| – Long to Short Ratio: | 0.1 to 1 | 3.1 to 1 | 0.8 to 1 |
| NET POSITION TREND: | | | |
| – Strength Index Score (3 Year Range Pct): | 6.2 | 94.9 | 4.4 |
| – Strength Index Reading (3 Year Range): | Bearish-Extreme | Bullish-Extreme | Bearish-Extreme |
| NET POSITION MOVEMENT INDEX: | | | |
| – 6-Week Change in Strength Index: | -50.4 | 53.9 | -55.3 |
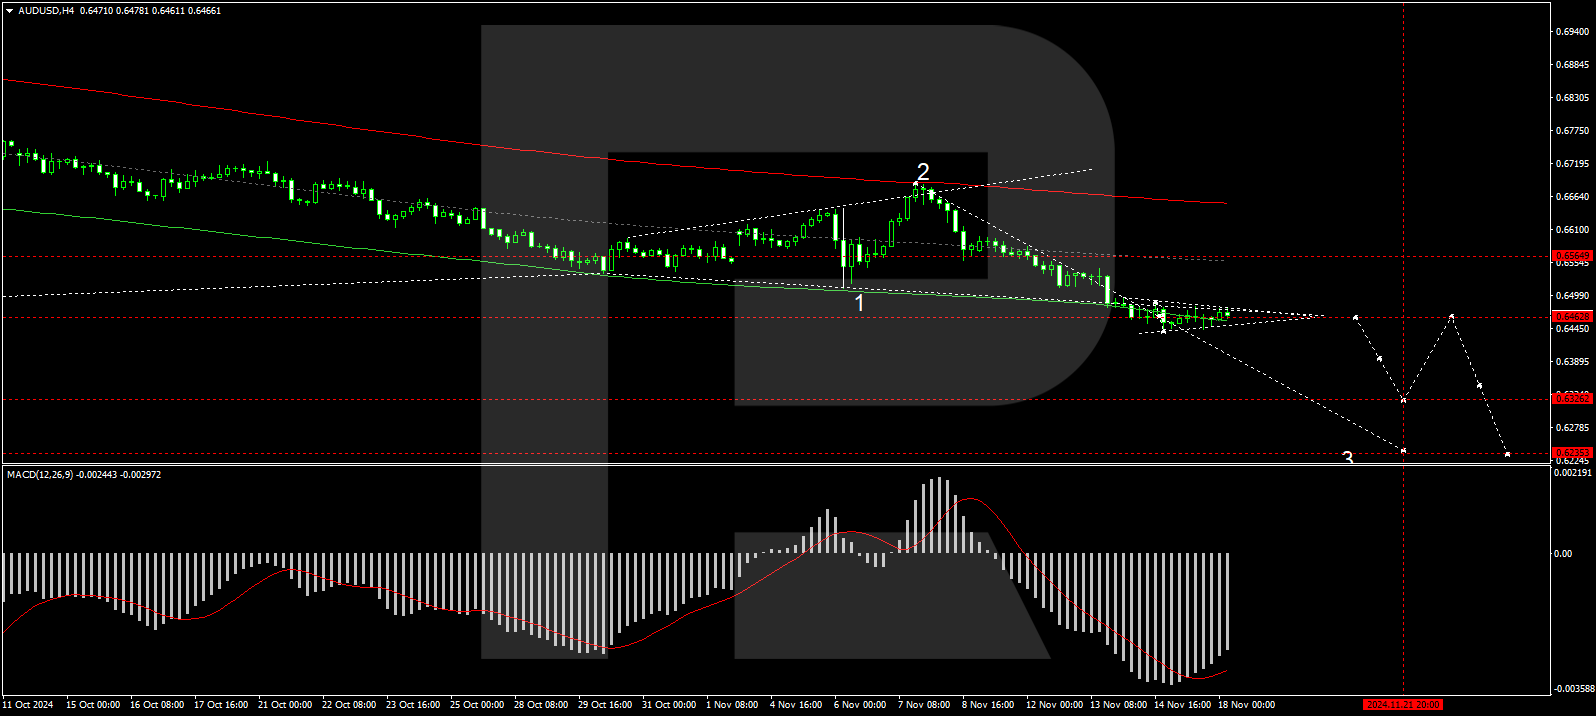
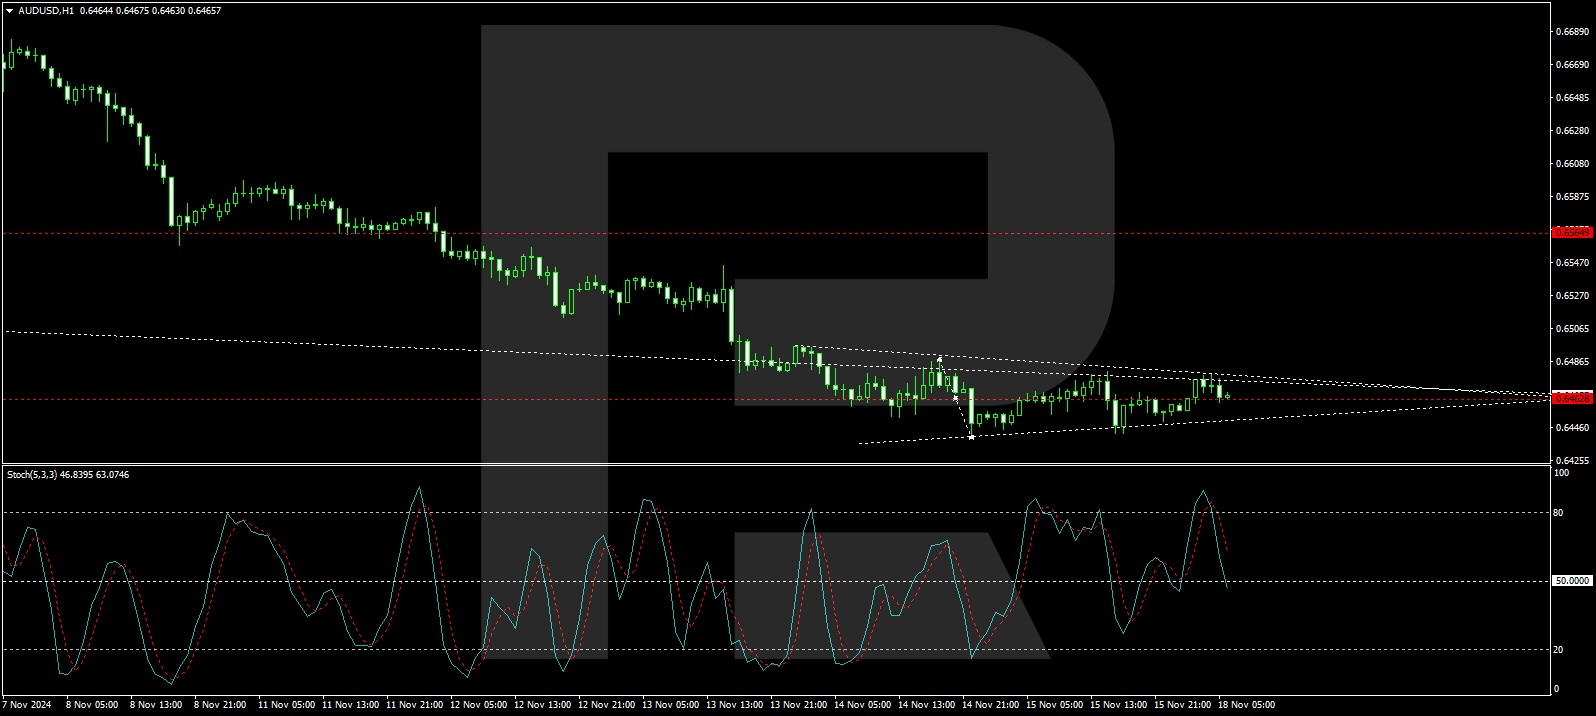
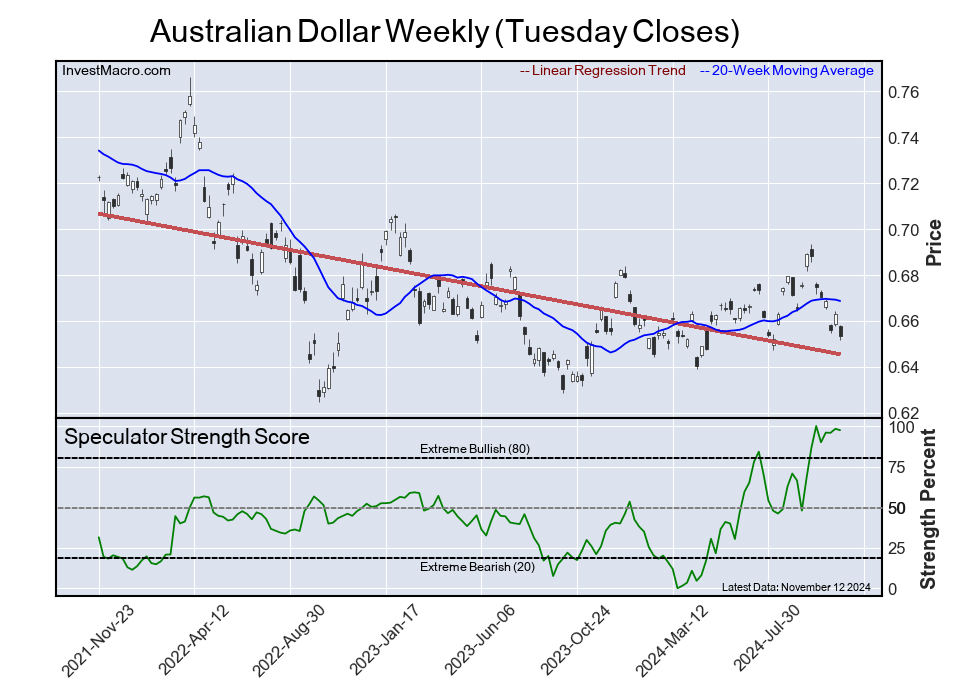
Australian Dollar Futures:
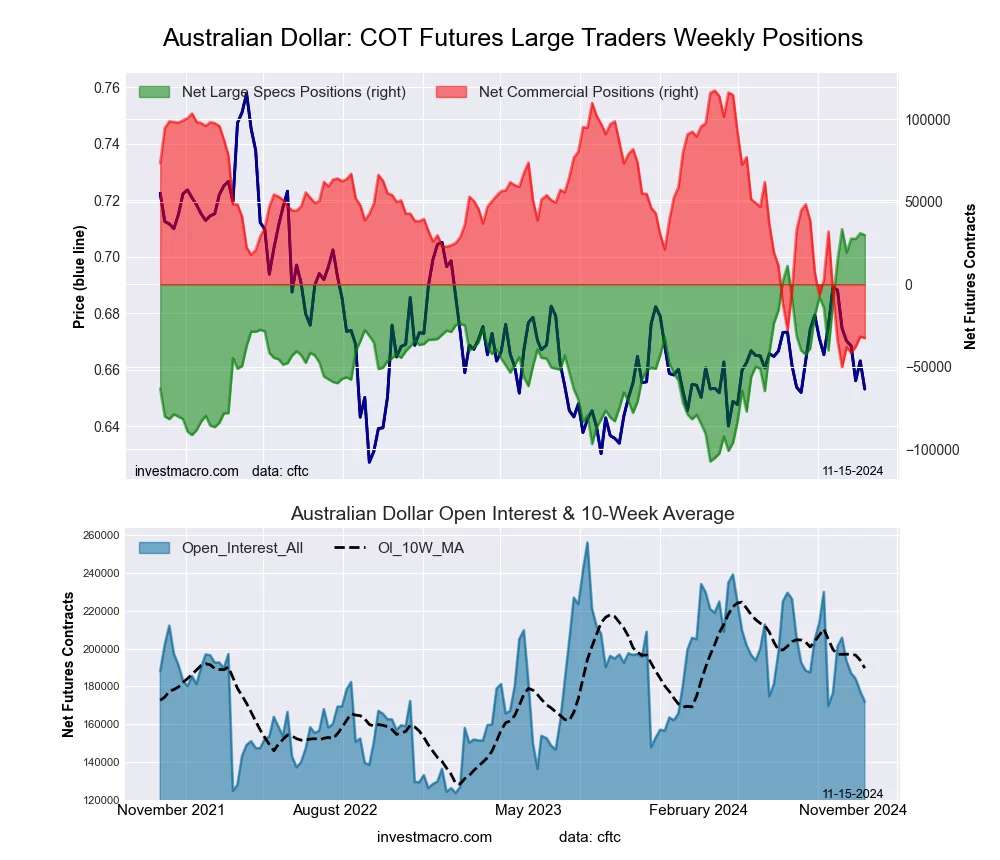 The Australian Dollar large speculator standing this week totaled a net position of 29,795 contracts in the data reported through Tuesday. This was a weekly decrease of -1,181 contracts from the previous week which had a total of 30,976 net contracts.
This week’s current strength score (the trader positioning range over the past three years, measured from 0 to 100) shows the speculators are currently Bullish-Extreme with a score of 97.4 percent. The commercials are Bearish-Extreme with a score of 10.5 percent and the small traders (not shown in chart) are Bullish with a score of 57.6 percent.
Price Trend-Following Model: Strong Downtrend
Our weekly trend-following model classifies the current market price position as: Strong Downtrend.
| AUSTRALIAN DOLLAR Statistics | SPECULATORS | COMMERCIALS | SMALL TRADERS |
| – Percent of Open Interest Longs: | 48.6 | 34.6 | 15.4 |
| – Percent of Open Interest Shorts: | 31.3 | 53.6 | 13.8 |
| – Net Position: | 29,795 | -32,634 | 2,839 |
| – Gross Longs: | 83,555 | 59,537 | 26,542 |
| – Gross Shorts: | 53,760 | 92,171 | 23,703 |
| – Long to Short Ratio: | 1.6 to 1 | 0.6 to 1 | 1.1 to 1 |
| NET POSITION TREND: | | | |
| – Strength Index Score (3 Year Range Pct): | 97.4 | 10.5 | 57.6 |
| – Strength Index Reading (3 Year Range): | Bullish-Extreme | Bearish-Extreme | Bullish |
| NET POSITION MOVEMENT INDEX: | | | |
| – 6-Week Change in Strength Index: | 10.8 | 0.7 | -42.4 |
New Zealand Dollar Futures:
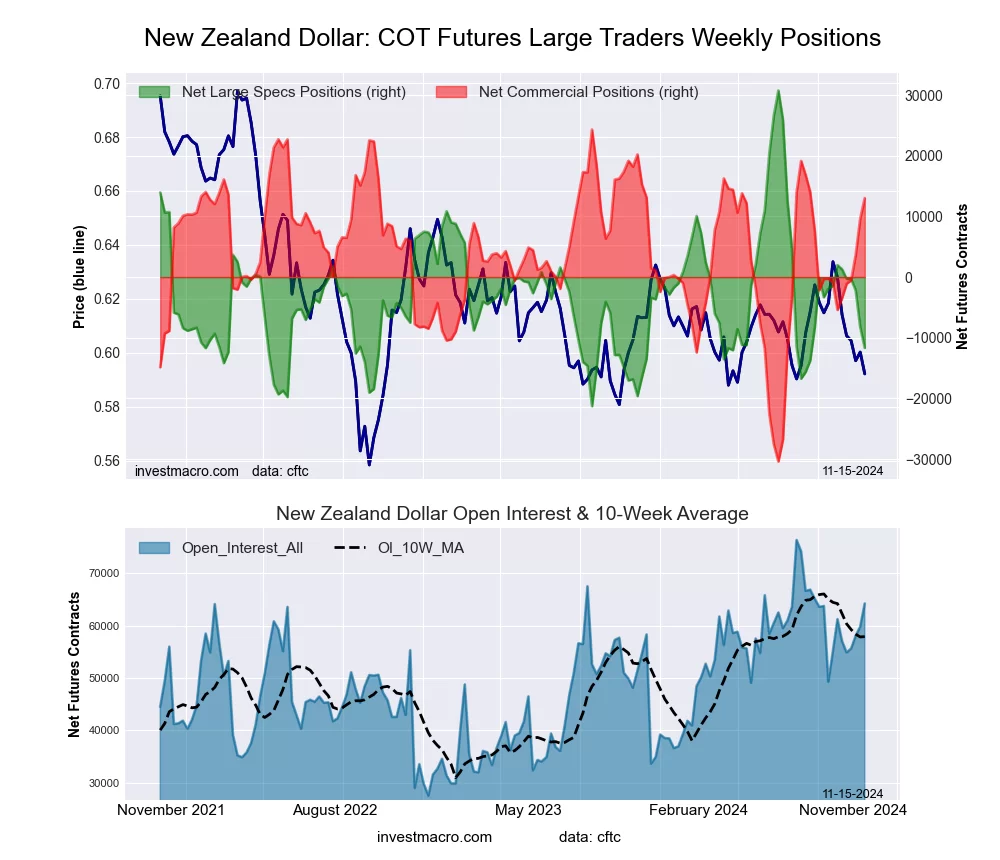 The New Zealand Dollar large speculator standing this week totaled a net position of -11,660 contracts in the data reported through Tuesday. This was a weekly decrease of -3,461 contracts from the previous week which had a total of -8,199 net contracts.
This week’s current strength score (the trader positioning range over the past three years, measured from 0 to 100) shows the speculators are currently Bearish-Extreme with a score of 18.5 percent. The commercials are Bullish with a score of 79.4 percent and the small traders (not shown in chart) are Bearish with a score of 36.2 percent.
Price Trend-Following Model: Strong Downtrend
Our weekly trend-following model classifies the current market price position as: Strong Downtrend.
| NEW ZEALAND DOLLAR Statistics | SPECULATORS | COMMERCIALS | SMALL TRADERS |
| – Percent of Open Interest Longs: | 35.6 | 58.7 | 5.2 |
| – Percent of Open Interest Shorts: | 53.8 | 38.4 | 7.3 |
| – Net Position: | -11,660 | 13,012 | -1,352 |
| – Gross Longs: | 22,871 | 37,696 | 3,317 |
| – Gross Shorts: | 34,531 | 24,684 | 4,669 |
| – Long to Short Ratio: | 0.7 to 1 | 1.5 to 1 | 0.7 to 1 |
| NET POSITION TREND: | | | |
| – Strength Index Score (3 Year Range Pct): | 18.5 | 79.4 | 36.2 |
| – Strength Index Reading (3 Year Range): | Bearish-Extreme | Bullish | Bearish |
| NET POSITION MOVEMENT INDEX: | | | |
| – 6-Week Change in Strength Index: | -26.2 | 33.7 | -61.0 |
Mexican Peso Futures:
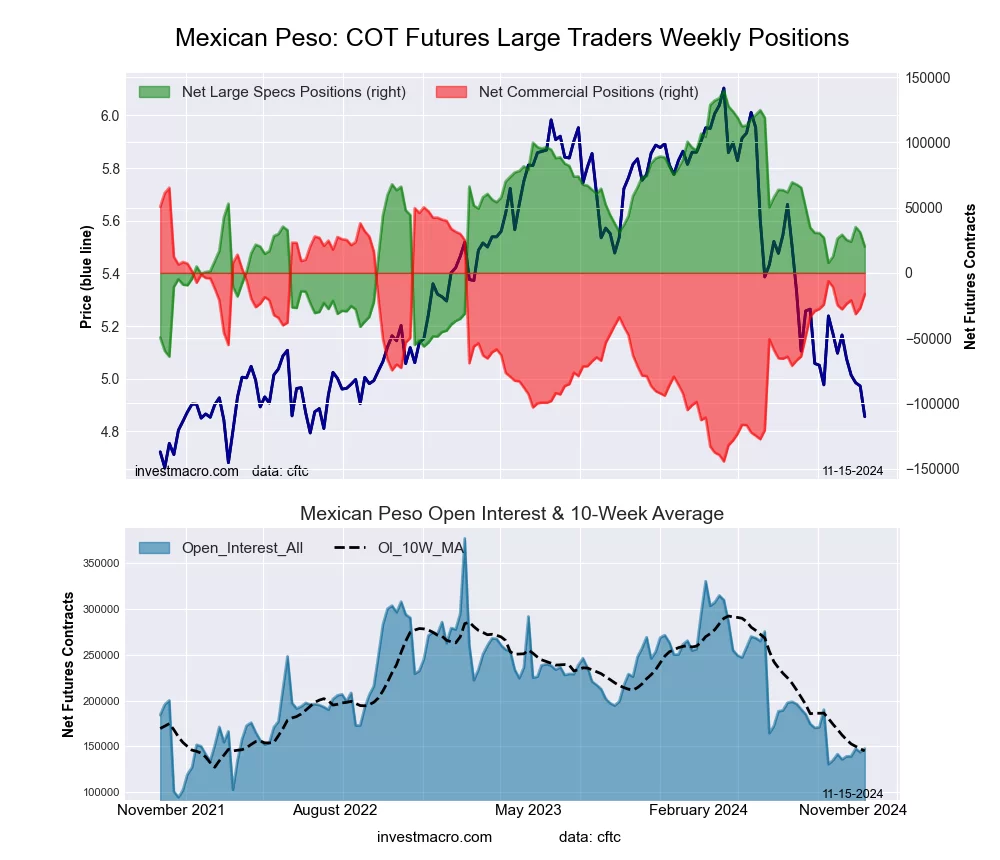 The Mexican Peso large speculator standing this week totaled a net position of 20,193 contracts in the data reported through Tuesday. This was a weekly reduction of -10,902 contracts from the previous week which had a total of 31,095 net contracts.
This week’s current strength score (the trader positioning range over the past three years, measured from 0 to 100) shows the speculators are currently Bearish with a score of 41.4 percent. The commercials are Bullish with a score of 61.1 percent and the small traders (not shown in chart) are Bearish-Extreme with a score of 1.2 percent.
Price Trend-Following Model: Downtrend
Our weekly trend-following model classifies the current market price position as: Downtrend.
| MEXICAN PESO Statistics | SPECULATORS | COMMERCIALS | SMALL TRADERS |
| – Percent of Open Interest Longs: | 49.6 | 45.9 | 1.9 |
| – Percent of Open Interest Shorts: | 35.9 | 57.0 | 4.5 |
| – Net Position: | 20,193 | -16,321 | -3,872 |
| – Gross Longs: | 73,269 | 67,882 | 2,818 |
| – Gross Shorts: | 53,076 | 84,203 | 6,690 |
| – Long to Short Ratio: | 1.4 to 1 | 0.8 to 1 | 0.4 to 1 |
| NET POSITION TREND: | | | |
| – Strength Index Score (3 Year Range Pct): | 41.4 | 61.1 | 1.2 |
| – Strength Index Reading (3 Year Range): | Bearish | Bullish | Bearish-Extreme |
| NET POSITION MOVEMENT INDEX: | | | |
| – 6-Week Change in Strength Index: | -3.0 | 4.0 | -13.0 |
Brazilian Real Futures:
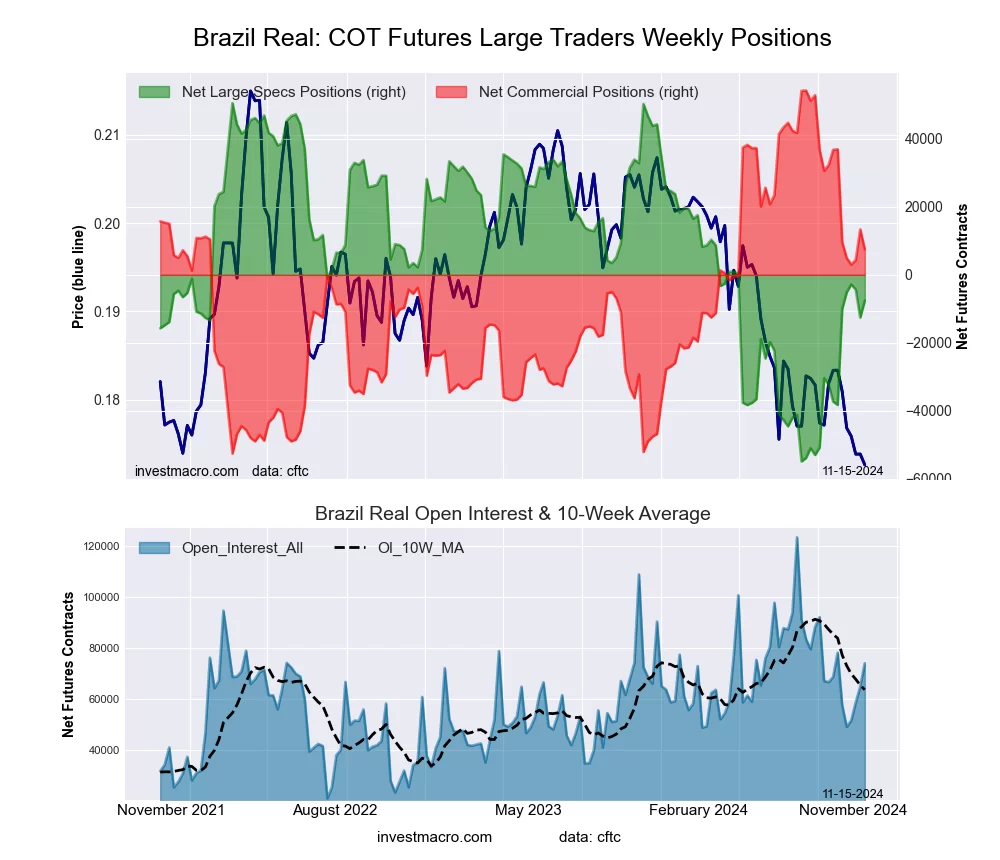 The Brazilian Real large speculator standing this week totaled a net position of -7,577 contracts in the data reported through Tuesday. This was a weekly rise of 4,948 contracts from the previous week which had a total of -12,525 net contracts.
This week’s current strength score (the trader positioning range over the past three years, measured from 0 to 100) shows the speculators are currently Bearish with a score of 44.9 percent. The commercials are Bullish with a score of 56.3 percent and the small traders (not shown in chart) are Bearish with a score of 21.1 percent.
Price Trend-Following Model: Strong Downtrend
Our weekly trend-following model classifies the current market price position as: Strong Downtrend.
| BRAZIL REAL Statistics | SPECULATORS | COMMERCIALS | SMALL TRADERS |
| – Percent of Open Interest Longs: | 53.3 | 33.5 | 3.2 |
| – Percent of Open Interest Shorts: | 63.5 | 23.3 | 3.2 |
| – Net Position: | -7,577 | 7,540 | 37 |
| – Gross Longs: | 39,465 | 24,800 | 2,378 |
| – Gross Shorts: | 47,042 | 17,260 | 2,341 |
| – Long to Short Ratio: | 0.8 to 1 | 1.4 to 1 | 1.0 to 1 |
| NET POSITION TREND: | | | |
| – Strength Index Score (3 Year Range Pct): | 44.9 | 56.3 | 21.1 |
| – Strength Index Reading (3 Year Range): | Bearish | Bullish | Bearish |
| NET POSITION MOVEMENT INDEX: | | | |
| – 6-Week Change in Strength Index: | 29.1 | -27.5 | -7.2 |
Bitcoin Futures:
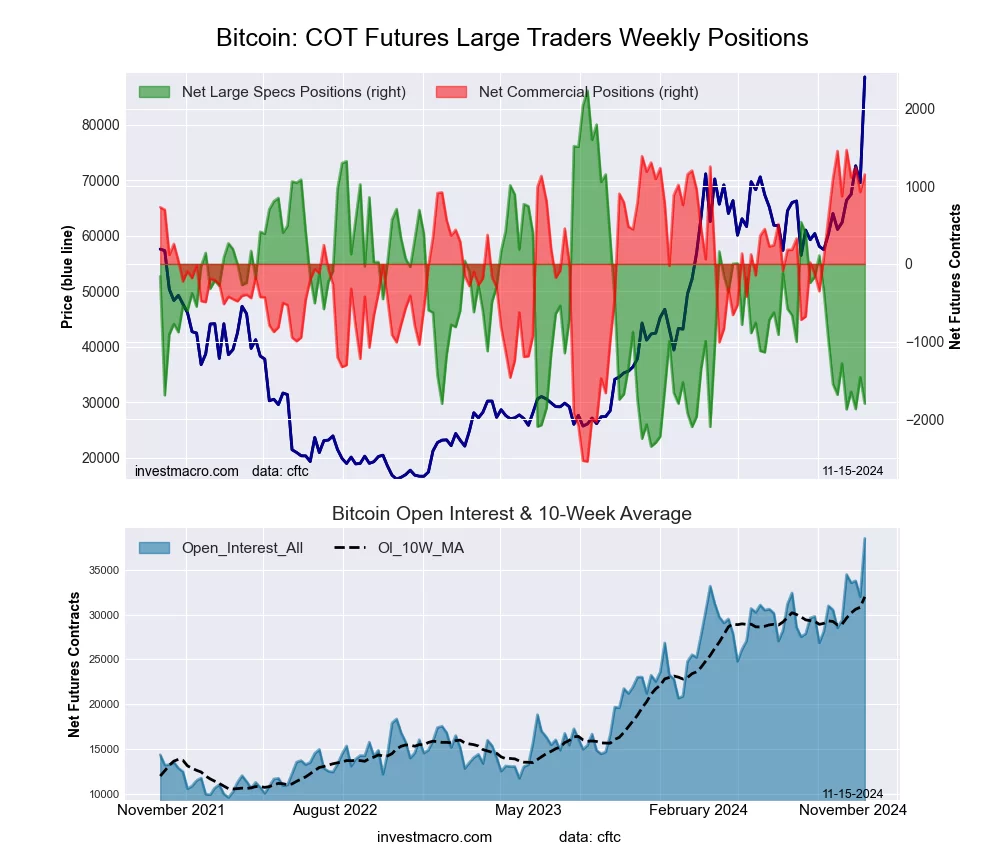 The Bitcoin large speculator standing this week totaled a net position of -1,798 contracts in the data reported through Tuesday. This was a weekly decline of -341 contracts from the previous week which had a total of -1,457 net contracts.
This week’s current strength score (the trader positioning range over the past three years, measured from 0 to 100) shows the speculators are currently Bearish-Extreme with a score of 12.1 percent. The commercials are Bullish-Extreme with a score of 92.1 percent and the small traders (not shown in chart) are Bullish with a score of 68.4 percent.
Price Trend-Following Model: Strong Uptrend
Our weekly trend-following model classifies the current market price position as: Strong Uptrend.
| BITCOIN Statistics | SPECULATORS | COMMERCIALS | SMALL TRADERS |
| – Percent of Open Interest Longs: | 80.2 | 4.7 | 4.2 |
| – Percent of Open Interest Shorts: | 84.8 | 1.7 | 2.5 |
| – Net Position: | -1,798 | 1,151 | 647 |
| – Gross Longs: | 30,887 | 1,792 | 1,604 |
| – Gross Shorts: | 32,685 | 641 | 957 |
| – Long to Short Ratio: | 0.9 to 1 | 2.8 to 1 | 1.7 to 1 |
| NET POSITION TREND: | | | |
| – Strength Index Score (3 Year Range Pct): | 12.1 | 92.1 | 68.4 |
| – Strength Index Reading (3 Year Range): | Bearish-Extreme | Bullish-Extreme | Bullish |
| NET POSITION MOVEMENT INDEX: | | | |
| – 6-Week Change in Strength Index: | -2.5 | -7.5 | 23.4 |
Article By InvestMacro – Receive our weekly COT Newsletter
*COT Report: The COT data, released weekly to the public each Friday, is updated through the most recent Tuesday (data is 3 days old) and shows a quick view of how large speculators or non-commercials (for-profit traders) were positioned in the futures markets.
The CFTC categorizes trader positions according to commercial hedgers (traders who use futures contracts for hedging as part of the business), non-commercials (large traders who speculate to realize trading profits) and nonreportable traders (usually small traders/speculators) as well as their open interest (contracts open in the market at time of reporting). See CFTC criteria here.