
By InvestMacro
Here are the latest charts and statistics for the Commitment of Traders (COT) data published by the Commodities Futures Trading Commission (CFTC).
The latest COT data is updated through Tuesday January 31st and shows a quick view of how large traders (for-profit speculators and commercial entities) were positioned in the futures markets.
*** This data is almost a month old because the CFTC up-to-date data has been delayed due to a cybersecurity event that happened in early February to ION Cleared Derivatives (a subsidiary of ION Markets). This hack of ION has created a problem for the large trader positions to be reported and reconciled. The CFTC states that they will be back-filling the data over the next couple weeks and will get the data back up to date.
Weekly Speculator Changes led by Euro & New Zealand Dollar
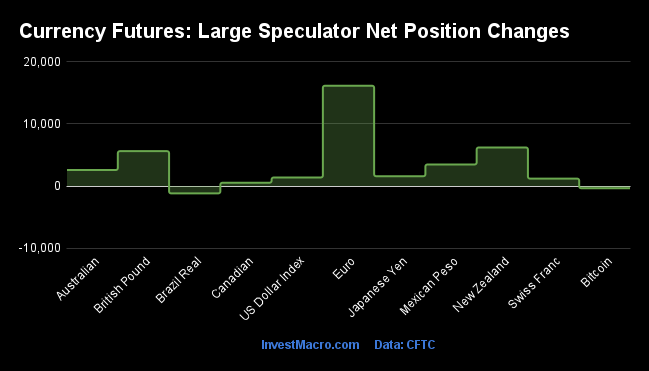
The COT currency market speculator bets were higher through January 31st as nine out of the eleven currency markets we cover had higher positioning while the other two markets had lower speculator contracts.
Leading the gains for the currency markets was the EuroFX (16,160 contracts) with the New Zealand Dollar (6,212 contracts), Canadian Dollar (528 contracts), British Pound (5,617 contracts), Mexican Peso (3,470 contracts), Australian Dollar (2,579 contracts), Swiss Franc (1,194 contracts), US Dollar Index (1,374 contracts) and the Japanese Yen (1,575 contracts) also showing positive weeks.
The currencies seeing declines in speculator bets for that week were the Brazilian Real (-1,188 contracts) and Bitcoin (-362 contracts).
| Jan-31-2023 | OI | OI-Index | Spec-Net | Spec-Index | Com-Net | COM-Index | Smalls-Net | Smalls-Index |
|---|---|---|---|---|---|---|---|---|
| USD Index | 38,140 | 41 | 16,537 | 53 | -19,776 | 44 | 3,239 | 52 |
| EUR | 796,738 | 100 | 150,509 | 81 | -203,589 | 18 | 53,080 | 64 |
| GBP | 196,113 | 35 | -18,317 | 53 | 28,668 | 54 | -10,351 | 38 |
| JPY | 168,540 | 31 | -20,060 | 57 | 18,179 | 45 | 1,881 | 57 |
| CHF | 38,345 | 30 | -8,314 | 33 | 11,816 | 64 | -3,502 | 46 |
| CAD | 140,167 | 24 | -30,184 | 6 | 27,637 | 92 | 2,547 | 35 |
| AUD | 136,304 | 34 | -30,592 | 56 | 23,162 | 36 | 7,430 | 71 |
| NZD | 34,587 | 17 | 8,386 | 77 | -8,813 | 26 | 427 | 57 |
| MXN | 285,481 | 90 | -45,270 | 9 | 40,804 | 89 | 4,466 | 84 |
| RUB | 20,930 | 4 | 7,543 | 31 | -7,150 | 69 | -393 | 24 |
| BRL | 72,096 | 70 | 21,597 | 69 | -22,343 | 32 | 746 | 70 |
| Bitcoin | 17,542 | 94 | -1,799 | 46 | 920 | 0 | 879 | 33 |
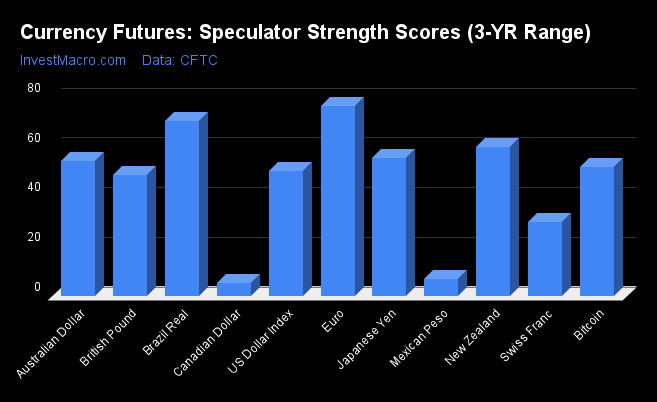
Strength Scores led by EuroFX & New Zealand Dollar
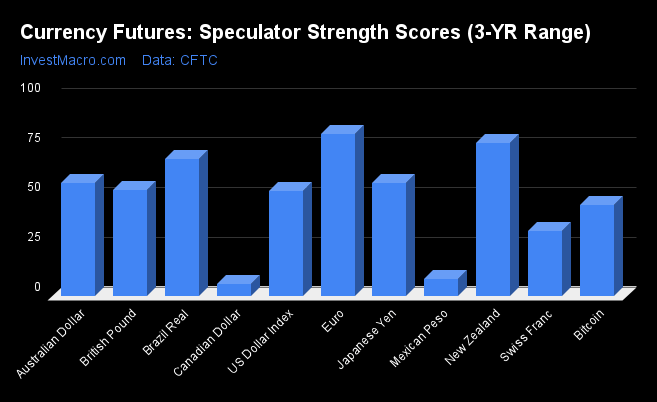
COT Strength Scores (a normalized measure of Speculator positions over a 3-Year range, from 0 to 100 where above 80 is Extreme-Bullish and below 20 is Extreme-Bearish) showed that the EuroFX (81 percent) and the New Zealand Dollar (77 percent) led the currency markets that week. The Brazilian Real (69 percent), Japanese Yen (57 percent) and the Australian Dollar (56 percent) came in as the next highest in the weekly strength scores.
On the downside, the Canadian Dollar (6 percent) and the Mexican Peso (9 percent) come in at the lowest strength levels and were in Extreme-Bearish territory (below 20 percent). The next lowest strength scores were the Swiss Franc (33 percent) and Bitcoin (46 percent).
Strength Statistics:
US Dollar Index (52.5 percent) vs US Dollar Index previous week (50.2 percent)
EuroFX (81.2 percent) vs EuroFX previous week (76.2 percent)
British Pound Sterling (53.3 percent) vs British Pound Sterling previous week (48.5 percent)
Japanese Yen (56.5 percent) vs Japanese Yen previous week (55.6 percent)
Swiss Franc (32.6 percent) vs Swiss Franc previous week (29.5 percent)
Canadian Dollar (5.8 percent) vs Canadian Dollar previous week (5.2 percent)
Australian Dollar (56.5 percent) vs Australian Dollar previous week (54.1 percent)
New Zealand Dollar (76.6 percent) vs New Zealand Dollar previous week (60.0 percent)
Mexican Peso (8.6 percent) vs Mexican Peso previous week (7.0 percent)
Brazilian Real (69.0 percent) vs Brazilian Real previous week (70.3 percent)
Bitcoin (45.6 percent) vs Bitcoin previous week (51.9 percent)
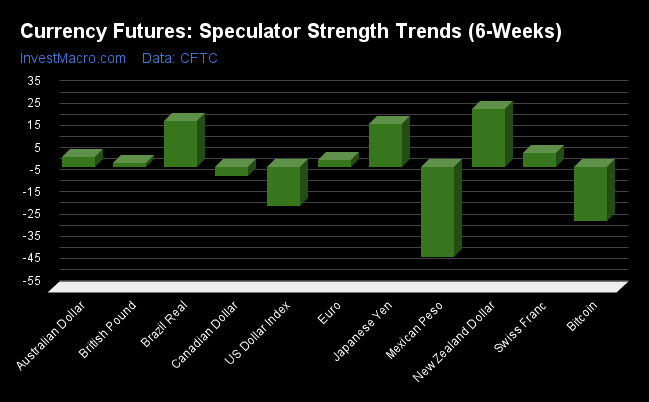
Brazilian Real & Japanese Yen topped the 6-Week Strength Trends
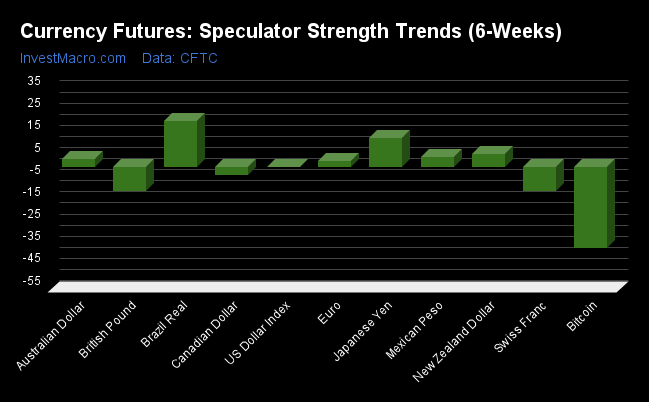
COT Strength Score Trends (or move index, calculates the 6-week changes in strength scores) showed that the Brazilian Real (21 percent) and the Japanese Yen (13 percent) led the six weeks trends for the currencies. The New Zealand Dollar (5 percent), the Mexican Peso (4 percent) and the EuroFX (3 percent) were the next highest positive movers in the latest trends data.
Bitcoin (-37 percent) led the downside trend scores with the Swiss Franc (-11 percent), British Pound (-11 percent) and the Canadian Dollar (-4 percent) following next with lower trend scores.
Strength Trend Statistics:
US Dollar Index (-0.4 percent) vs US Dollar Index previous week (-17.7 percent)
EuroFX (2.5 percent) vs EuroFX previous week (3.0 percent)
British Pound Sterling (-10.9 percent) vs British Pound Sterling previous week (1.5 percent)
Japanese Yen (12.8 percent) vs Japanese Yen previous week (19.4 percent)
Swiss Franc (-11.2 percent) vs Swiss Franc previous week (6.1 percent)
Canadian Dollar (-3.8 percent) vs Canadian Dollar previous week (-4.1 percent)
Australian Dollar (3.3 percent) vs Australian Dollar previous week (4.3 percent)
New Zealand Dollar (5.5 percent) vs New Zealand Dollar previous week (25.9 percent)
Mexican Peso (4.5 percent) vs Mexican Peso previous week (-42.2 percent)
Brazilian Real (20.7 percent) vs Brazilian Real previous week (20.7 percent)
Bitcoin (-36.9 percent) vs Bitcoin previous week (-24.4 percent)
Individual COT Forex Markets:
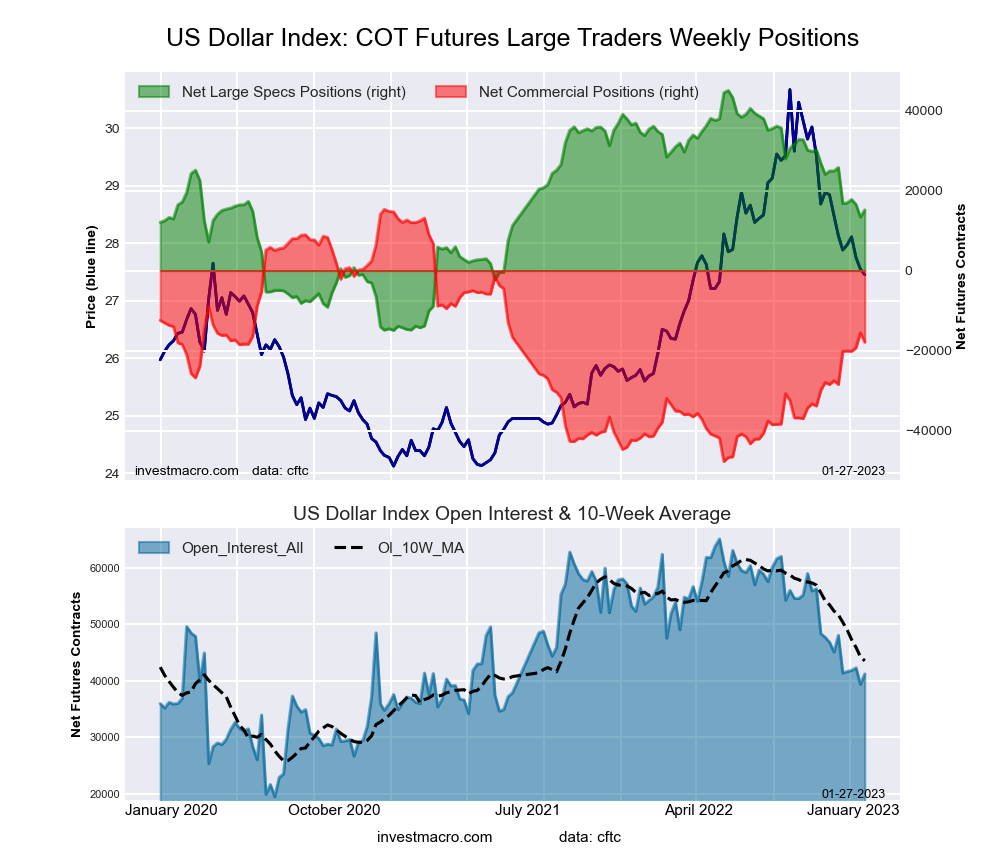
US Dollar Index Futures:
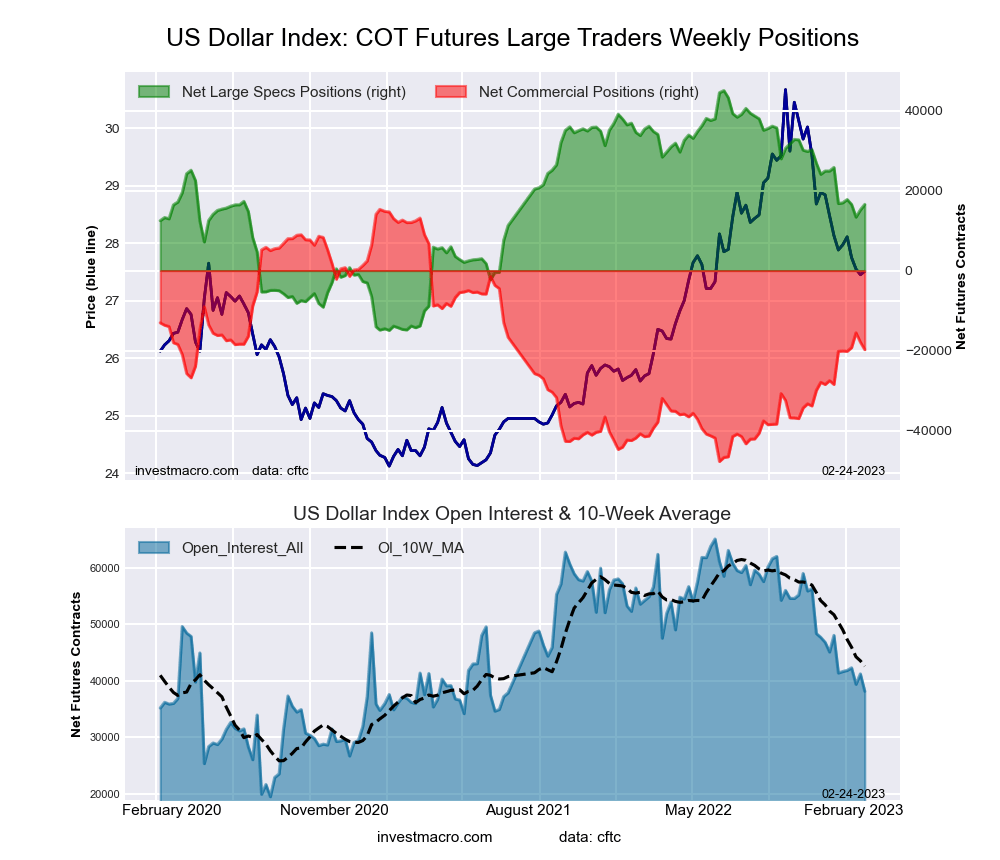 The US Dollar Index large speculator standing for the week equaled a net position of 16,537 contracts in the data reported through Tuesday January 31st. This was a weekly gain of 1,374 contracts from the previous week which had a total of 15,163 net contracts.
This week’s current strength score (the trader positioning range over the past three years, measured from 0 to 100) shows the speculators are currently Bullish with a score of 52.5 percent. The commercials are Bearish with a score of 44.4 percent and the small traders (not shown in chart) are Bullish with a score of 52.0 percent.
| US DOLLAR INDEX Statistics | SPECULATORS | COMMERCIALS | SMALL TRADERS |
| – Percent of Open Interest Longs: | 76.6 | 2.7 | 16.5 |
| – Percent of Open Interest Shorts: | 33.3 | 54.6 | 8.0 |
| – Net Position: | 16,537 | -19,776 | 3,239 |
| – Gross Longs: | 29,221 | 1,042 | 6,309 |
| – Gross Shorts: | 12,684 | 20,818 | 3,070 |
| – Long to Short Ratio: | 2.3 to 1 | 0.1 to 1 | 2.1 to 1 |
| NET POSITION TREND: | |||
| – Strength Index Score (3 Year Range Pct): | 52.5 | 44.4 | 52.0 |
| – Strength Index Reading (3 Year Range): | Bullish | Bearish | Bullish |
| NET POSITION MOVEMENT INDEX: | |||
| – 6-Week Change in Strength Index: | -0.4 | 0.7 | -2.2 |
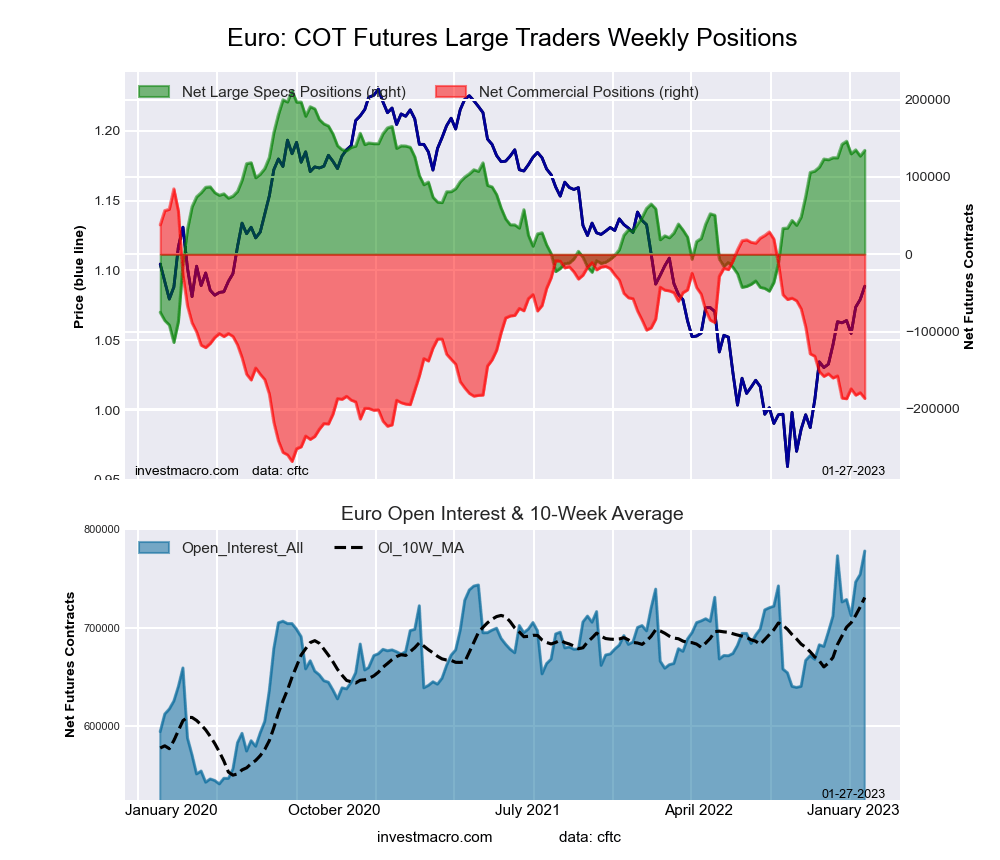
Euro Currency Futures:
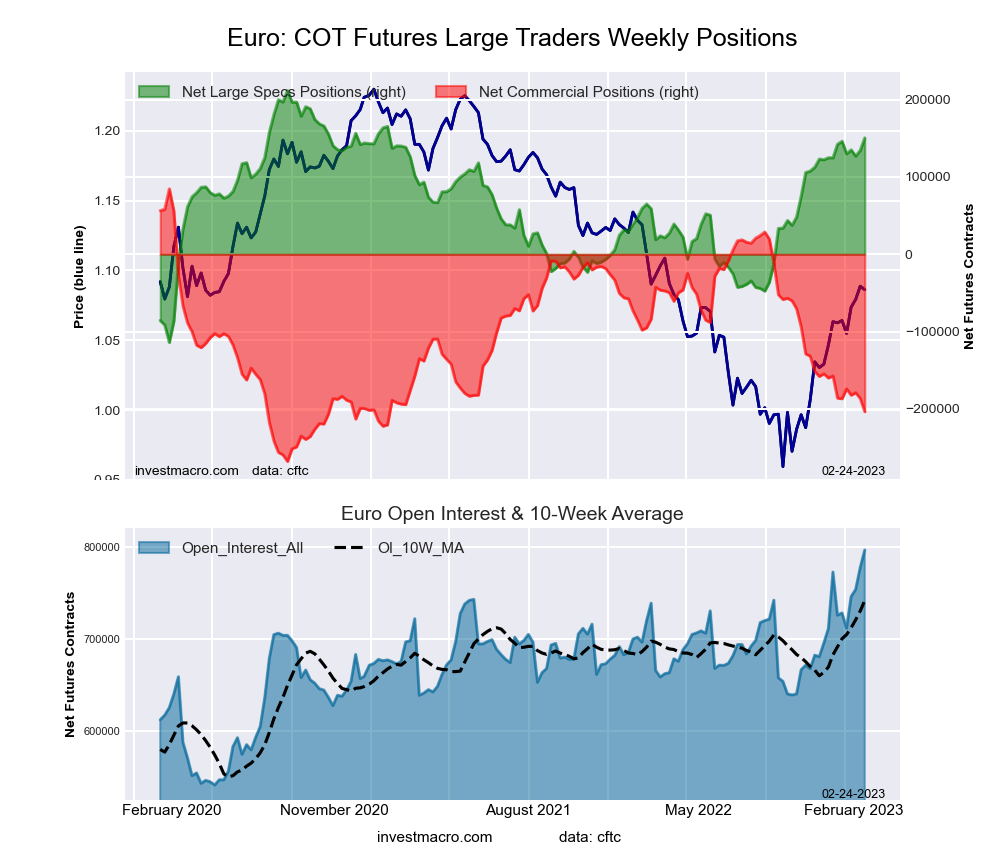 The Euro Currency large speculator standing for the week equaled a net position of 150,509 contracts in the data reported. This was a weekly advance of 16,160 contracts from the previous week which had a total of 134,349 net contracts.
This week’s current strength score (the trader positioning range over the past three years, measured from 0 to 100) shows the speculators are currently Bullish-Extreme with a score of 81.2 percent. The commercials are Bearish-Extreme with a score of 18.3 percent and the small traders (not shown in chart) are Bullish with a score of 63.7 percent.
| EURO Currency Statistics | SPECULATORS | COMMERCIALS | SMALL TRADERS |
| – Percent of Open Interest Longs: | 31.0 | 55.3 | 12.0 |
| – Percent of Open Interest Shorts: | 12.1 | 80.9 | 5.3 |
| – Net Position: | 150,509 | -203,589 | 53,080 |
| – Gross Longs: | 246,755 | 440,756 | 95,671 |
| – Gross Shorts: | 96,246 | 644,345 | 42,591 |
| – Long to Short Ratio: | 2.6 to 1 | 0.7 to 1 | 2.2 to 1 |
| NET POSITION TREND: | |||
| – Strength Index Score (3 Year Range Pct): | 81.2 | 18.3 | 63.7 |
| – Strength Index Reading (3 Year Range): | Bullish-Extreme | Bearish-Extreme | Bullish |
| NET POSITION MOVEMENT INDEX: | |||
| – 6-Week Change in Strength Index: | 2.5 | -5.0 | 14.9 |
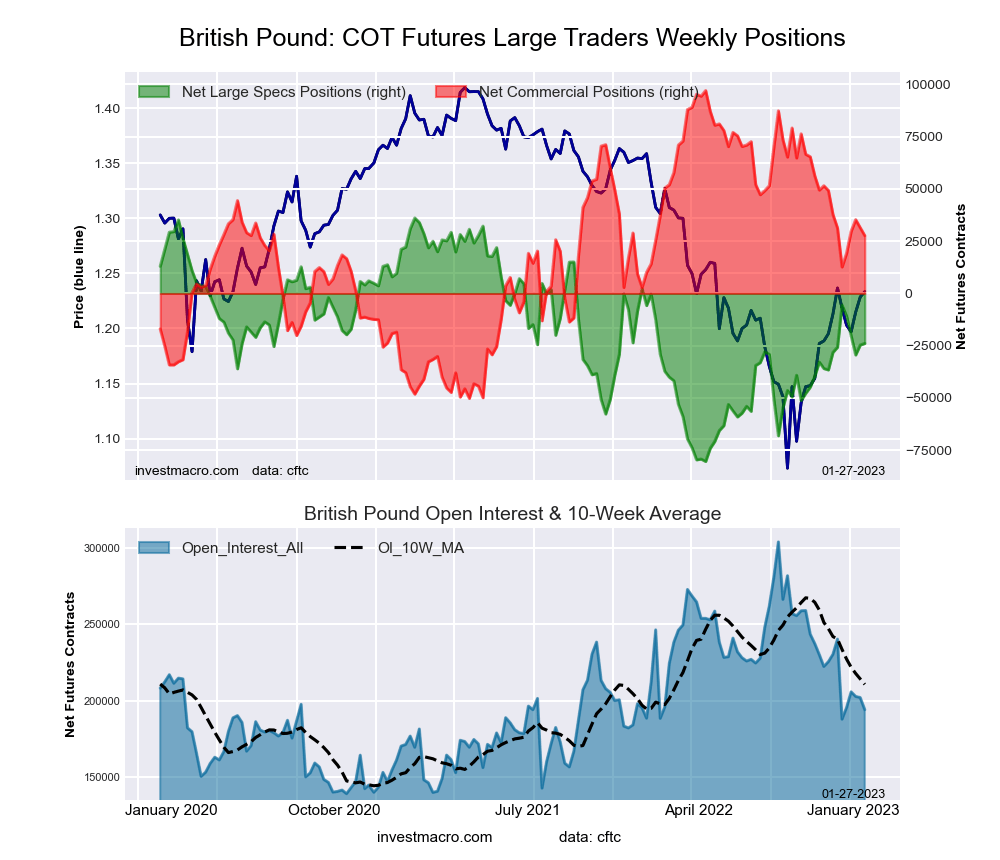
British Pound Sterling Futures:
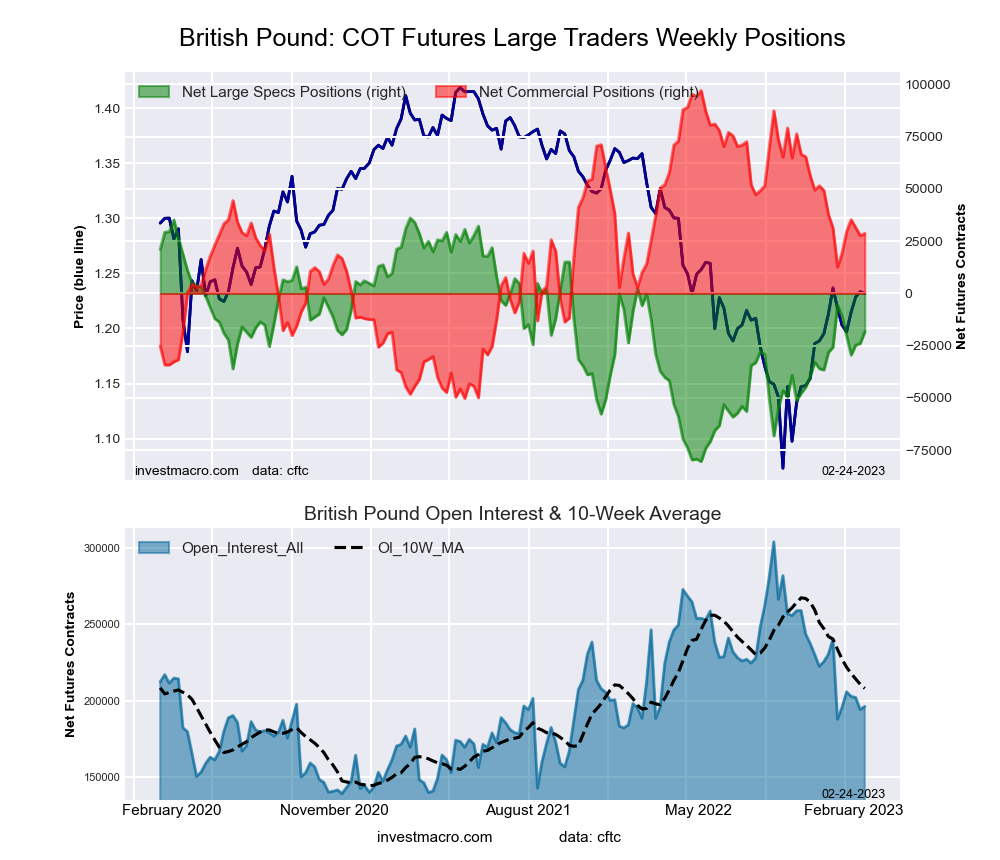 The British Pound Sterling large speculator standing for the week equaled a net position of -18,317 contracts in the data reported. This was a weekly lift of 5,617 contracts from the previous week which had a total of -23,934 net contracts.
This week’s current strength score (the trader positioning range over the past three years, measured from 0 to 100) shows the speculators are currently Bullish with a score of 53.3 percent. The commercials are Bullish with a score of 53.6 percent and the small traders (not shown in chart) are Bearish with a score of 37.7 percent.
| BRITISH POUND Statistics | SPECULATORS | COMMERCIALS | SMALL TRADERS |
| – Percent of Open Interest Longs: | 18.5 | 66.5 | 12.5 |
| – Percent of Open Interest Shorts: | 27.8 | 51.9 | 17.7 |
| – Net Position: | -18,317 | 28,668 | -10,351 |
| – Gross Longs: | 36,234 | 130,370 | 24,459 |
| – Gross Shorts: | 54,551 | 101,702 | 34,810 |
| – Long to Short Ratio: | 0.7 to 1 | 1.3 to 1 | 0.7 to 1 |
| NET POSITION TREND: | |||
| – Strength Index Score (3 Year Range Pct): | 53.3 | 53.6 | 37.7 |
| – Strength Index Reading (3 Year Range): | Bullish | Bullish | Bearish |
| NET POSITION MOVEMENT INDEX: | |||
| – 6-Week Change in Strength Index: | -10.9 | 10.9 | -6.5 |
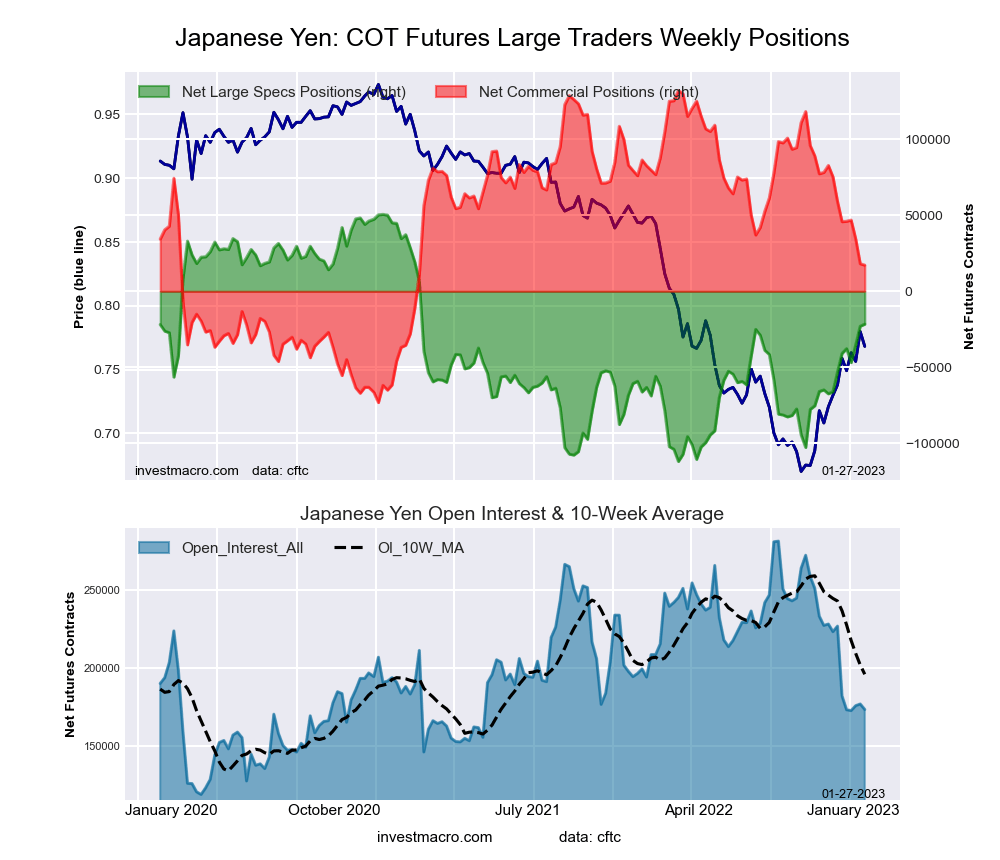
Japanese Yen Futures:
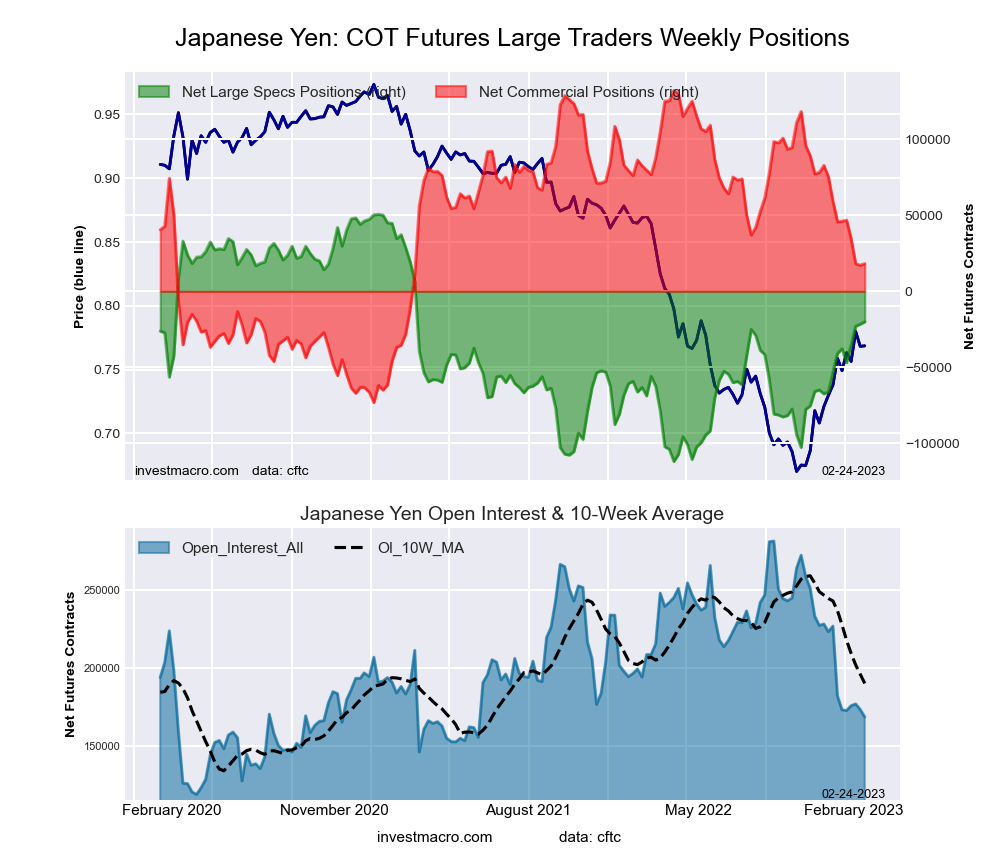 The Japanese Yen large speculator standing for the week equaled a net position of -20,060 contracts in the data reported. This was a weekly rise of 1,575 contracts from the previous week which had a total of -21,635 net contracts.
This week’s current strength score (the trader positioning range over the past three years, measured from 0 to 100) shows the speculators are currently Bullish with a score of 56.5 percent. The commercials are Bearish with a score of 44.5 percent and the small traders (not shown in chart) are Bullish with a score of 57.3 percent.
| JAPANESE YEN Statistics | SPECULATORS | COMMERCIALS | SMALL TRADERS |
| – Percent of Open Interest Longs: | 13.4 | 67.9 | 18.5 |
| – Percent of Open Interest Shorts: | 25.3 | 57.1 | 17.3 |
| – Net Position: | -20,060 | 18,179 | 1,881 |
| – Gross Longs: | 22,550 | 114,423 | 31,108 |
| – Gross Shorts: | 42,610 | 96,244 | 29,227 |
| – Long to Short Ratio: | 0.5 to 1 | 1.2 to 1 | 1.1 to 1 |
| NET POSITION TREND: | |||
| – Strength Index Score (3 Year Range Pct): | 56.5 | 44.5 | 57.3 |
| – Strength Index Reading (3 Year Range): | Bullish | Bearish | Bullish |
| NET POSITION MOVEMENT INDEX: | |||
| – 6-Week Change in Strength Index: | 12.8 | -13.4 | 13.7 |
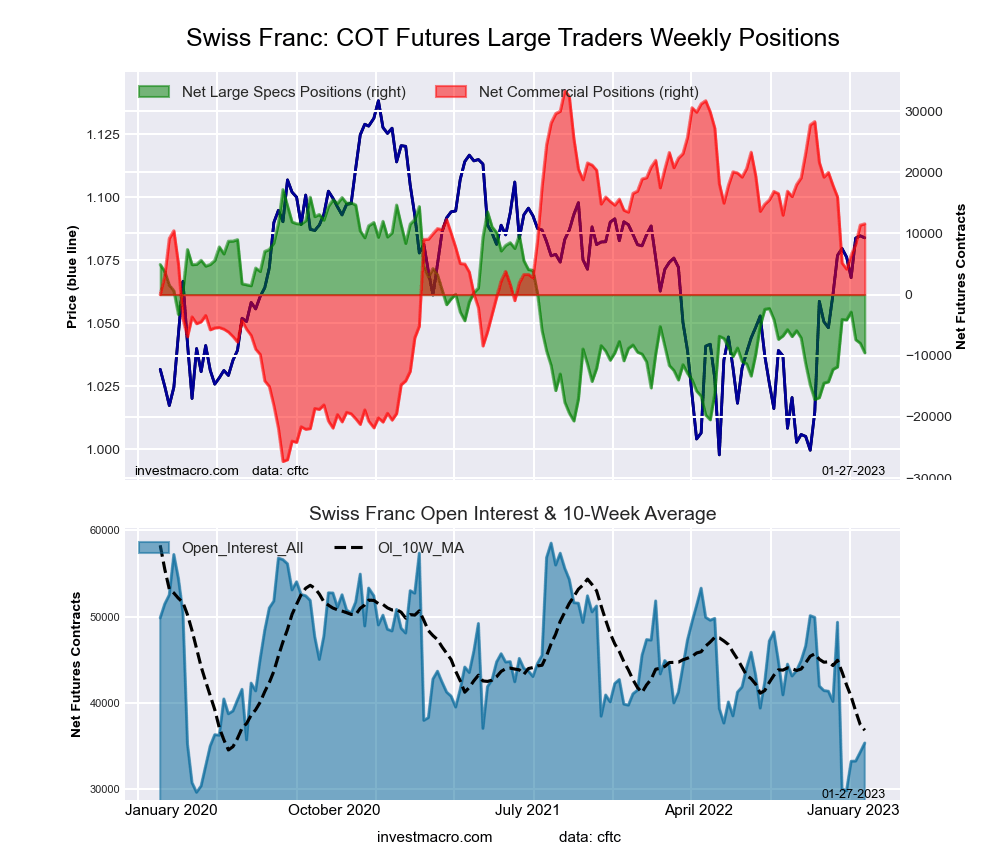
Swiss Franc Futures:
 The Swiss Franc large speculator standing for the week equaled a net position of -8,314 contracts in the data reported. This was a weekly advance of 1,194 contracts from the previous week which had a total of -9,508 net contracts.
This week’s current strength score (the trader positioning range over the past three years, measured from 0 to 100) shows the speculators are currently Bearish with a score of 32.6 percent. The commercials are Bullish with a score of 64.5 percent and the small traders (not shown in chart) are Bearish with a score of 45.7 percent.
| SWISS FRANC Statistics | SPECULATORS | COMMERCIALS | SMALL TRADERS |
| – Percent of Open Interest Longs: | 14.8 | 55.1 | 30.1 |
| – Percent of Open Interest Shorts: | 36.5 | 24.2 | 39.3 |
| – Net Position: | -8,314 | 11,816 | -3,502 |
| – Gross Longs: | 5,664 | 21,109 | 11,549 |
| – Gross Shorts: | 13,978 | 9,293 | 15,051 |
| – Long to Short Ratio: | 0.4 to 1 | 2.3 to 1 | 0.8 to 1 |
| NET POSITION TREND: | |||
| – Strength Index Score (3 Year Range Pct): | 32.6 | 64.5 | 45.7 |
| – Strength Index Reading (3 Year Range): | Bearish | Bullish | Bearish |
| NET POSITION MOVEMENT INDEX: | |||
| – 6-Week Change in Strength Index: | -11.2 | 11.0 | -8.1 |
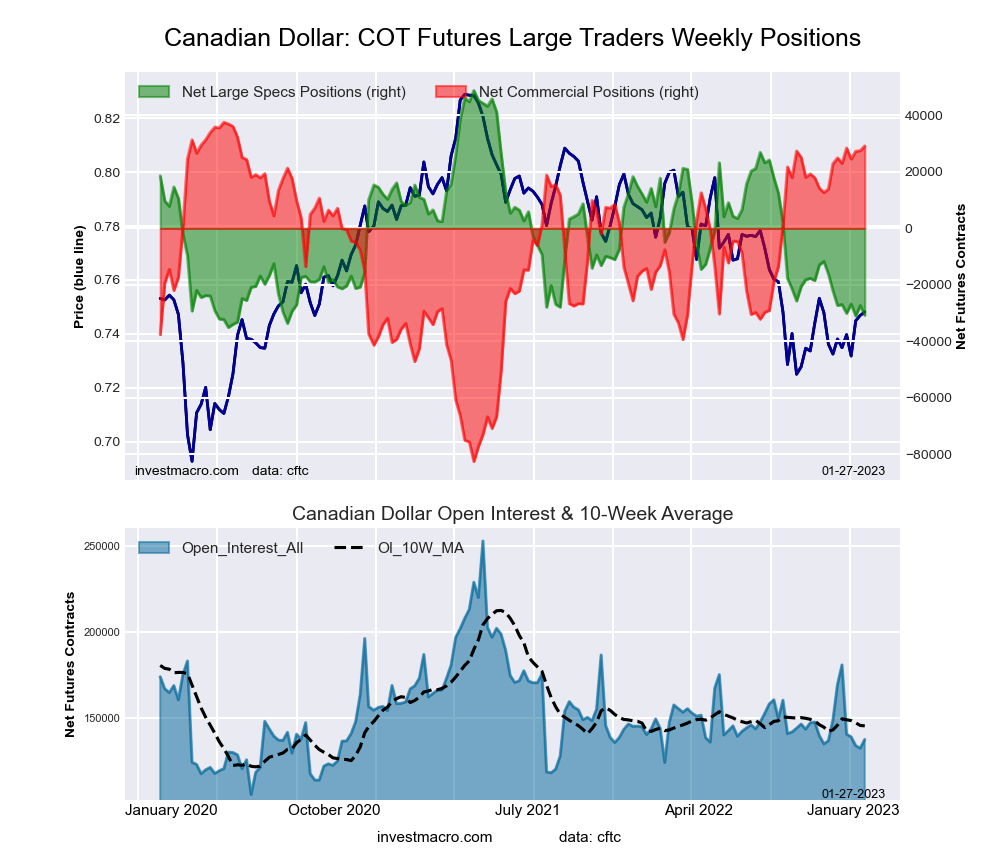
Canadian Dollar Futures:
 The Canadian Dollar large speculator standing for the week equaled a net position of -30,184 contracts in the data reported. This was a weekly rise of 528 contracts from the previous week which had a total of -30,712 net contracts.
This week’s current strength score (the trader positioning range over the past three years, measured from 0 to 100) shows the speculators are currently Bearish-Extreme with a score of 5.8 percent. The commercials are Bullish-Extreme with a score of 91.8 percent and the small traders (not shown in chart) are Bearish with a score of 35.2 percent.
| CANADIAN DOLLAR Statistics | SPECULATORS | COMMERCIALS | SMALL TRADERS |
| – Percent of Open Interest Longs: | 18.8 | 55.1 | 23.8 |
| – Percent of Open Interest Shorts: | 40.4 | 35.4 | 22.0 |
| – Net Position: | -30,184 | 27,637 | 2,547 |
| – Gross Longs: | 26,404 | 77,299 | 33,382 |
| – Gross Shorts: | 56,588 | 49,662 | 30,835 |
| – Long to Short Ratio: | 0.5 to 1 | 1.6 to 1 | 1.1 to 1 |
| NET POSITION TREND: | |||
| – Strength Index Score (3 Year Range Pct): | 5.8 | 91.8 | 35.2 |
| – Strength Index Reading (3 Year Range): | Bearish-Extreme | Bullish-Extreme | Bearish |
| NET POSITION MOVEMENT INDEX: | |||
| – 6-Week Change in Strength Index: | -3.8 | 3.9 | -2.9 |
Australian Dollar Futures:
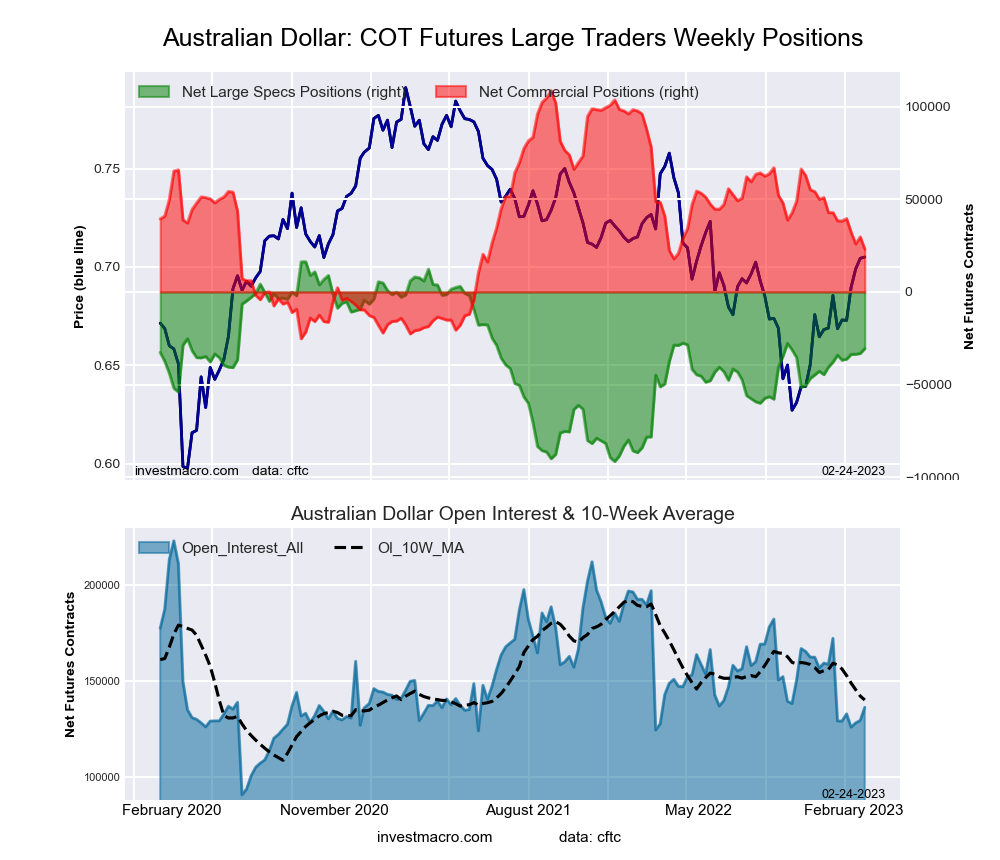 The Australian Dollar large speculator standing for the week equaled a net position of -30,592 contracts in the data reported. This was a weekly gain of 2,579 contracts from the previous week which had a total of -33,171 net contracts.
This week’s current strength score (the trader positioning range over the past three years, measured from 0 to 100) shows the speculators are currently Bullish with a score of 56.5 percent. The commercials are Bearish with a score of 36.1 percent and the small traders (not shown in chart) are Bullish with a score of 70.6 percent.
| AUSTRALIAN DOLLAR Statistics | SPECULATORS | COMMERCIALS | SMALL TRADERS |
| – Percent of Open Interest Longs: | 26.7 | 53.4 | 18.0 |
| – Percent of Open Interest Shorts: | 49.1 | 36.4 | 12.6 |
| – Net Position: | -30,592 | 23,162 | 7,430 |
| – Gross Longs: | 36,337 | 72,741 | 24,573 |
| – Gross Shorts: | 66,929 | 49,579 | 17,143 |
| – Long to Short Ratio: | 0.5 to 1 | 1.5 to 1 | 1.4 to 1 |
| NET POSITION TREND: | |||
| – Strength Index Score (3 Year Range Pct): | 56.5 | 36.1 | 70.6 |
| – Strength Index Reading (3 Year Range): | Bullish | Bearish | Bullish |
| NET POSITION MOVEMENT INDEX: | |||
| – 6-Week Change in Strength Index: | 3.3 | -11.4 | 28.6 |
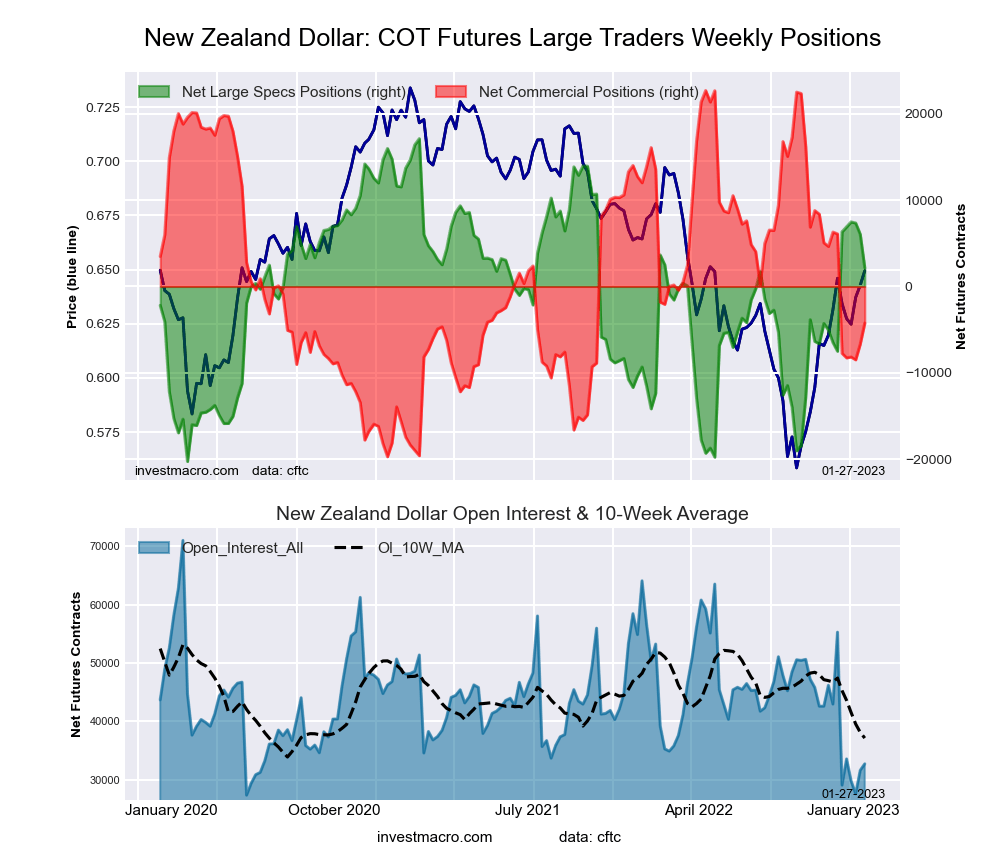
New Zealand Dollar Futures:
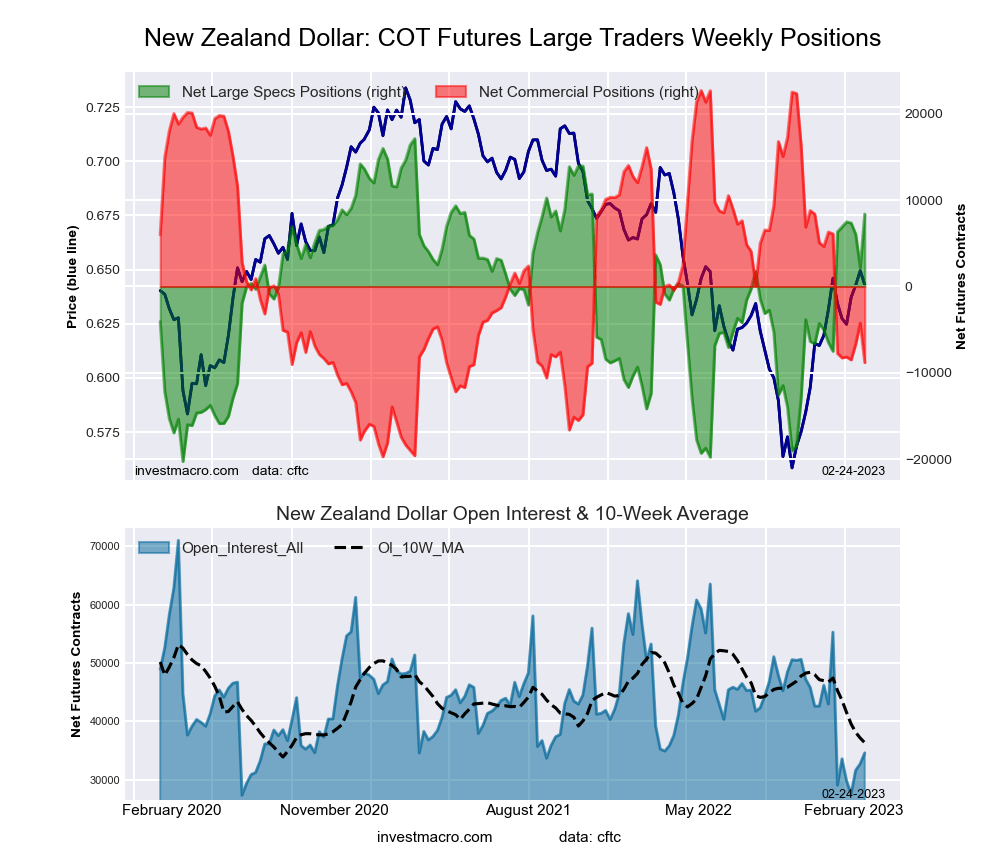 The New Zealand Dollar large speculator standing for the week equaled a net position of 8,386 contracts in the data reported. This was a weekly increase of 6,212 contracts from the previous week which had a total of 2,174 net contracts.
This week’s current strength score (the trader positioning range over the past three years, measured from 0 to 100) shows the speculators are currently Bullish with a score of 76.6 percent. The commercials are Bearish with a score of 25.7 percent and the small traders (not shown in chart) are Bullish with a score of 56.6 percent.
| NEW ZEALAND DOLLAR Statistics | SPECULATORS | COMMERCIALS | SMALL TRADERS |
| – Percent of Open Interest Longs: | 44.5 | 39.8 | 13.5 |
| – Percent of Open Interest Shorts: | 20.2 | 65.3 | 12.3 |
| – Net Position: | 8,386 | -8,813 | 427 |
| – Gross Longs: | 15,376 | 13,762 | 4,674 |
| – Gross Shorts: | 6,990 | 22,575 | 4,247 |
| – Long to Short Ratio: | 2.2 to 1 | 0.6 to 1 | 1.1 to 1 |
| NET POSITION TREND: | |||
| – Strength Index Score (3 Year Range Pct): | 76.6 | 25.7 | 56.6 |
| – Strength Index Reading (3 Year Range): | Bullish | Bearish | Bullish |
| NET POSITION MOVEMENT INDEX: | |||
| – 6-Week Change in Strength Index: | 5.5 | -2.5 | -11.4 |
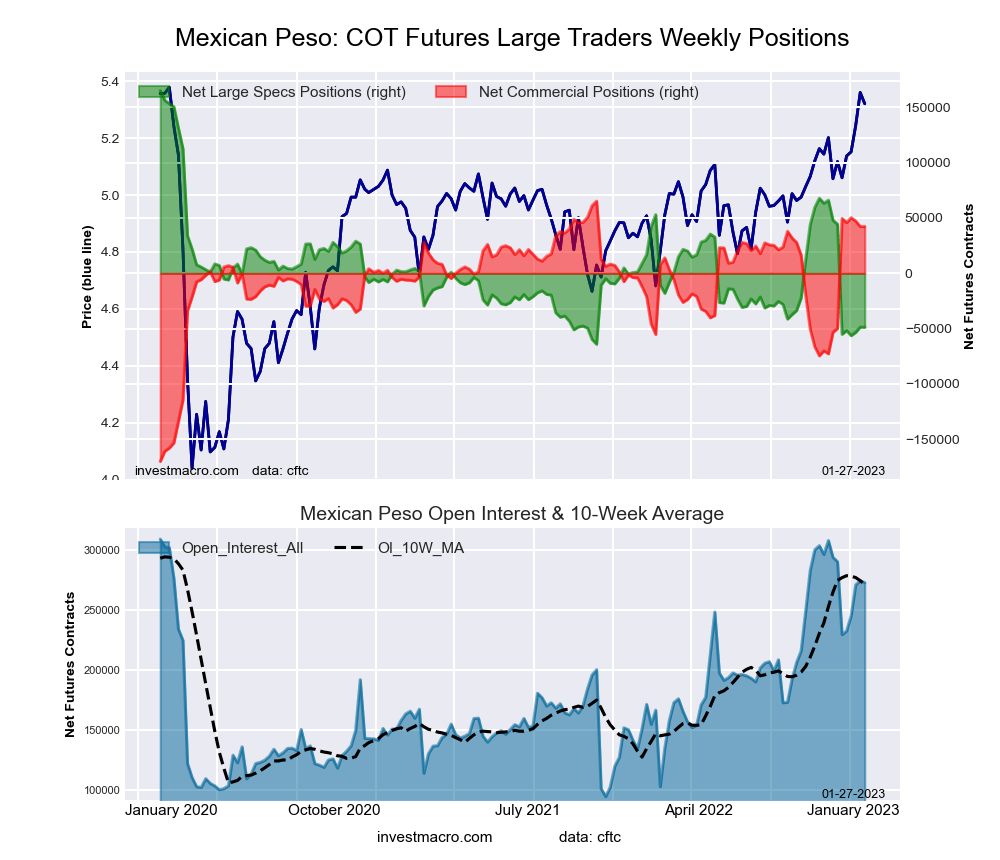
Mexican Peso Futures:
 The Mexican Peso large speculator standing for the week equaled a net position of -45,270 contracts in the data reported. This was a weekly lift of 3,470 contracts from the previous week which had a total of -48,740 net contracts.
This week’s current strength score (the trader positioning range over the past three years, measured from 0 to 100) shows the speculators are currently Bearish-Extreme with a score of 8.6 percent. The commercials are Bullish-Extreme with a score of 89.2 percent and the small traders (not shown in chart) are Bullish-Extreme with a score of 84.1 percent.
| MEXICAN PESO Statistics | SPECULATORS | COMMERCIALS | SMALL TRADERS |
| – Percent of Open Interest Longs: | 55.0 | 41.9 | 2.7 |
| – Percent of Open Interest Shorts: | 70.8 | 27.6 | 1.2 |
| – Net Position: | -45,270 | 40,804 | 4,466 |
| – Gross Longs: | 156,950 | 119,480 | 7,841 |
| – Gross Shorts: | 202,220 | 78,676 | 3,375 |
| – Long to Short Ratio: | 0.8 to 1 | 1.5 to 1 | 2.3 to 1 |
| NET POSITION TREND: | |||
| – Strength Index Score (3 Year Range Pct): | 8.6 | 89.2 | 84.1 |
| – Strength Index Reading (3 Year Range): | Bearish-Extreme | Bullish-Extreme | Bullish-Extreme |
| NET POSITION MOVEMENT INDEX: | |||
| – 6-Week Change in Strength Index: | 4.5 | -3.9 | -6.0 |
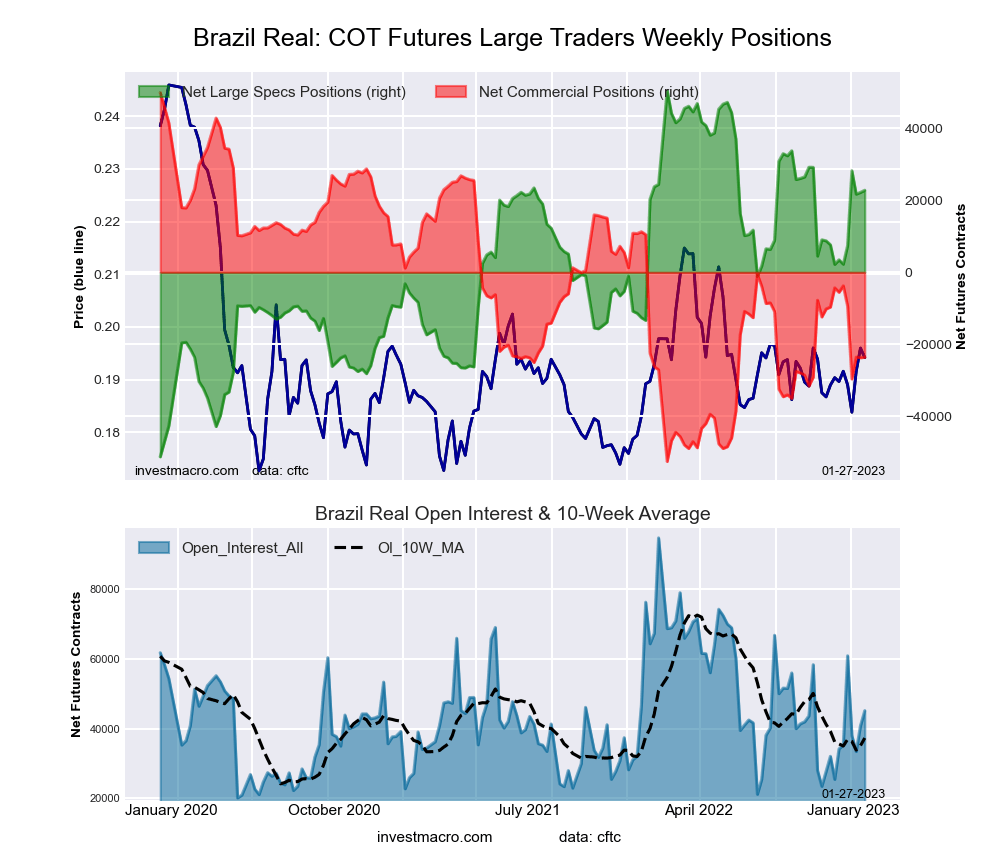
Brazilian Real Futures:
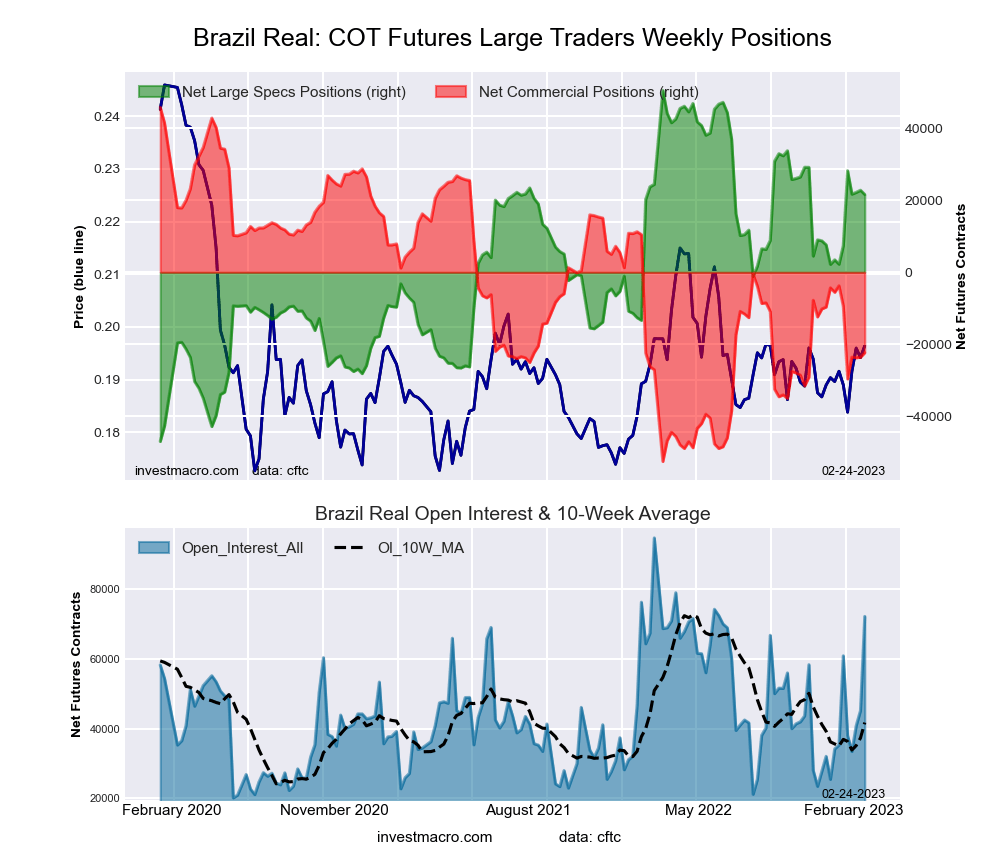 The Brazilian Real large speculator standing for the week equaled a net position of 21,597 contracts in the data reported. This was a weekly lowering of -1,188 contracts from the previous week which had a total of 22,785 net contracts.
This week’s current strength score (the trader positioning range over the past three years, measured from 0 to 100) shows the speculators are currently Bullish with a score of 69.0 percent. The commercials are Bearish with a score of 31.7 percent and the small traders (not shown in chart) are Bullish with a score of 70.4 percent.
| BRAZIL REAL Statistics | SPECULATORS | COMMERCIALS | SMALL TRADERS |
| – Percent of Open Interest Longs: | 54.9 | 39.5 | 5.2 |
| – Percent of Open Interest Shorts: | 25.0 | 70.5 | 4.2 |
| – Net Position: | 21,597 | -22,343 | 746 |
| – Gross Longs: | 39,609 | 28,490 | 3,776 |
| – Gross Shorts: | 18,012 | 50,833 | 3,030 |
| – Long to Short Ratio: | 2.2 to 1 | 0.6 to 1 | 1.2 to 1 |
| NET POSITION TREND: | |||
| – Strength Index Score (3 Year Range Pct): | 69.0 | 31.7 | 70.4 |
| – Strength Index Reading (3 Year Range): | Bullish | Bearish | Bullish |
| NET POSITION MOVEMENT INDEX: | |||
| – 6-Week Change in Strength Index: | 20.7 | -19.5 | -8.9 |
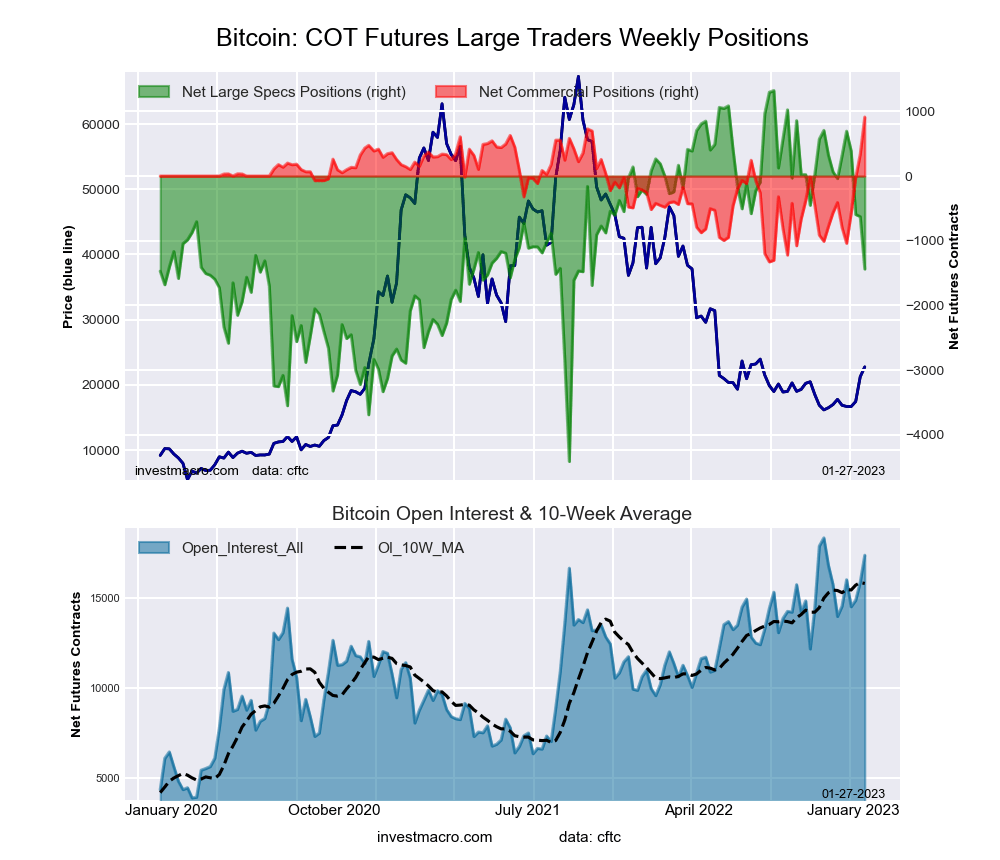
Bitcoin Futures:
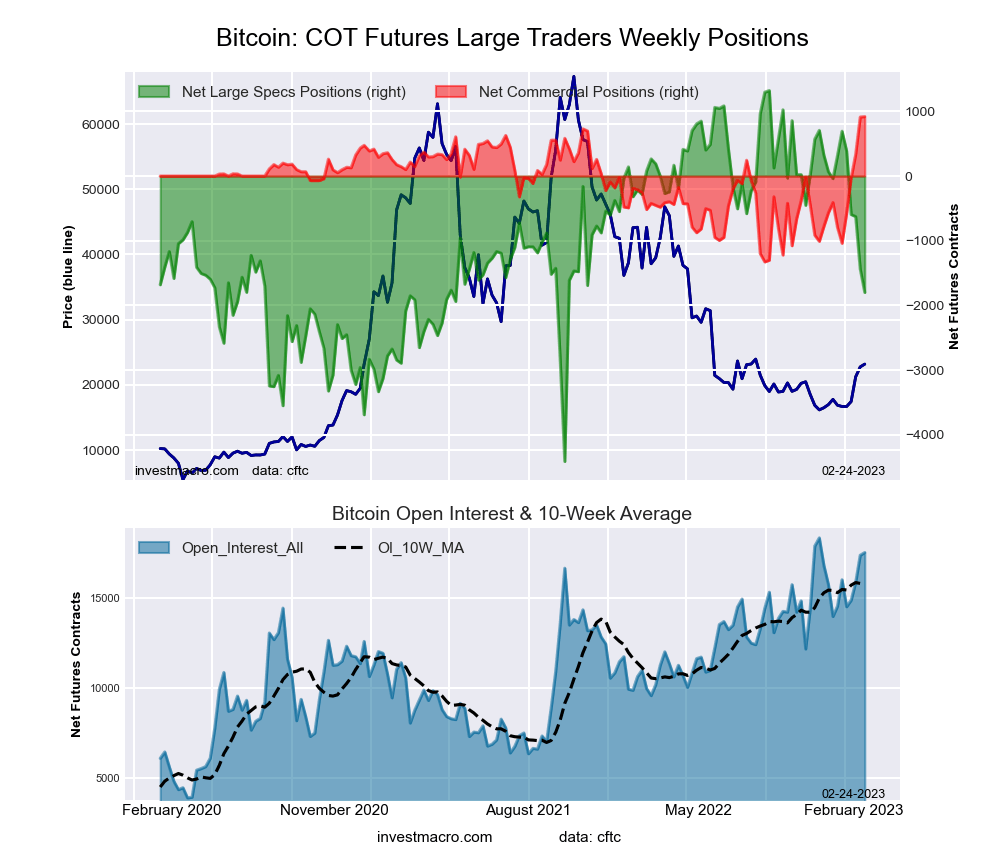 The Bitcoin large speculator standing for the week equaled a net position of -1,799 contracts in the data reported. This was a weekly decline of -362 contracts from the previous week which had a total of -1,437 net contracts.
This week’s current strength score (the trader positioning range over the past three years, measured from 0 to 100) shows the speculators are currently Bearish with a score of 45.6 percent. The commercials are Bullish-Extreme with a score of 100.0 percent and the small traders (not shown in chart) are Bearish with a score of 32.9 percent.
| BITCOIN Statistics | SPECULATORS | COMMERCIALS | SMALL TRADERS |
| – Percent of Open Interest Longs: | 77.5 | 7.4 | 9.3 |
| – Percent of Open Interest Shorts: | 87.8 | 2.1 | 4.3 |
| – Net Position: | -1,799 | 920 | 879 |
| – Gross Longs: | 13,599 | 1,293 | 1,635 |
| – Gross Shorts: | 15,398 | 373 | 756 |
| – Long to Short Ratio: | 0.9 to 1 | 3.5 to 1 | 2.2 to 1 |
| NET POSITION TREND: | |||
| – Strength Index Score (3 Year Range Pct): | 45.6 | 100.0 | 32.9 |
| – Strength Index Reading (3 Year Range): | Bearish | Bullish-Extreme | Bearish |
| NET POSITION MOVEMENT INDEX: | |||
| – 6-Week Change in Strength Index: | -36.9 | 76.3 | 9.1 |
Article By InvestMacro – Receive our weekly COT Newsletter
*COT Report: The COT data, released weekly to the public each Friday, is updated through the most recent Tuesday (data is 3 days old) and shows a quick view of how large speculators or non-commercials (for-profit traders) were positioned in the futures markets.
The CFTC categorizes trader positions according to commercial hedgers (traders who use futures contracts for hedging as part of the business), non-commercials (large traders who speculate to realize trading profits) and nonreportable traders (usually small traders/speculators) as well as their open interest (contracts open in the market at time of reporting). See CFTC criteria here.


