By InvestMacro
Here are the latest charts and statistics for the Commitment of Traders (COT) data published by the Commodities Futures Trading Commission (CFTC).
The latest COT data is updated through Tuesday June 9th and shows a quick view of how large market participants (for-profit speculators and commercial traders) were positioned in the futures markets. All currency positions are in direct relation to the US dollar where, for example, a bet for the euro is a bet that the euro will rise versus the dollar while a bet against the euro will be a bet that the euro will decline versus the dollar.
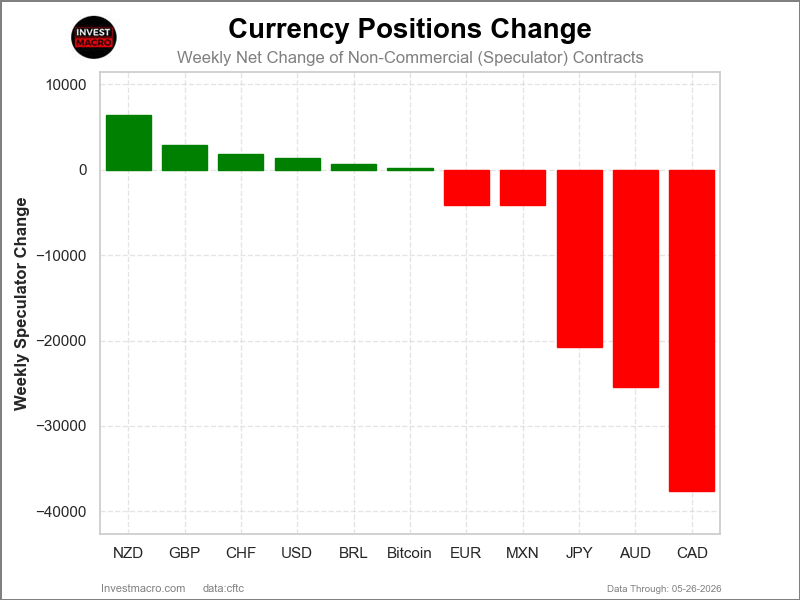
Weekly Speculator Changes led by Mexican Peso & Bitcoin
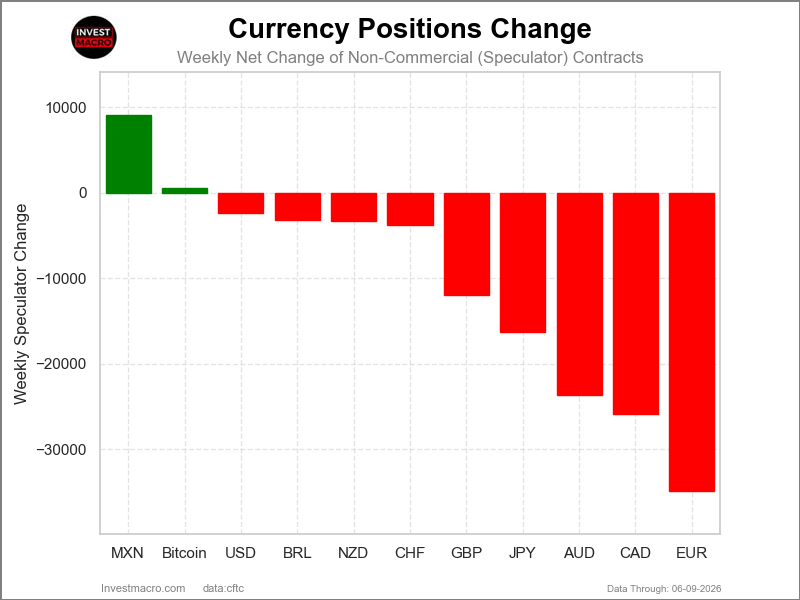
The COT currency market speculator bets were lower this week as two out of the eleven currency markets we cover had higher positioning while the other nine markets had lower speculator contracts.
Leading the gains for the currency markets was the Mexican Peso (9,144 contracts) and with the Bitcoin (560 contracts) also showing positive weeks.
The currencies seeing declines in speculator bets on the week were the EuroFX (-34,934 contracts), the Canadian Dollar (-25,888 contracts), the Australian Dollar (-23,652 contracts), the Japanese Yen (-16,251 contracts), the British Pound (-11,995 contracts), the Swiss Franc (-3,756 contracts), the New Zealand Dollar (-3,325 contracts), the Brazilian Real (-3,134 contracts) and with the US Dollar Index (-2,374 contracts) also registering lower bets on the week.
Currency Speculator Roundup: Mexican Peso Bets rise as Euro, CAD Bets drop
Highlighting the major Currencies market futures positioning this week was the Mexican peso, which was the highest weekly gainer. The Mexican peso position rose by over 9,000 weekly contracts this week and is currently the most bullish of the Currencies right now according to net speculator position. The overall position is now at a standing of 63,801 net contracts and the peso position has been overall in a bullish level for 72 consecutive weeks. Recently, the Bank of Mexico cut its interest rate by 25 basis points to a new level of 6.50% with analysts speculating that this could end the easing cycle which began over a year ago and the next path for interest rates is uncertain. In the Forex markets, the Mexican peso has been on a strong uptrend since February 2025 with the MXN is up by over 22% since the lowest levels of 2025 against the US dollar.
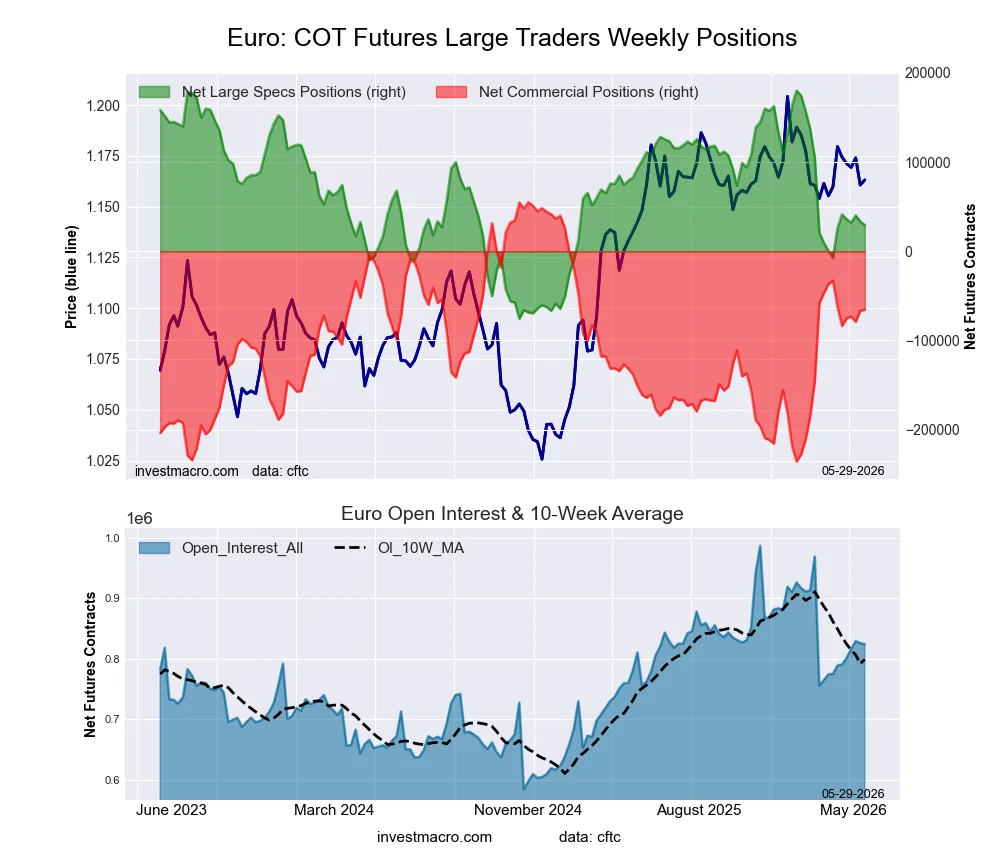
Next up, the Euro speculator position dropped by over -34,000 contracts this week, marking the most bearish weekly change in the past 12 weeks. Overall, the euro speculator position has now fallen for three out of the past four weeks and has fallen to the lowest standing since April. The current level of net speculator positions is at 13,932 contracts and is essentially a neutral-to-small bullish level in the big scheme of things. The European Central Bank, this week (on Thursday June 11th), increased their interest rate by 25 basis points to a total level of 2.25% and marked the first rate increase in almost three years. Despite the weakness in speculative bets for the week, the euro price in the Forex markets continues to trade in a sideways range between 1.1500 and 1.1950, with this week’s close for the euro against the US dollar at 1.1617.
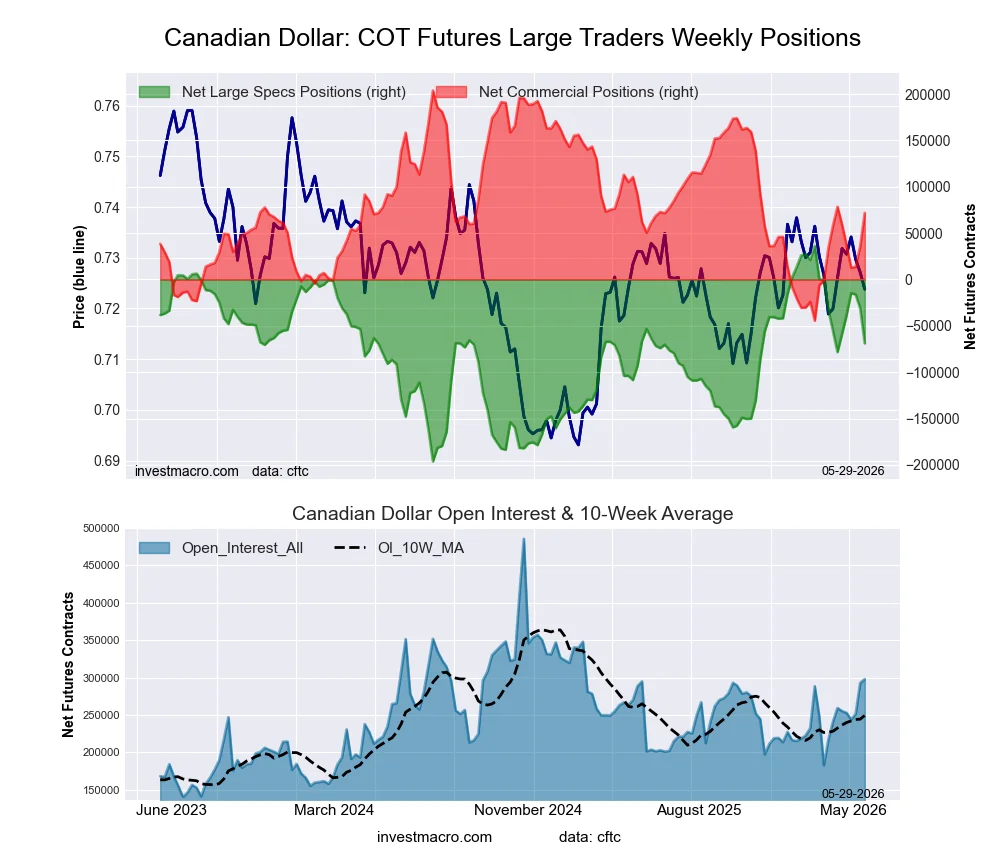
The Canadian dollar speculator position dropped sharply and has now fallen for five consecutive weeks. The Canadian dollar positioning has now fallen by -105,340 net contracts in just the past five weeks and is now at a net position standing of -119,999 contracts. This marks the lowest or most bearish level for the Canadian dollar contracts since December 9th, a span of 26 weeks. The Bank of Canada this week held its interest rate steady at 2.25%, with uncertainty which way policy could go in the near future as inflation due to the Iran war is an issue. In the Forex markets, the Canadian dollar against the US dollar saw a slight uptick this week after falling in four out of the previous five weeks that saw prices drop to the downside out of its previous ascending triangle pattern. The Canadian dollar was helped out and bounced off of resistance at the 0.7150 level, which is where support lies currently and could mark a level of down-trending action if this level is broken.
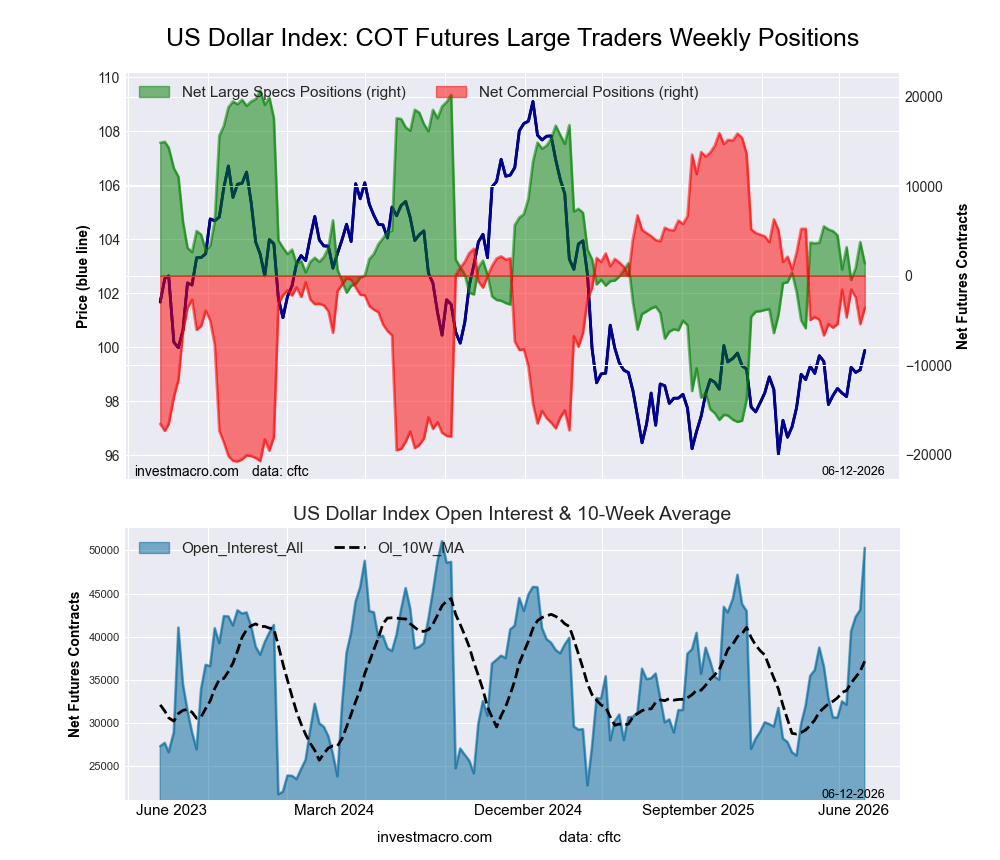
The US Dollar Index saw weekly speculator bets decline by over -2,000 contracts this week following two weeks of gains. The current US Dollar Index positioning is very much in a neutral-to-small-bullish level with an overall net speculator standing of just 1,384 contracts. The DX speculator positioning has been in this small bullish situation now for 13 consecutive weeks with only 1 small dip into a small bearish position in that time-frame. Before that, the DX positioning had been in an overall bearish level for 38 out of the previous 39 weeks through March 10th. The US Dollar Index price this week tested the upper range of its sideways channel that the currency has been in for quite some time. This channel has a low level of 96.50 with an upper resistance level of 100.00. This week, the US Dollar Index price tested the 100.00 level and was rejected lower with a close at 99.49. A breakout above 100 could see a play towards 102.50 in the near future.
Brazilian Real and Mexican Peso lead Currency market price performances
The leading gains for the major Currency markets this week saw the Brazilian Real up by 2.38% over the past five days. The Mexican Peso was next with a gain over 1% with a 1.25% rise.
The New Zealand Dollar was higher by 0.64%, followed by the British Pound Sterling, which rose by 0.50%. Next up, the Euro was higher by 0.41%, while Bitcoin was marginally higher by 0.32%. The Australian Dollar was virtually unchanged with an uptick of 0.09%, followed by the Japanese Yen, which edged higher by 0.05%, and the Swiss Franc, which saw an uptick by 0.03%.
On the downside, the Canadian Dollar was lower by -0.32%. The US Dollar Index was the biggest decliner on the week with a -0.49% decline.
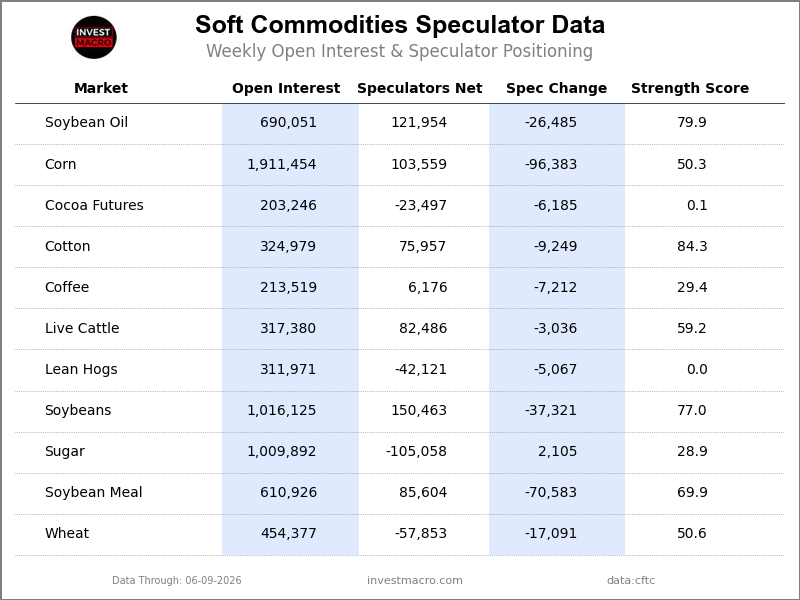
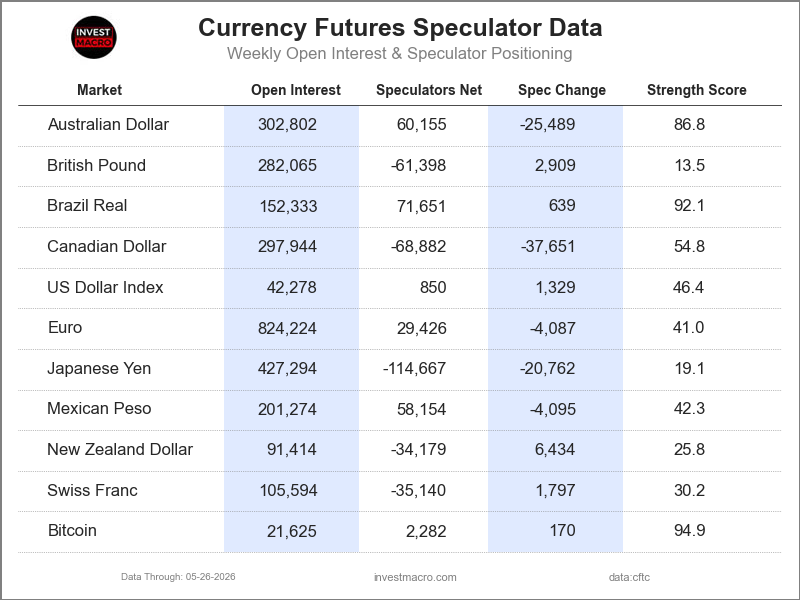
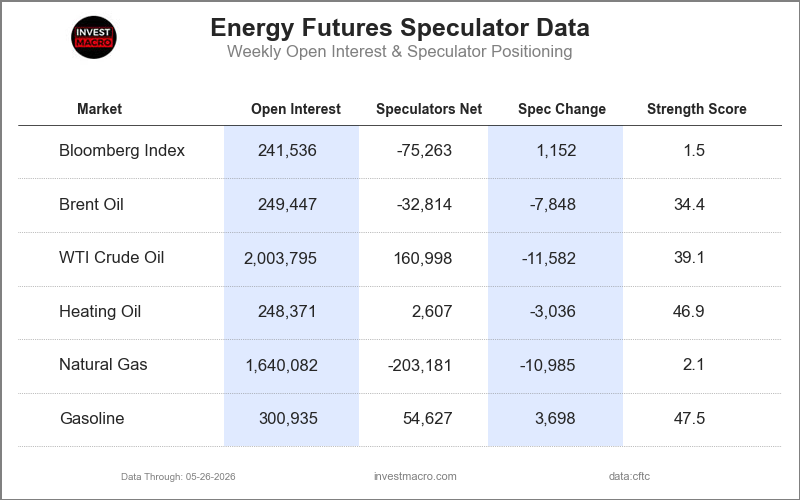
Currencies Data:
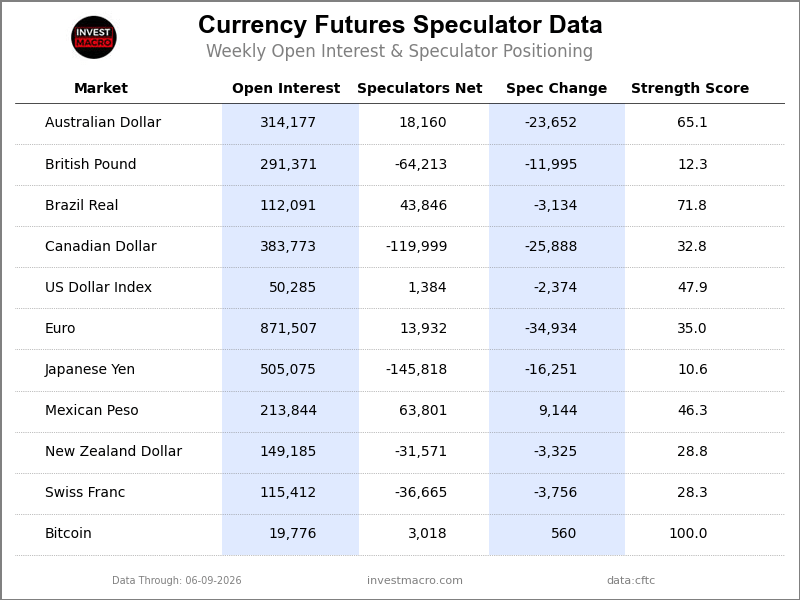
Legend: Open Interest | Speculators Current Net Position | Weekly Specs Change | Specs Strength Score compared to last 3-Years (0-100 range)
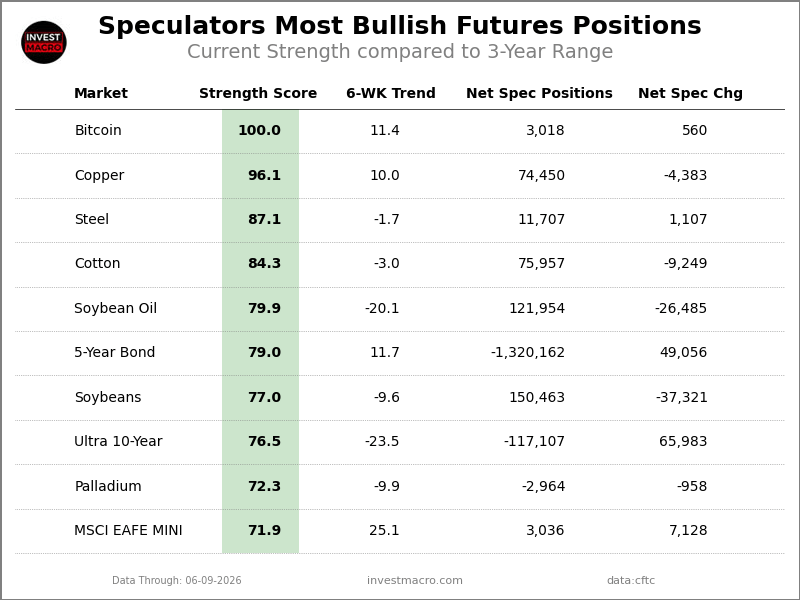
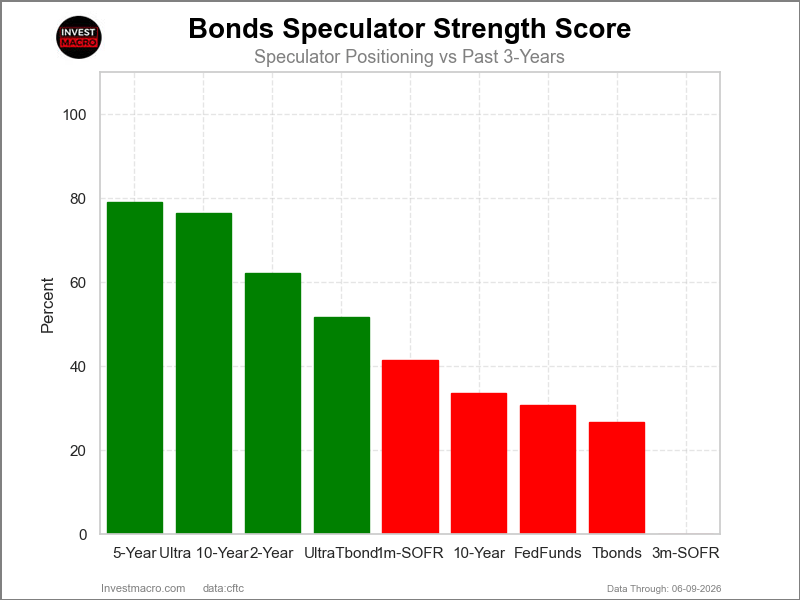
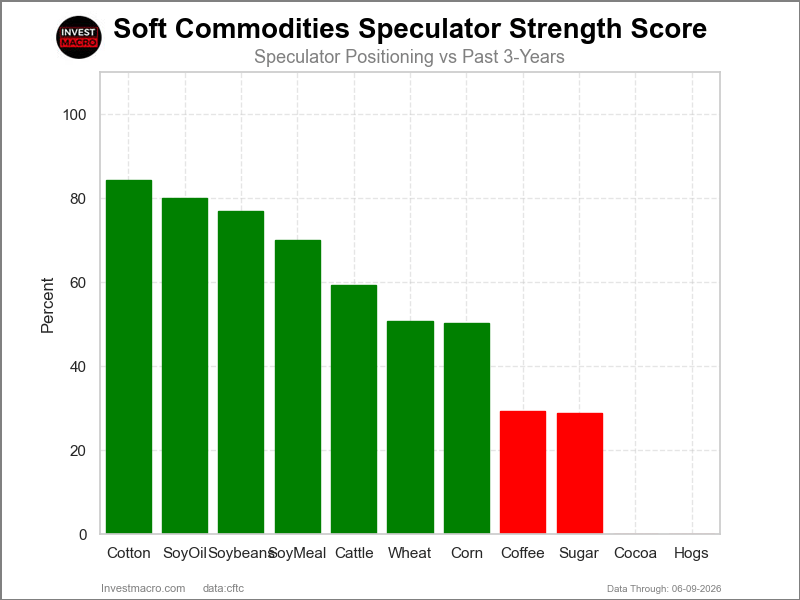
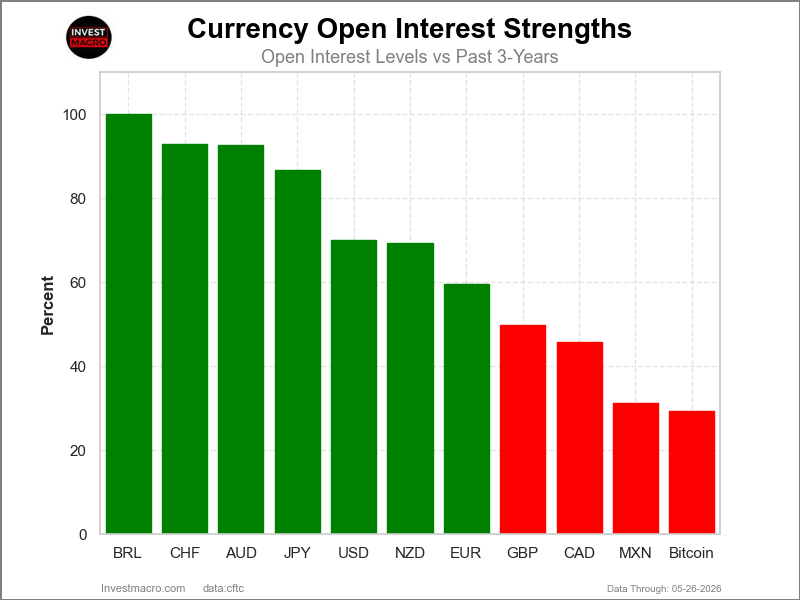
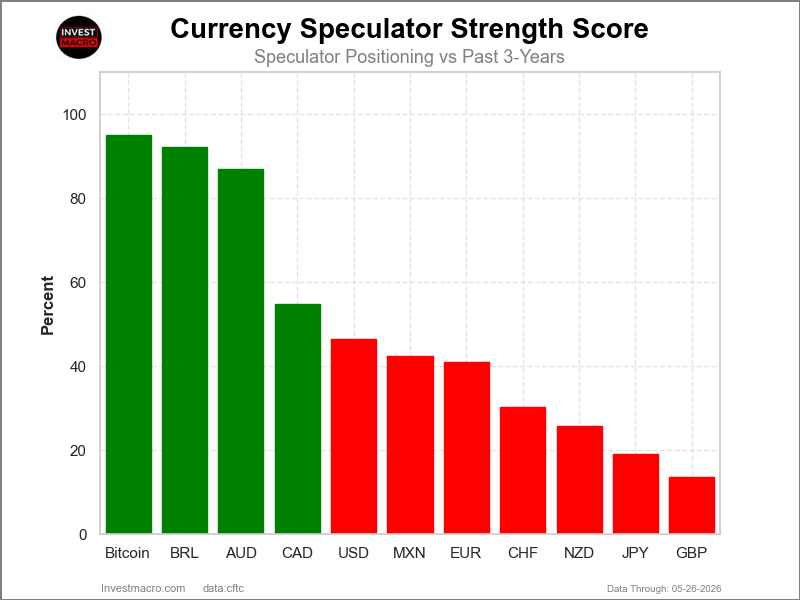
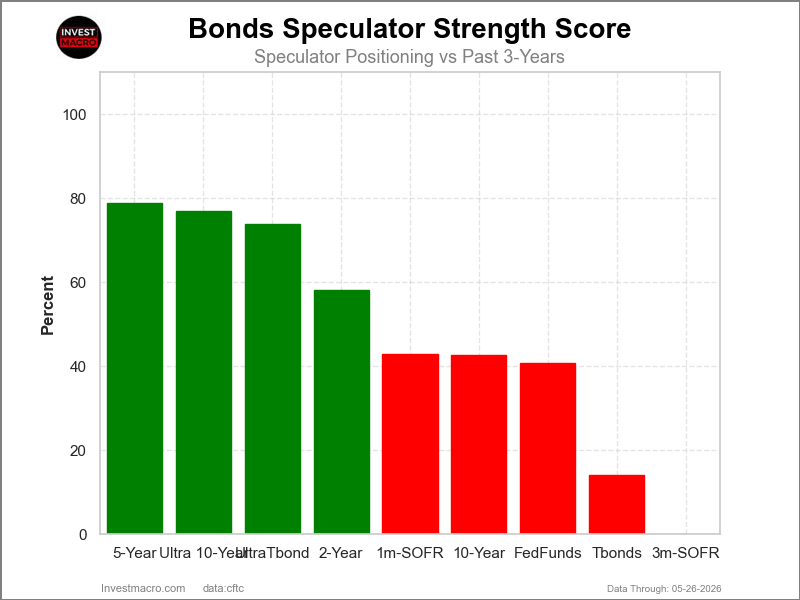
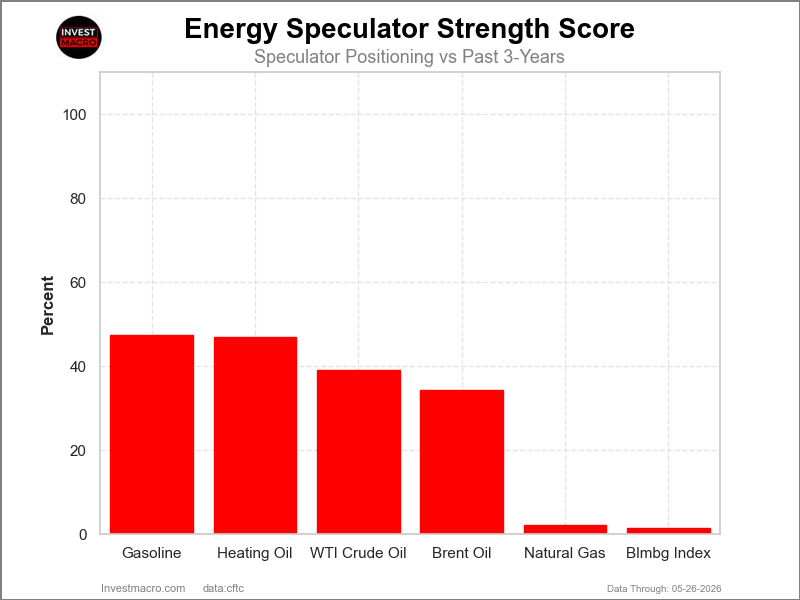
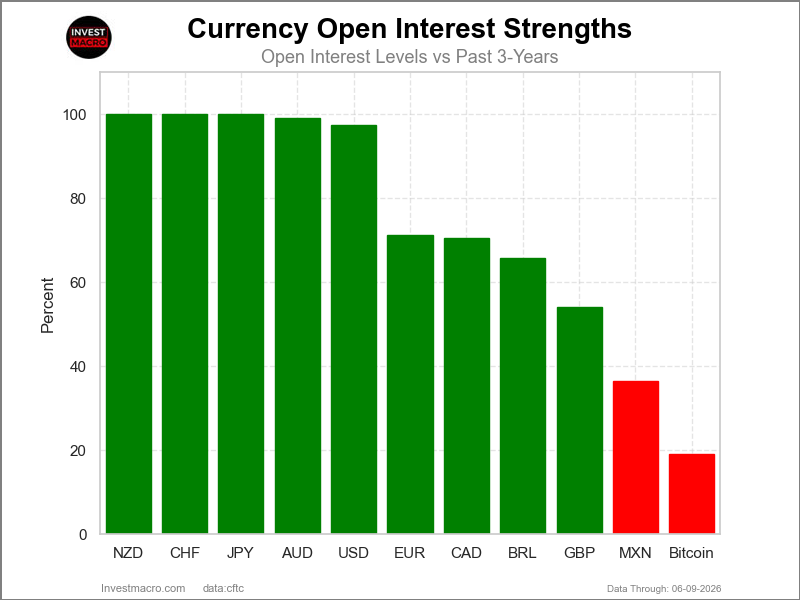
Strength Scores led by Bitcoin & Brazilian Real
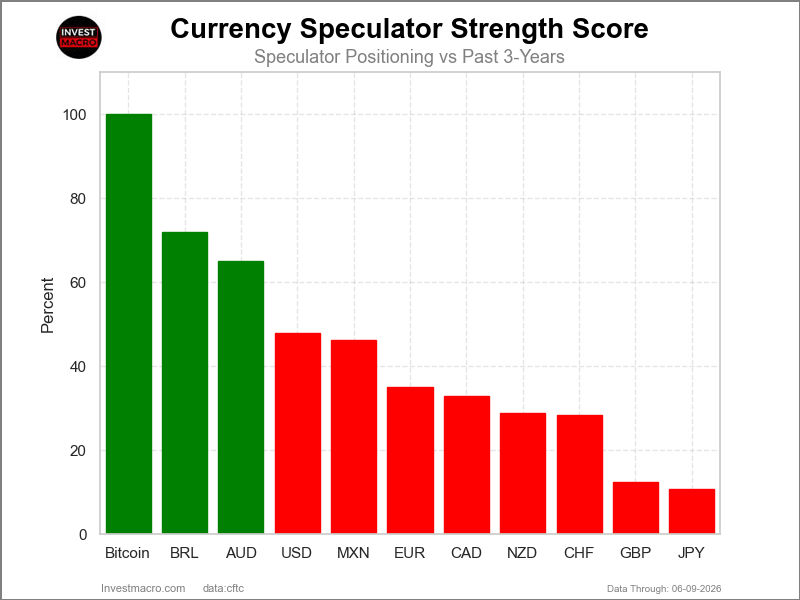
COT Strength Scores (a normalized measure of Speculator positions over a 3-Year range, from 0 to 100 where above 80 is Extreme-Bullish and below 20 is Extreme-Bearish) showed that the Bitcoin (100 percent) and the Brazilian Real (72 percent) lead the currency markets this week. The Australian Dollar (65 percent) comes in as the next highest in the weekly strength scores.
On the downside, the Japanese Yen (11 percent) and the British Pound (12 percent) come in at the lowest strength levels currently and are in Extreme-Bearish territory (below 20 percent). The next lowest strength scores are the Swiss Franc (28 percent) and the New Zealand Dollar (29 percent).
3-Year Strength Statistics:
US Dollar Index (47.9 percent) vs US Dollar Index previous week (54.3 percent)
EuroFX (35.0 percent) vs EuroFX previous week (48.6 percent)
British Pound Sterling (12.3 percent) vs British Pound Sterling previous week (17.4 percent)
Japanese Yen (10.6 percent) vs Japanese Yen previous week (15.0 percent)
Swiss Franc (28.3 percent) vs Swiss Franc previous week (36.4 percent)
Canadian Dollar (32.8 percent) vs Canadian Dollar previous week (44.0 percent)
Australian Dollar (65.1 percent) vs Australian Dollar previous week (77.3 percent)
New Zealand Dollar (28.8 percent) vs New Zealand Dollar previous week (32.6 percent)
Mexican Peso (46.3 percent) vs Mexican Peso previous week (39.8 percent)
Brazilian Real (71.8 percent) vs Brazilian Real previous week (74.1 percent)
Bitcoin (100.0 percent) vs Bitcoin previous week (89.8 percent)
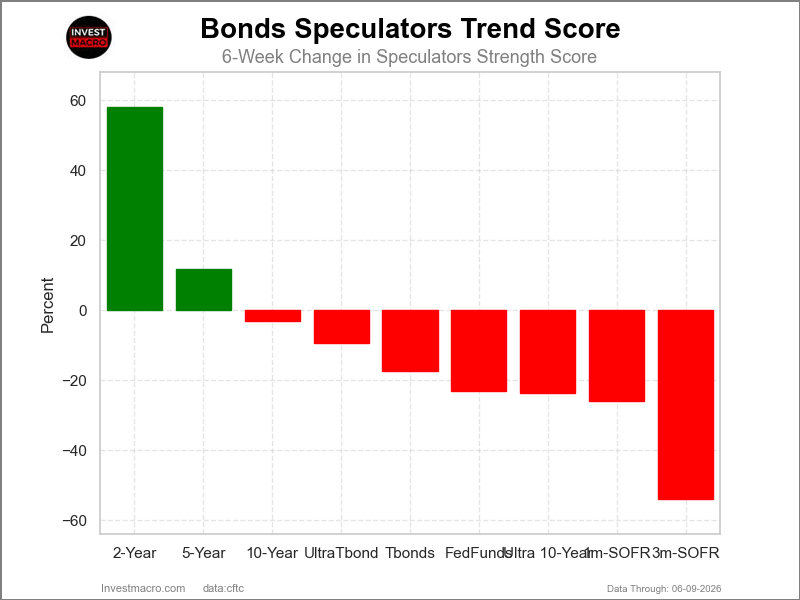
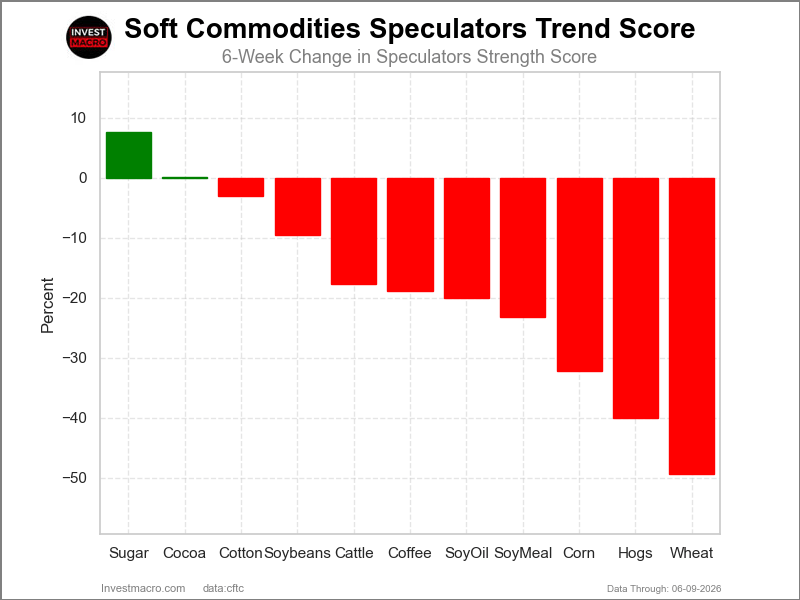
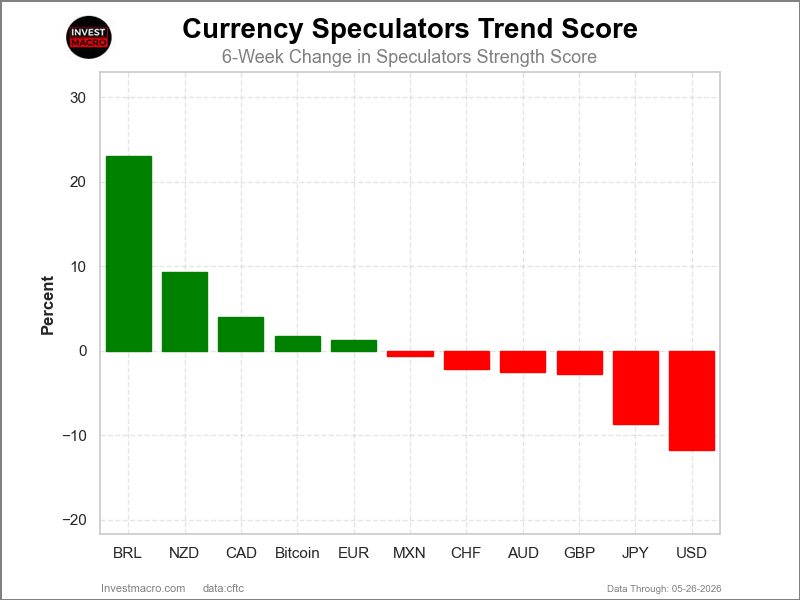
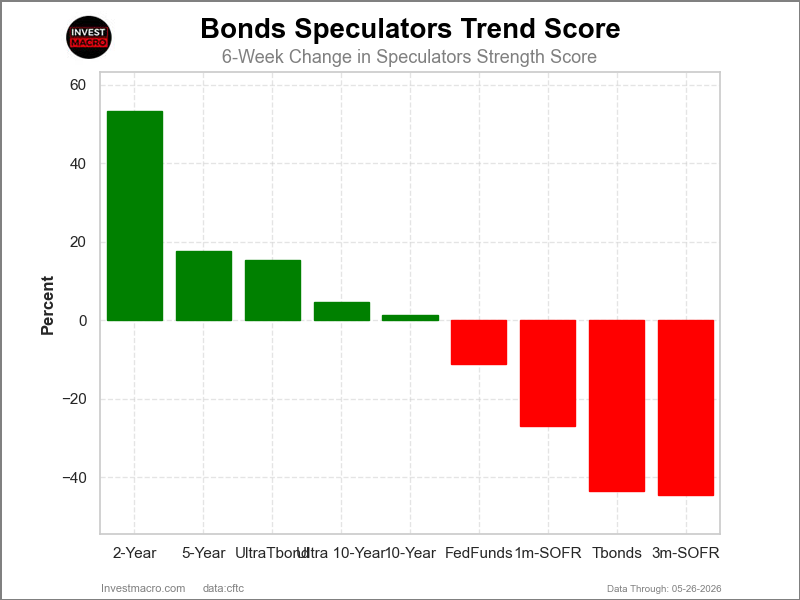
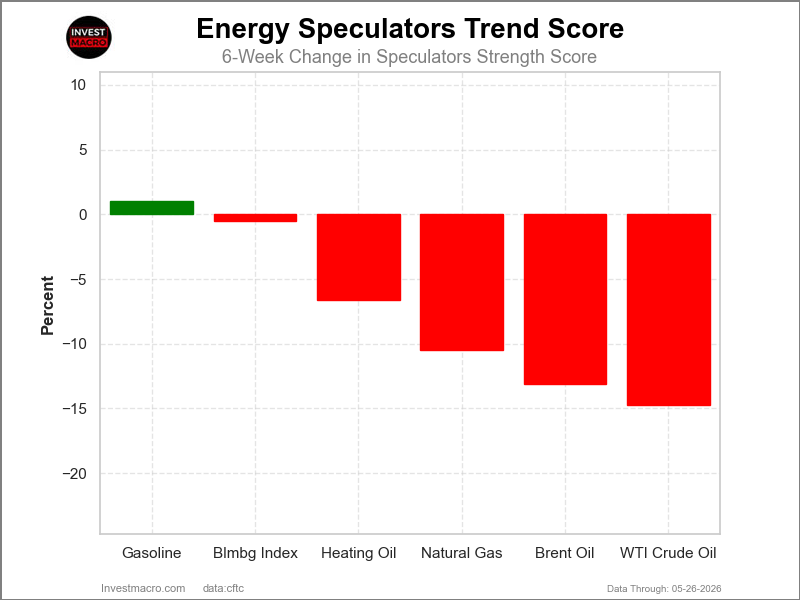
New Zealand Dollar & Bitcoin top the 6-Week Strength Trends
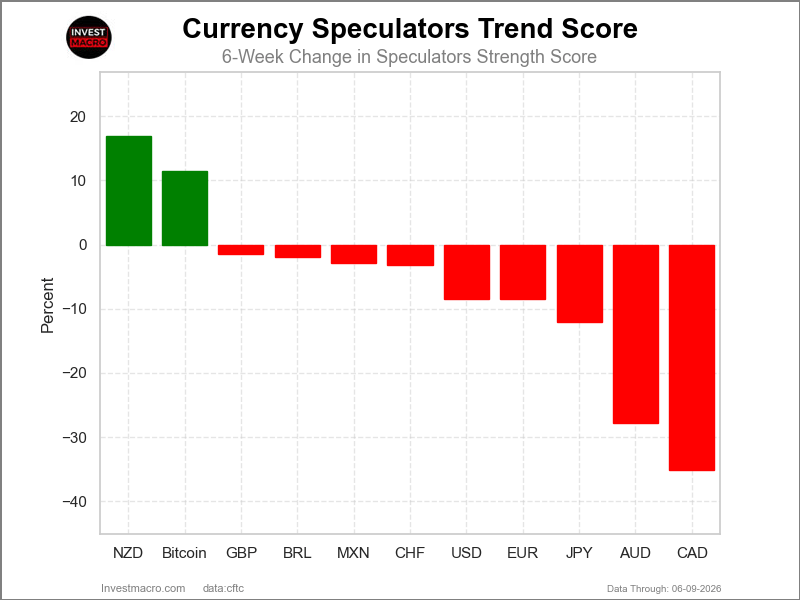
COT Strength Score Trends (or move index, calculates the 6-week changes in strength scores) showed that the New Zealand Dollar (17 percent) and Bitcoin (11 percent) lead the past six weeks trends for the currencies.
The Canadian Dollar (-35 percent) leads the downside trend scores currently with the Australian Dollar (-28 percent), Japanese Yen (-12 percent) and the EuroFX (-9 percent) following next with lower trend scores.
3-Year Strength Trends:
US Dollar Index (-8.4 percent) vs US Dollar Index previous week (-3.3 percent)
EuroFX (-8.5 percent) vs EuroFX previous week (2.9 percent)
British Pound Sterling (-1.5 percent) vs British Pound Sterling previous week (-0.1 percent)
Japanese Yen (-12.0 percent) vs Japanese Yen previous week (-9.7 percent)
Swiss Franc (-3.1 percent) vs Swiss Franc previous week (0.8 percent)
Canadian Dollar (-35.1 percent) vs Canadian Dollar previous week (-15.2 percent)
Australian Dollar (-27.8 percent) vs Australian Dollar previous week (-11.9 percent)
New Zealand Dollar (16.9 percent) vs New Zealand Dollar previous week (23.1 percent)
Mexican Peso (-2.8 percent) vs Mexican Peso previous week (-9.2 percent)
Brazilian Real (-1.9 percent) vs Brazilian Real previous week (2.5 percent)
Bitcoin (11.4 percent) vs Bitcoin previous week (7.0 percent)
Individual COT Forex Markets:
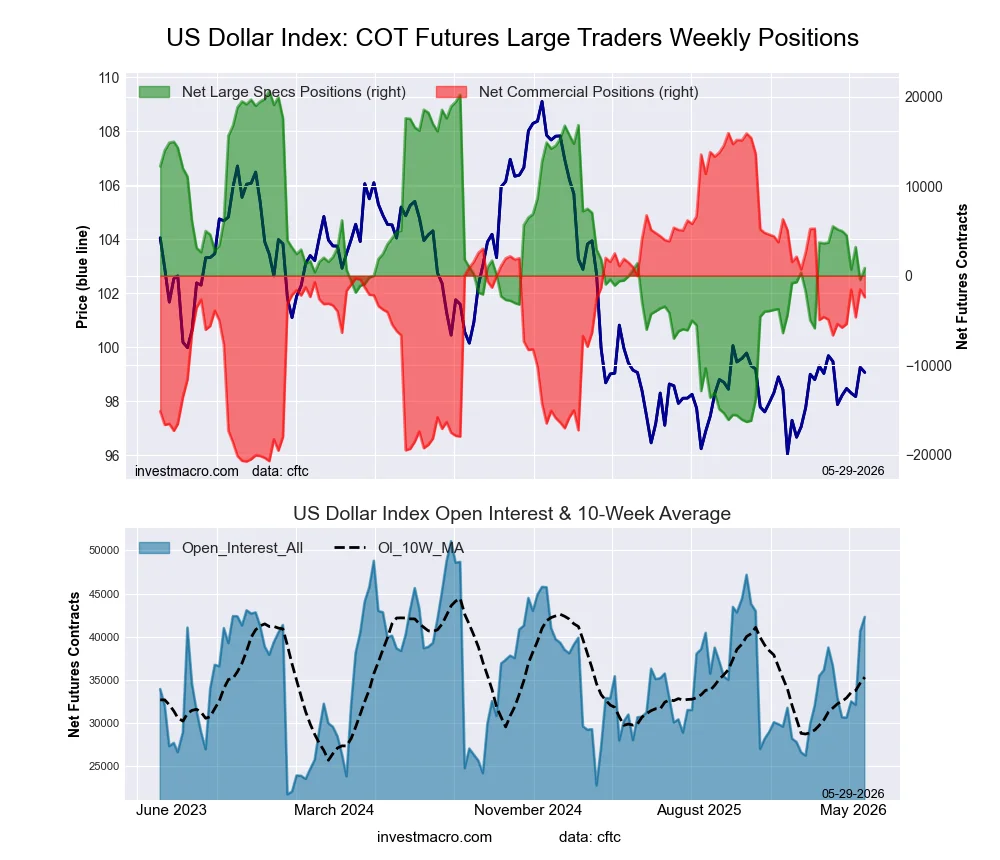
US Dollar Index Futures:
 Positioning Notes:
- US Dollar Index large speculator standing this week came in at a net position of 1,384 contracts in the data reported through Tuesday.
- Weekly Speculator position decrease of -2,374 contracts from the previous week which had a total of 3,758 net contracts.
- This week’s current strength score (range over the past 3 years, measured from 0 to 100) shows the speculators are currently Bearish with a score of 47.9 percent.
- The Commercials are Bearish with a score of 46.8 percent.
- The Small Traders (not shown in chart) are Bullish-Extreme with a score of 96.4 percent.
Price Trend-Following Model: Uptrend
Our weekly trend-following model classifies the current market price position as: Uptrend.
| US DOLLAR INDEX Statistics | SPECULATORS | COMMERCIALS | SMALL TRADERS |
| – Percent of Open Interest Longs: | 55.5 | 32.0 | 8.1 |
| – Percent of Open Interest Shorts: | 52.7 | 39.2 | 3.7 |
| – Net Position: | 1,384 | -3,599 | 2,215 |
| – Gross Longs: | 27,908 | 16,092 | 4,059 |
| – Gross Shorts: | 26,524 | 19,691 | 1,844 |
| – Long to Short Ratio: | 1.1 to 1 | 0.8 to 1 | 2.2 to 1 |
| NET POSITION TREND: | |||
| – Strength Index Score (3 Year Range Pct): | 47.9 | 46.8 | 96.4 |
| – Strength Index Reading (3 Year Range): | Bearish | Bearish | Bullish-Extreme |
| NET POSITION MOVEMENT INDEX: | |||
| – 6-Week Change in Strength Index: | -8.4 | 4.9 | 28.6 |
Euro Currency Futures:
 Positioning Notes:
- Euro Currency large speculator standing this week came in at a net position of 13,932 contracts in the data reported through Tuesday.
- Weekly Speculator position decrease of -34,934 contracts from the previous week which had a total of 48,866 net contracts.
- This week’s current strength score (range over the past 3 years, measured from 0 to 100) shows the speculators are currently Bearish with a score of 35.0 percent.
- The Commercials are Bullish with a score of 68.0 percent.
- The Small Traders (not shown in chart) are Bearish with a score of 25.5 percent.
Price Trend-Following Model: Downtrend
Our weekly trend-following model classifies the current market price position as: Downtrend.
| EURO Currency Statistics | SPECULATORS | COMMERCIALS | SMALL TRADERS |
| – Percent of Open Interest Longs: | 25.2 | 58.7 | 10.4 |
| – Percent of Open Interest Shorts: | 23.6 | 63.0 | 7.6 |
| – Net Position: | 13,932 | -38,085 | 24,153 |
| – Gross Longs: | 219,564 | 511,359 | 90,399 |
| – Gross Shorts: | 205,632 | 549,444 | 66,246 |
| – Long to Short Ratio: | 1.1 to 1 | 0.9 to 1 | 1.4 to 1 |
| NET POSITION TREND: | |||
| – Strength Index Score (3 Year Range Pct): | 35.0 | 68.0 | 25.5 |
| – Strength Index Reading (3 Year Range): | Bearish | Bullish | Bearish |
| NET POSITION MOVEMENT INDEX: | |||
| – 6-Week Change in Strength Index: | -8.5 | 12.7 | -32.2 |
British Pound Sterling Futures:
 Positioning Notes:
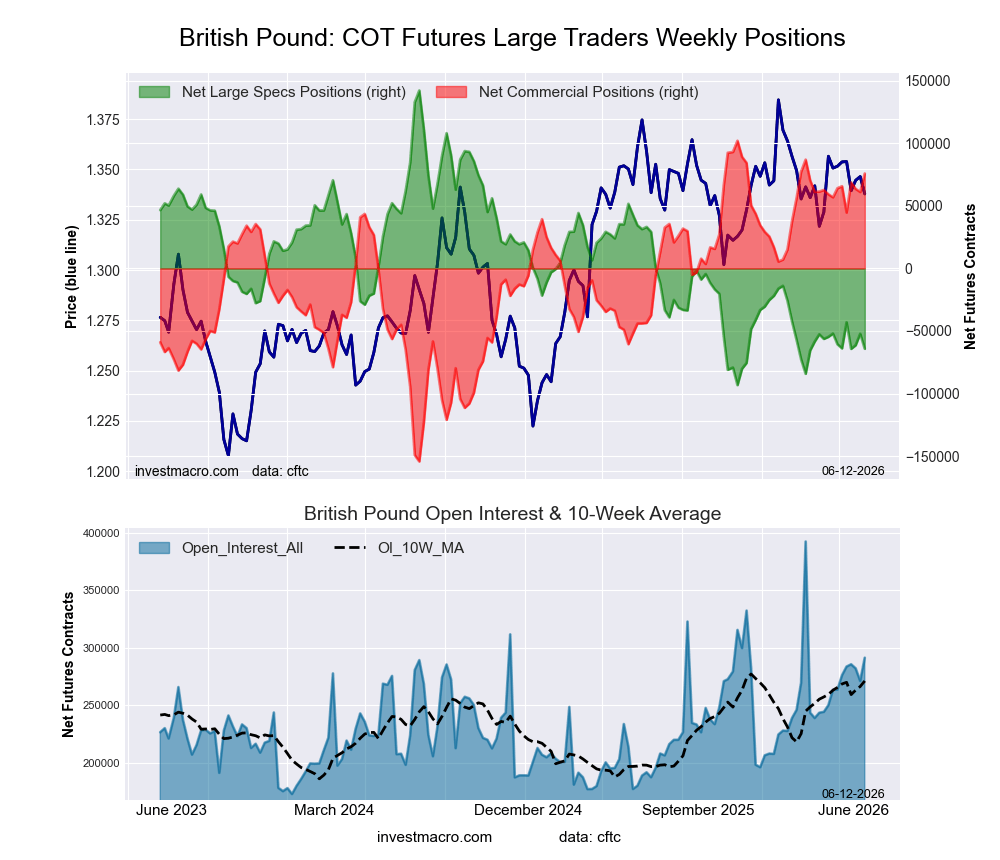
- British Pound Sterling large speculator standing this week came in at a net position of -64,213 contracts in the data reported through Tuesday.
- Weekly Speculator position reduction of -11,995 contracts from the previous week which had a total of -52,218 net contracts.
- This week’s current strength score (range over the past 3 years, measured from 0 to 100) shows the speculators are currently Bearish-Extreme with a score of 12.3 percent.
- The Commercials are Bullish-Extreme with a score of 89.8 percent.
- The Small Traders (not shown in chart) are Bearish with a score of 23.0 percent.
Price Trend-Following Model: Downtrend
Our weekly trend-following model classifies the current market price position as: Downtrend.
| BRITISH POUND Statistics | SPECULATORS | COMMERCIALS | SMALL TRADERS |
| – Percent of Open Interest Longs: | 15.7 | 74.8 | 8.3 |
| – Percent of Open Interest Shorts: | 37.7 | 48.8 | 12.3 |
| – Net Position: | -64,213 | 75,870 | -11,657 |
| – Gross Longs: | 45,743 | 218,025 | 24,172 |
| – Gross Shorts: | 109,956 | 142,155 | 35,829 |
| – Long to Short Ratio: | 0.4 to 1 | 1.5 to 1 | 0.7 to 1 |
| NET POSITION TREND: | |||
| – Strength Index Score (3 Year Range Pct): | 12.3 | 89.8 | 23.0 |
| – Strength Index Reading (3 Year Range): | Bearish-Extreme | Bullish-Extreme | Bearish |
| NET POSITION MOVEMENT INDEX: | |||
| – 6-Week Change in Strength Index: | -1.5 | 4.6 | -21.2 |
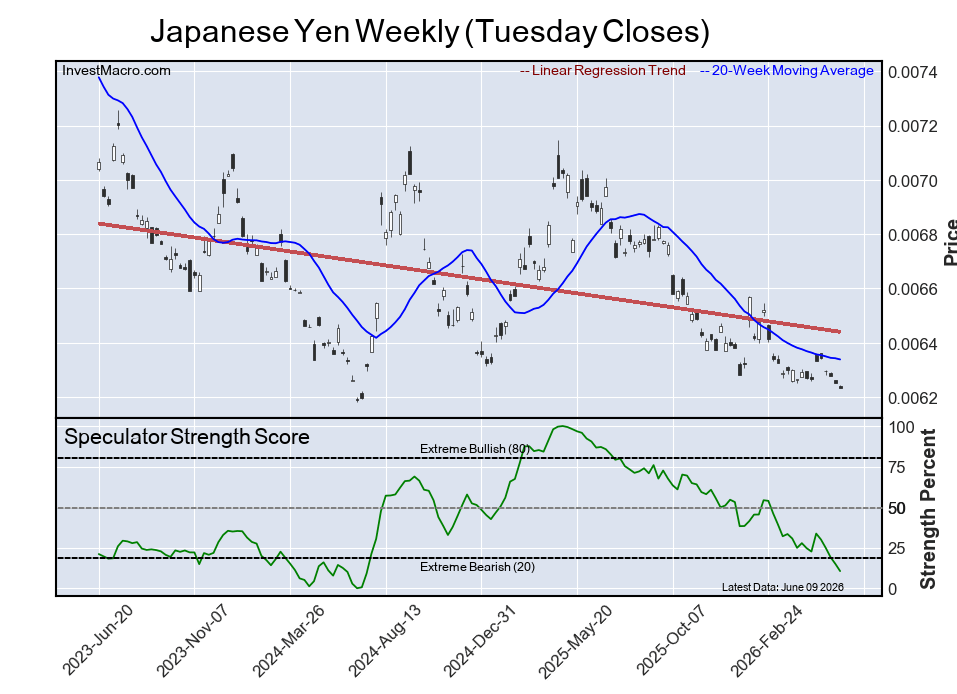
Japanese Yen Futures:
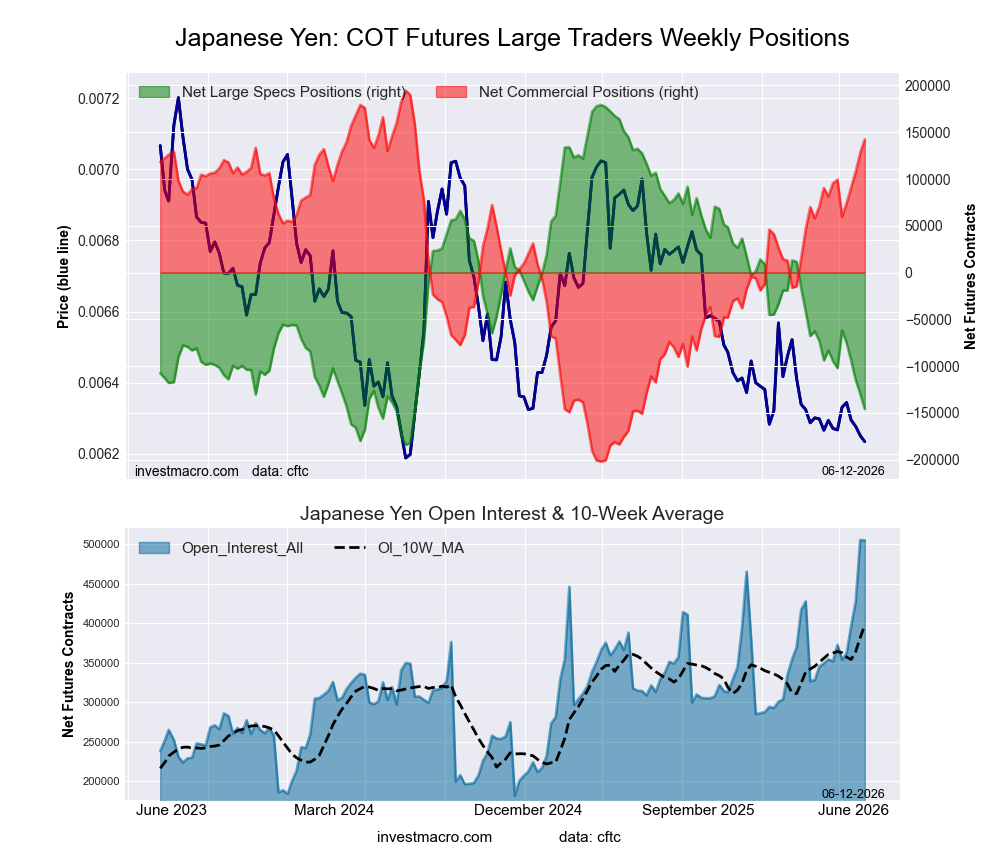 Positioning Notes:
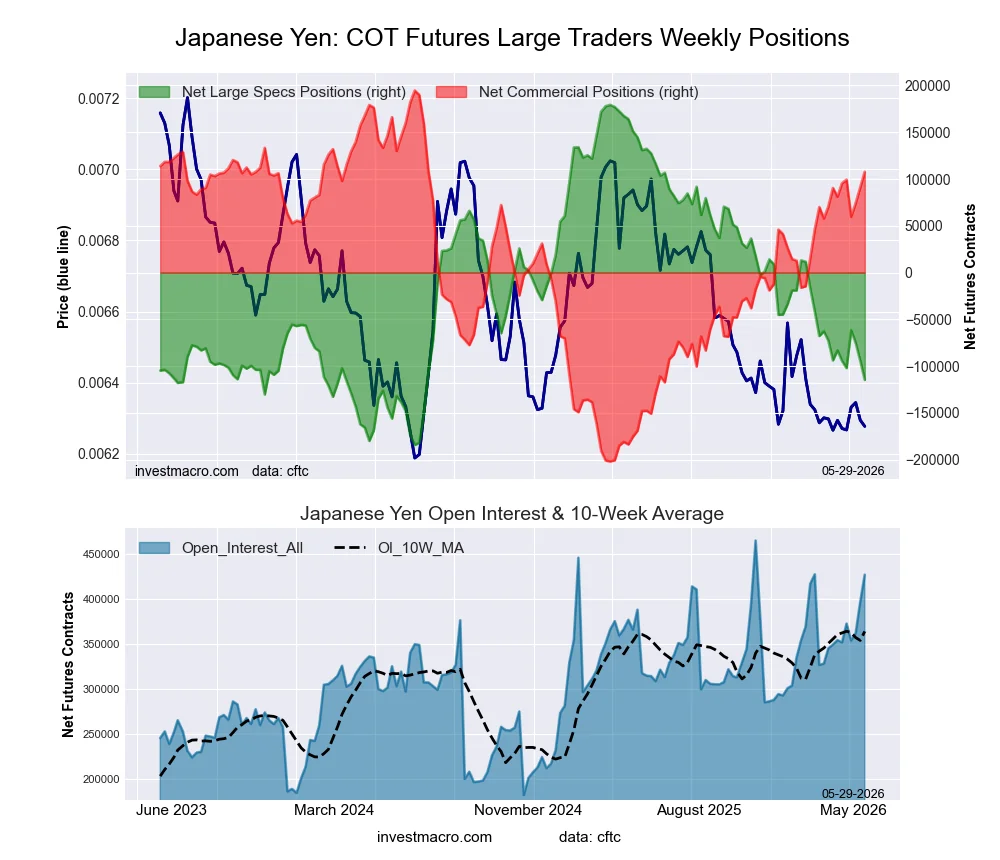
- Japanese Yen large speculator standing this week came in at a net position of -145,818 contracts in the data reported through Tuesday.
- Weekly Speculator position fall of -16,251 contracts from the previous week which had a total of -129,567 net contracts.
- This week’s current strength score (range over the past 3 years, measured from 0 to 100) shows the speculators are currently Bearish-Extreme with a score of 10.6 percent.
- The Commercials are Bullish-Extreme with a score of 86.8 percent.
- The Small Traders (not shown in chart) are Bearish with a score of 42.4 percent.
Price Trend-Following Model: Downtrend
Our weekly trend-following model classifies the current market price position as: Downtrend.
| JAPANESE YEN Statistics | SPECULATORS | COMMERCIALS | SMALL TRADERS |
| – Percent of Open Interest Longs: | 24.1 | 62.0 | 9.2 |
| – Percent of Open Interest Shorts: | 52.9 | 33.9 | 8.5 |
| – Net Position: | -145,818 | 142,369 | 3,449 |
| – Gross Longs: | 121,520 | 313,351 | 46,489 |
| – Gross Shorts: | 267,338 | 170,982 | 43,040 |
| – Long to Short Ratio: | 0.5 to 1 | 1.8 to 1 | 1.1 to 1 |
| NET POSITION TREND: | |||
| – Strength Index Score (3 Year Range Pct): | 10.6 | 86.8 | 42.4 |
| – Strength Index Reading (3 Year Range): | Bearish-Extreme | Bullish-Extreme | Bearish |
| NET POSITION MOVEMENT INDEX: | |||
| – 6-Week Change in Strength Index: | -12.0 | 10.9 | 1.8 |
Swiss Franc Futures:
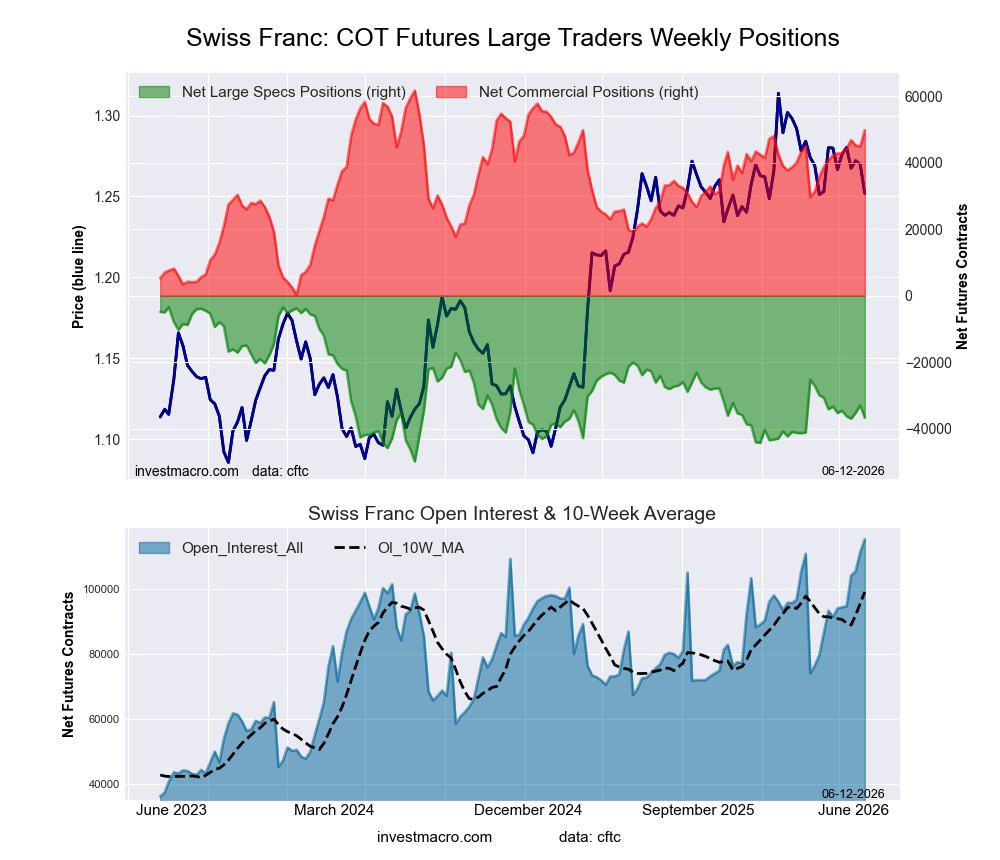 Positioning Notes:
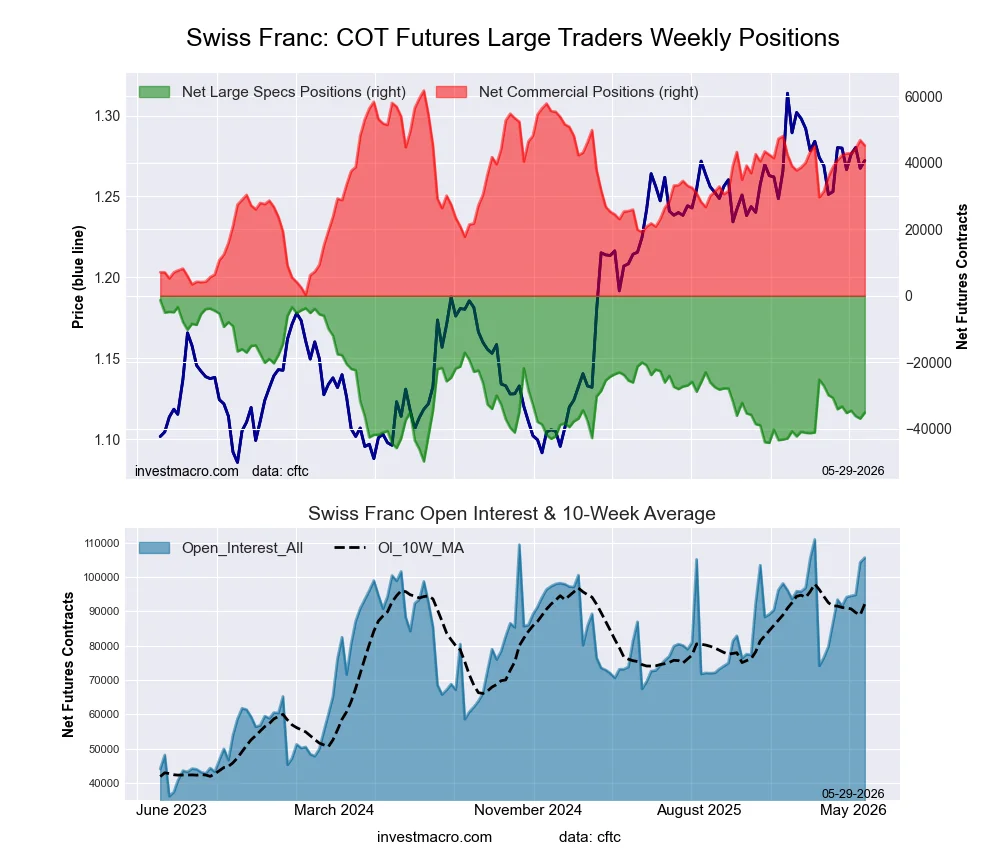
- Swiss Franc large speculator standing this week came in at a net position of -36,665 contracts in the data reported through Tuesday.
- Weekly Speculator position reduction of -3,756 contracts from the previous week which had a total of -32,909 net contracts.
- This week’s current strength score (range over the past 3 years, measured from 0 to 100) shows the speculators are currently Bearish with a score of 28.3 percent.
- The Commercials are Bullish-Extreme with a score of 80.6 percent.
- The Small Traders (not shown in chart) are Bearish with a score of 23.3 percent.
Price Trend-Following Model: Strong Downtrend
Our weekly trend-following model classifies the current market price position as: Strong Downtrend.
| SWISS FRANC Statistics | SPECULATORS | COMMERCIALS | SMALL TRADERS |
| – Percent of Open Interest Longs: | 6.4 | 82.0 | 9.9 |
| – Percent of Open Interest Shorts: | 38.1 | 38.9 | 21.2 |
| – Net Position: | -36,665 | 49,741 | -13,076 |
| – Gross Longs: | 7,335 | 94,612 | 11,370 |
| – Gross Shorts: | 44,000 | 44,871 | 24,446 |
| – Long to Short Ratio: | 0.2 to 1 | 2.1 to 1 | 0.5 to 1 |
| NET POSITION TREND: | |||
| – Strength Index Score (3 Year Range Pct): | 28.3 | 80.6 | 23.3 |
| – Strength Index Reading (3 Year Range): | Bearish | Bullish-Extreme | Bearish |
| NET POSITION MOVEMENT INDEX: | |||
| – 6-Week Change in Strength Index: | -3.1 | 11.4 | -23.6 |
Canadian Dollar Futures:
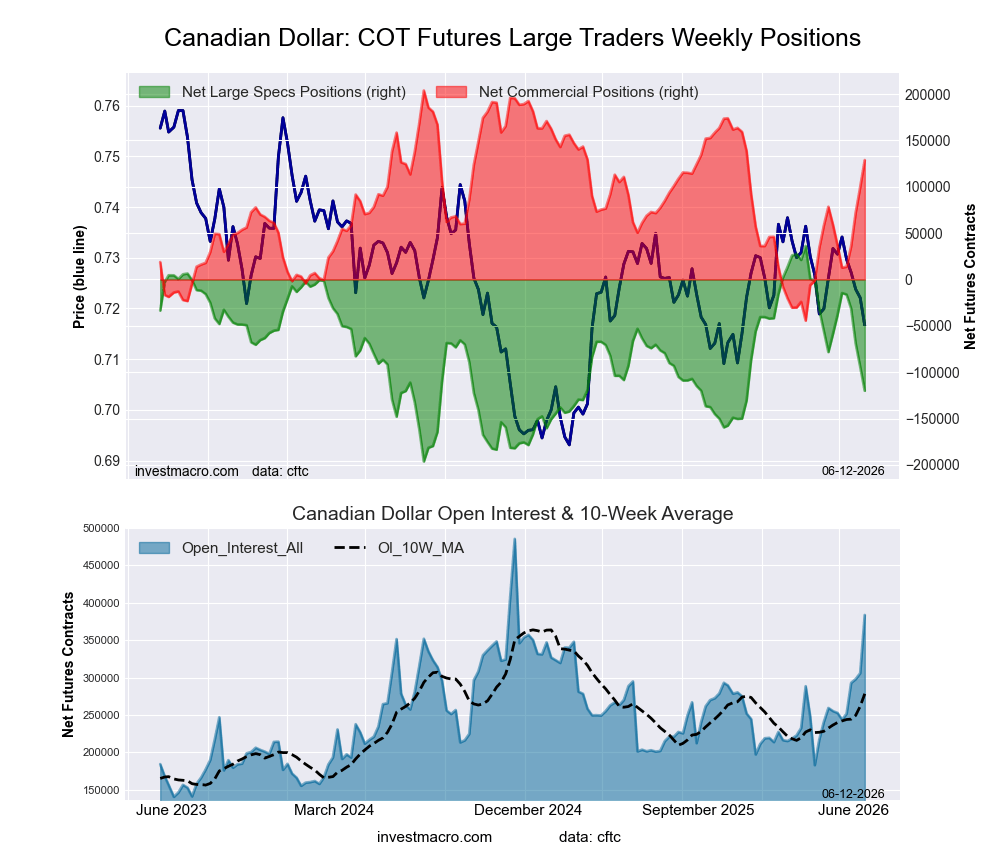 Positioning Notes:
- Canadian Dollar large speculator standing this week came in at a net position of -119,999 contracts in the data reported through Tuesday.
- Weekly Speculator position reduction of -25,888 contracts from the previous week which had a total of -94,111 net contracts.
- This week’s current strength score (range over the past 3 years, measured from 0 to 100) shows the speculators are currently Bearish with a score of 32.8 percent.
- The Commercials are Bullish with a score of 69.8 percent.
- The Small Traders (not shown in chart) are Bearish with a score of 20.7 percent.
Price Trend-Following Model: Strong Downtrend
Our weekly trend-following model classifies the current market price position as: Strong Downtrend.
| CANADIAN DOLLAR Statistics | SPECULATORS | COMMERCIALS | SMALL TRADERS |
| – Percent of Open Interest Longs: | 9.9 | 78.4 | 8.2 |
| – Percent of Open Interest Shorts: | 41.2 | 44.8 | 10.5 |
| – Net Position: | -119,999 | 128,812 | -8,813 |
| – Gross Longs: | 37,944 | 300,856 | 31,377 |
| – Gross Shorts: | 157,943 | 172,044 | 40,190 |
| – Long to Short Ratio: | 0.2 to 1 | 1.7 to 1 | 0.8 to 1 |
| NET POSITION TREND: | |||
| – Strength Index Score (3 Year Range Pct): | 32.8 | 69.8 | 20.7 |
| – Strength Index Reading (3 Year Range): | Bearish | Bullish | Bearish |
| NET POSITION MOVEMENT INDEX: | |||
| – 6-Week Change in Strength Index: | -35.1 | 36.9 | -28.3 |
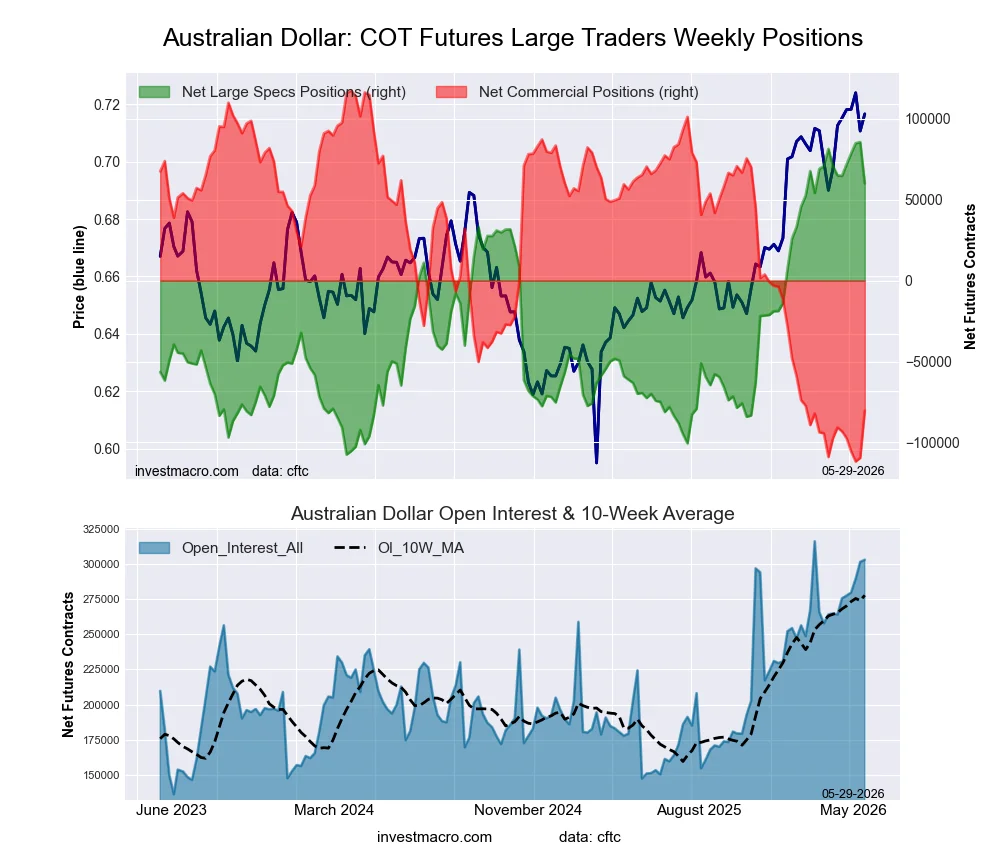
Australian Dollar Futures:
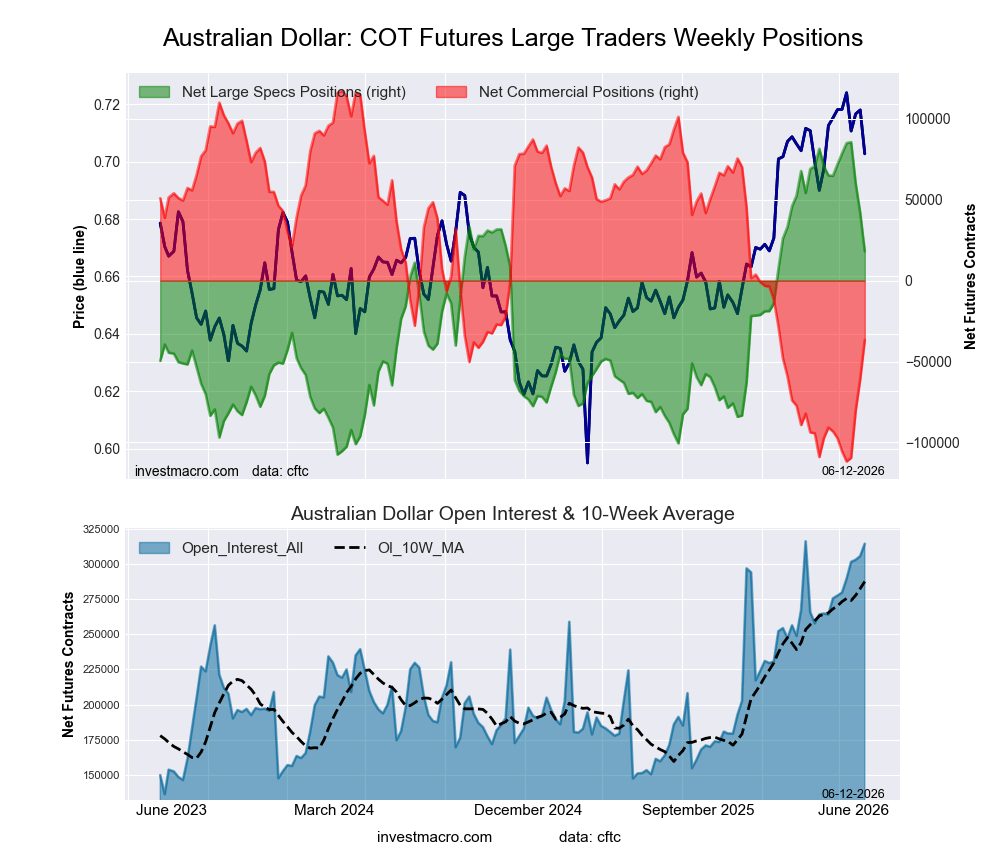 Positioning Notes:
- Australian Dollar large speculator standing this week came in at a net position of 18,160 contracts in the data reported through Tuesday.
- Weekly Speculator position reduction of -23,652 contracts from the previous week which had a total of 41,812 net contracts.
- This week’s current strength score (range over the past 3 years, measured from 0 to 100) shows the speculators are currently Bullish with a score of 65.1 percent.
- The Commercials are Bearish with a score of 32.8 percent.
- The Small Traders (not shown in chart) are Bullish with a score of 79.0 percent.
Price Trend-Following Model: Weak Uptrend
Our weekly trend-following model classifies the current market price position as: Weak Uptrend.
| AUSTRALIAN DOLLAR Statistics | SPECULATORS | COMMERCIALS | SMALL TRADERS |
| – Percent of Open Interest Longs: | 29.6 | 54.9 | 12.3 |
| – Percent of Open Interest Shorts: | 23.8 | 66.6 | 6.4 |
| – Net Position: | 18,160 | -36,669 | 18,509 |
| – Gross Longs: | 92,995 | 172,451 | 38,751 |
| – Gross Shorts: | 74,835 | 209,120 | 20,242 |
| – Long to Short Ratio: | 1.2 to 1 | 0.8 to 1 | 1.9 to 1 |
| NET POSITION TREND: | |||
| – Strength Index Score (3 Year Range Pct): | 65.1 | 32.8 | 79.0 |
| – Strength Index Reading (3 Year Range): | Bullish | Bearish | Bullish |
| NET POSITION MOVEMENT INDEX: | |||
| – 6-Week Change in Strength Index: | -27.8 | 26.5 | -14.9 |
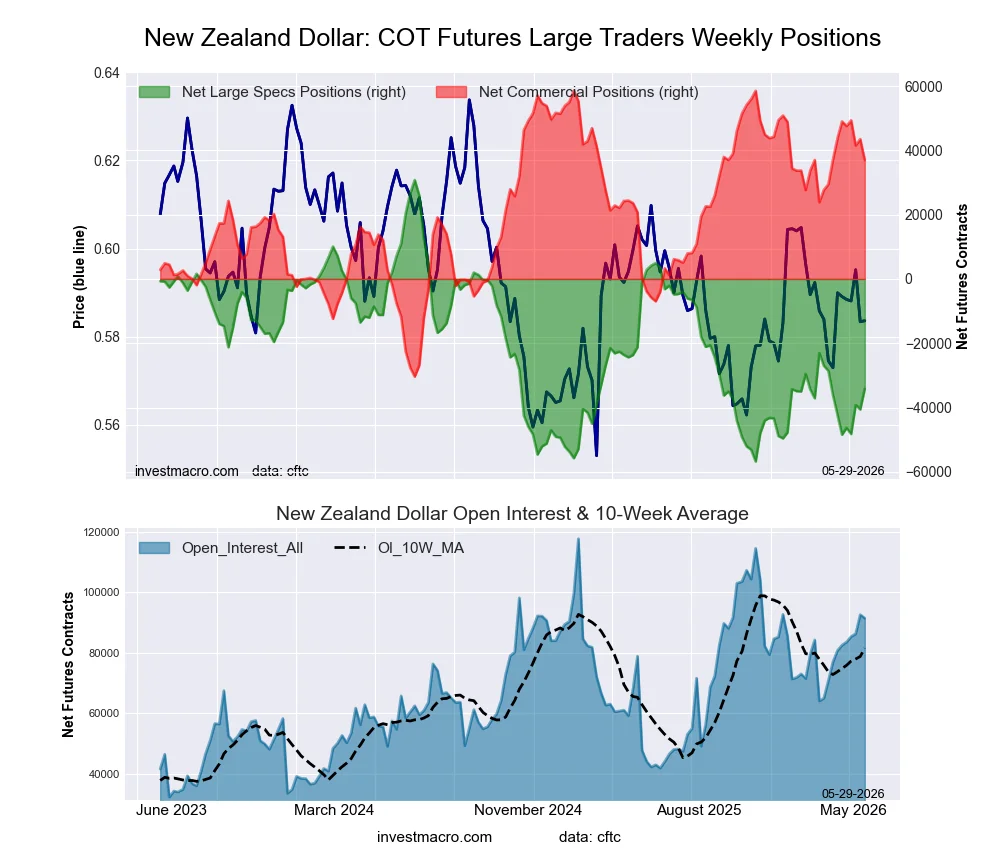
New Zealand Dollar Futures:
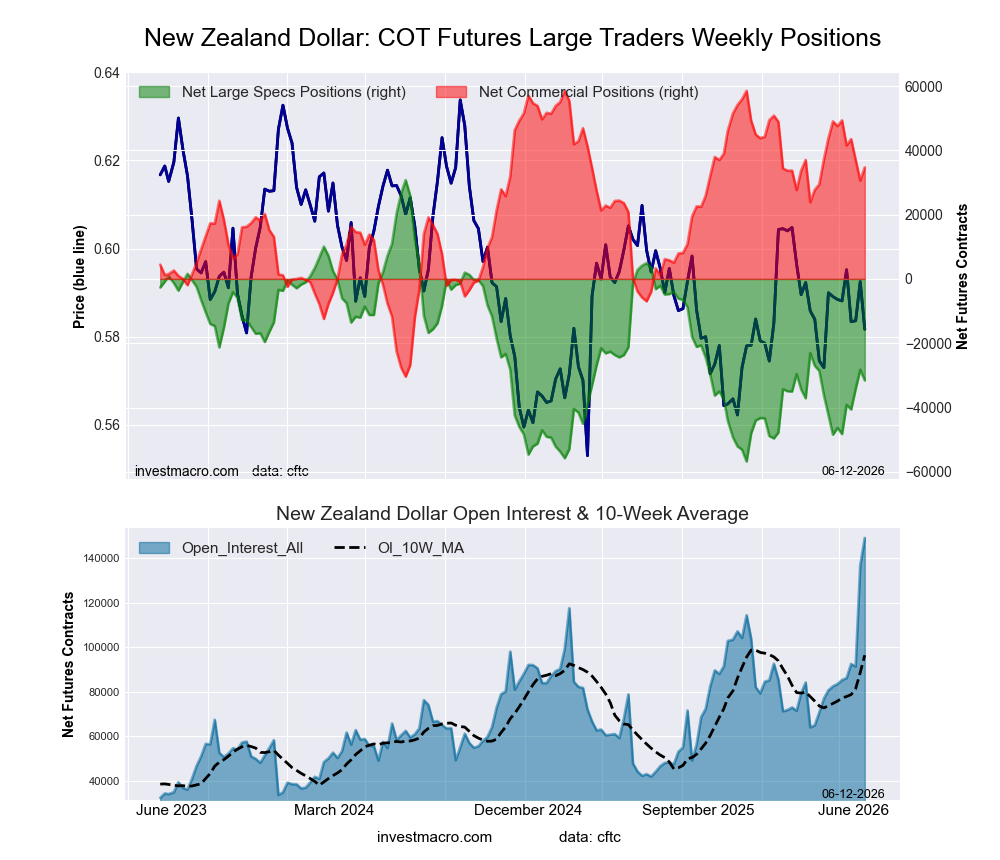 Positioning Notes:
- New Zealand Dollar large speculator standing this week came in at a net position of -31,571 contracts in the data reported through Tuesday.
- Weekly Speculator position fall of -3,325 contracts from the previous week which had a total of -28,246 net contracts.
- This week’s current strength score (range over the past 3 years, measured from 0 to 100) shows the speculators are currently Bearish with a score of 28.8 percent.
- The Commercials are Bullish with a score of 73.1 percent.
- The Small Traders (not shown in chart) are Bearish-Extreme with a score of 9.1 percent.
Price Trend-Following Model: Downtrend
Our weekly trend-following model classifies the current market price position as: Downtrend.
| NEW ZEALAND DOLLAR Statistics | SPECULATORS | COMMERCIALS | SMALL TRADERS |
| – Percent of Open Interest Longs: | 7.9 | 83.4 | 1.9 |
| – Percent of Open Interest Shorts: | 29.0 | 60.2 | 4.0 |
| – Net Position: | -31,571 | 34,705 | -3,134 |
| – Gross Longs: | 11,764 | 124,482 | 2,830 |
| – Gross Shorts: | 43,335 | 89,777 | 5,964 |
| – Long to Short Ratio: | 0.3 to 1 | 1.4 to 1 | 0.5 to 1 |
| NET POSITION TREND: | |||
| – Strength Index Score (3 Year Range Pct): | 28.8 | 73.1 | 9.1 |
| – Strength Index Reading (3 Year Range): | Bearish | Bullish | Bearish-Extreme |
| NET POSITION MOVEMENT INDEX: | |||
| – 6-Week Change in Strength Index: | 16.9 | -14.4 | -25.5 |
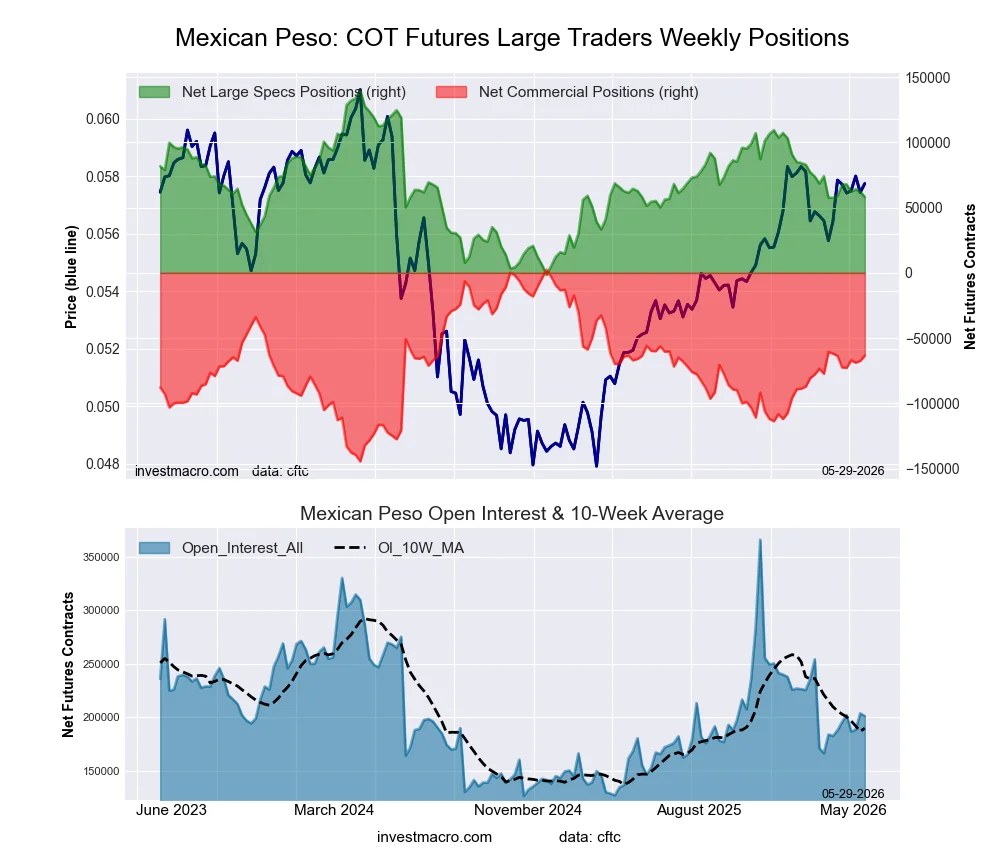
Mexican Peso Futures:
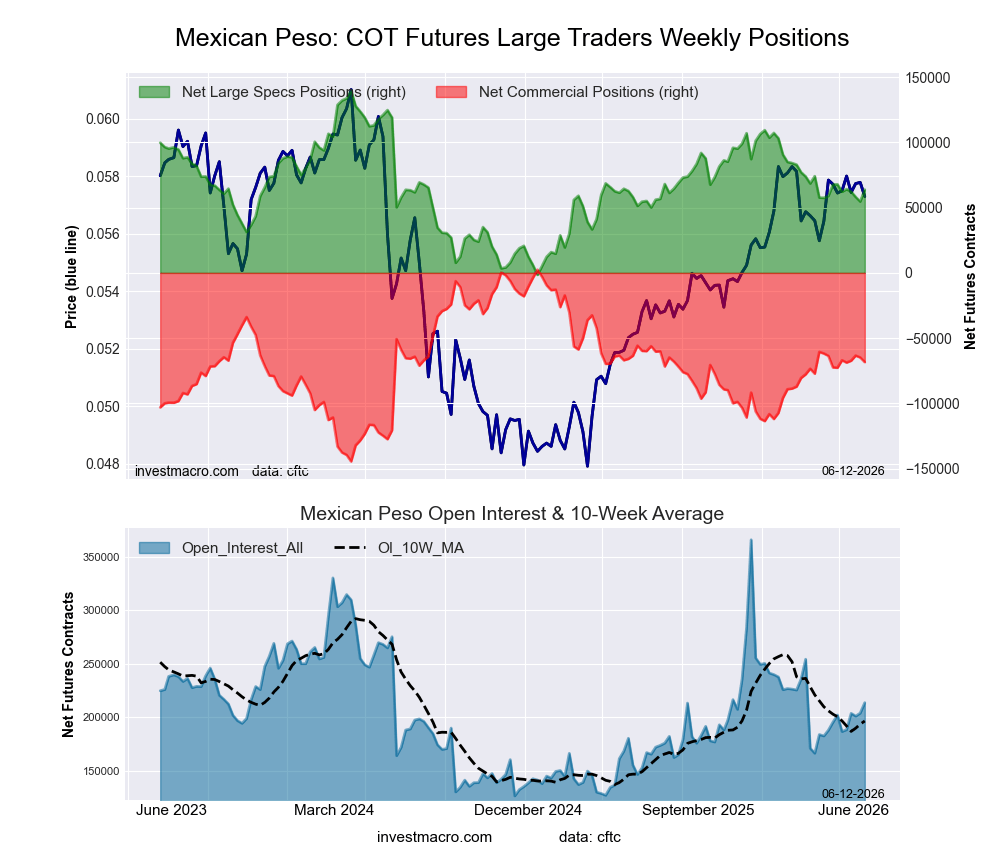 Positioning Notes:
- Mexican Peso large speculator standing this week came in at a net position of 63,801 contracts in the data reported through Tuesday.
- Weekly Speculator position boost of 9,144 contracts from the previous week which had a total of 54,657 net contracts.
- This week’s current strength score (range over the past 3 years, measured from 0 to 100) shows the speculators are currently Bearish with a score of 46.3 percent.
- The Commercials are Bullish with a score of 51.8 percent.
- The Small Traders (not shown in chart) are Bullish with a score of 60.6 percent.
Price Trend-Following Model: Strong Uptrend
Our weekly trend-following model classifies the current market price position as: Strong Uptrend.
| MEXICAN PESO Statistics | SPECULATORS | COMMERCIALS | SMALL TRADERS |
| – Percent of Open Interest Longs: | 46.9 | 45.3 | 3.8 |
| – Percent of Open Interest Shorts: | 17.0 | 77.3 | 1.7 |
| – Net Position: | 63,801 | -68,351 | 4,550 |
| – Gross Longs: | 100,199 | 96,959 | 8,190 |
| – Gross Shorts: | 36,398 | 165,310 | 3,640 |
| – Long to Short Ratio: | 2.8 to 1 | 0.6 to 1 | 2.2 to 1 |
| NET POSITION TREND: | |||
| – Strength Index Score (3 Year Range Pct): | 46.3 | 51.8 | 60.6 |
| – Strength Index Reading (3 Year Range): | Bearish | Bullish | Bullish |
| NET POSITION MOVEMENT INDEX: | |||
| – 6-Week Change in Strength Index: | -2.8 | 3.0 | -2.3 |
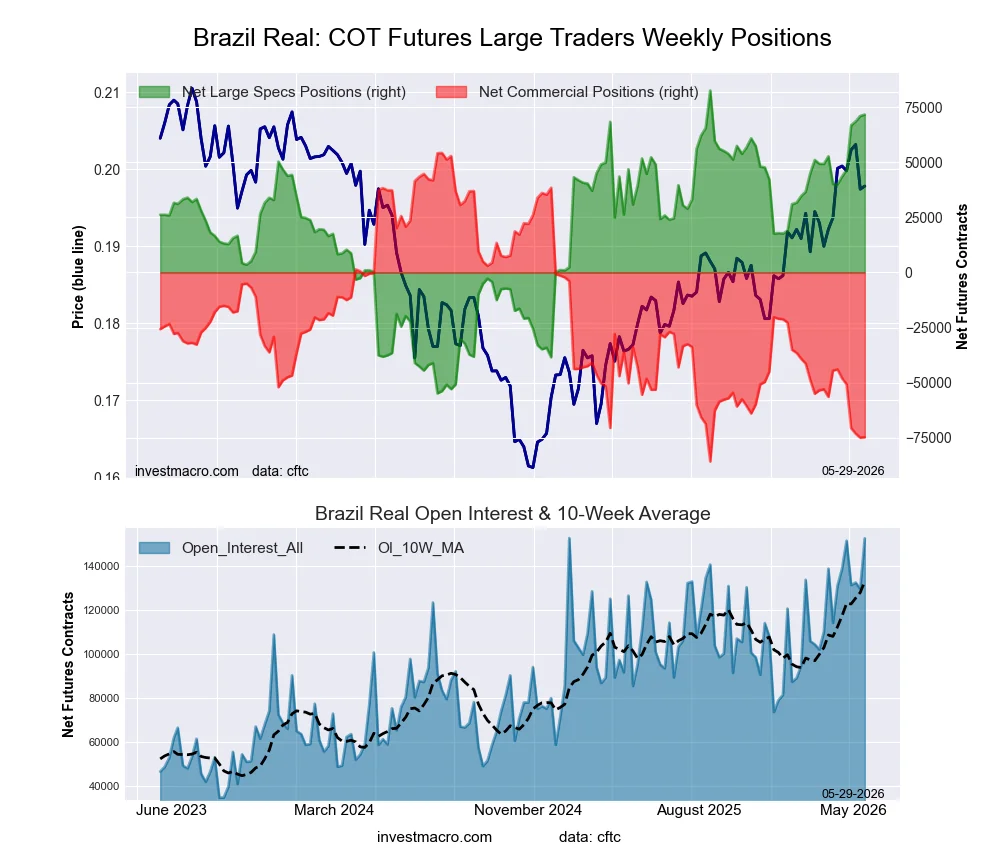
Brazilian Real Futures:
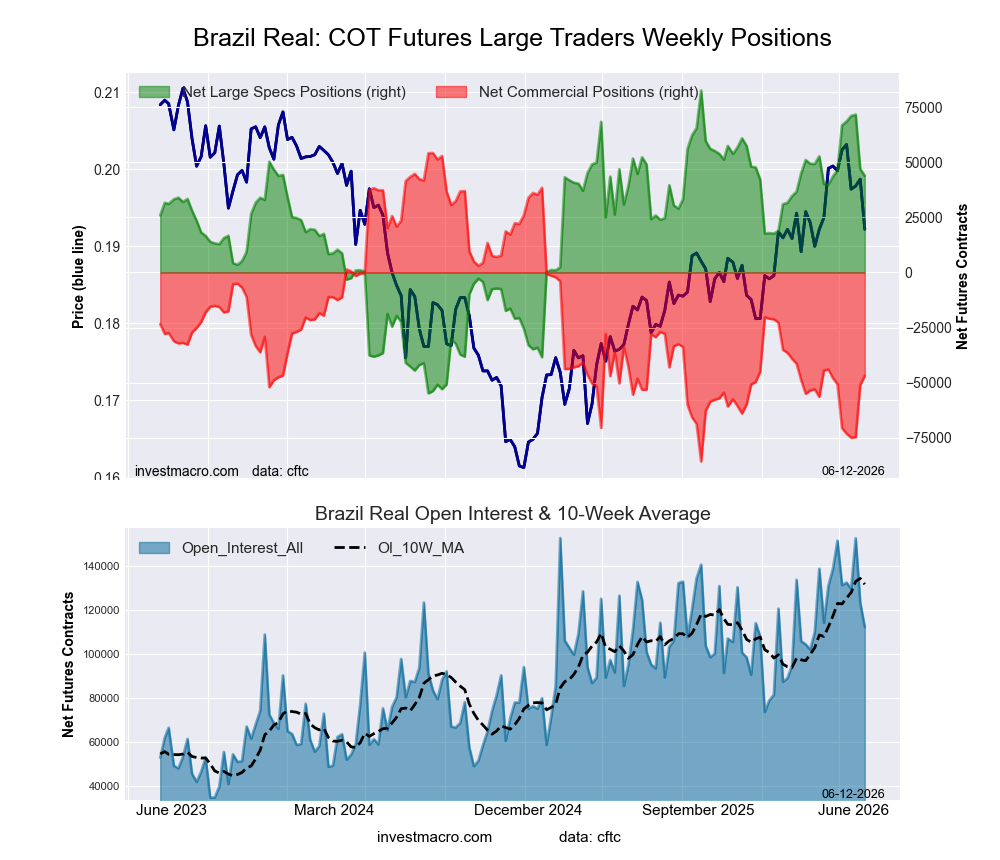 Positioning Notes:
- Brazilian Real large speculator standing this week came in at a net position of 43,846 contracts in the data reported through Tuesday.
- Weekly Speculator position fall of -3,134 contracts from the previous week which had a total of 46,980 net contracts.
- This week’s current strength score (range over the past 3 years, measured from 0 to 100) shows the speculators are currently Bullish with a score of 71.8 percent.
- The Commercials are Bearish with a score of 27.7 percent.
- The Small Traders (not shown in chart) are Bearish with a score of 38.3 percent.
Price Trend-Following Model: Uptrend
Our weekly trend-following model classifies the current market price position as: Uptrend.
| BRAZIL REAL Statistics | SPECULATORS | COMMERCIALS | SMALL TRADERS |
| – Percent of Open Interest Longs: | 73.0 | 22.2 | 4.0 |
| – Percent of Open Interest Shorts: | 33.9 | 64.0 | 1.2 |
| – Net Position: | 43,846 | -46,946 | 3,100 |
| – Gross Longs: | 81,814 | 24,845 | 4,463 |
| – Gross Shorts: | 37,968 | 71,791 | 1,363 |
| – Long to Short Ratio: | 2.2 to 1 | 0.3 to 1 | 3.3 to 1 |
| NET POSITION TREND: | |||
| – Strength Index Score (3 Year Range Pct): | 71.8 | 27.7 | 38.3 |
| – Strength Index Reading (3 Year Range): | Bullish | Bearish | Bearish |
| NET POSITION MOVEMENT INDEX: | |||
| – 6-Week Change in Strength Index: | -1.9 | 2.7 | -7.1 |
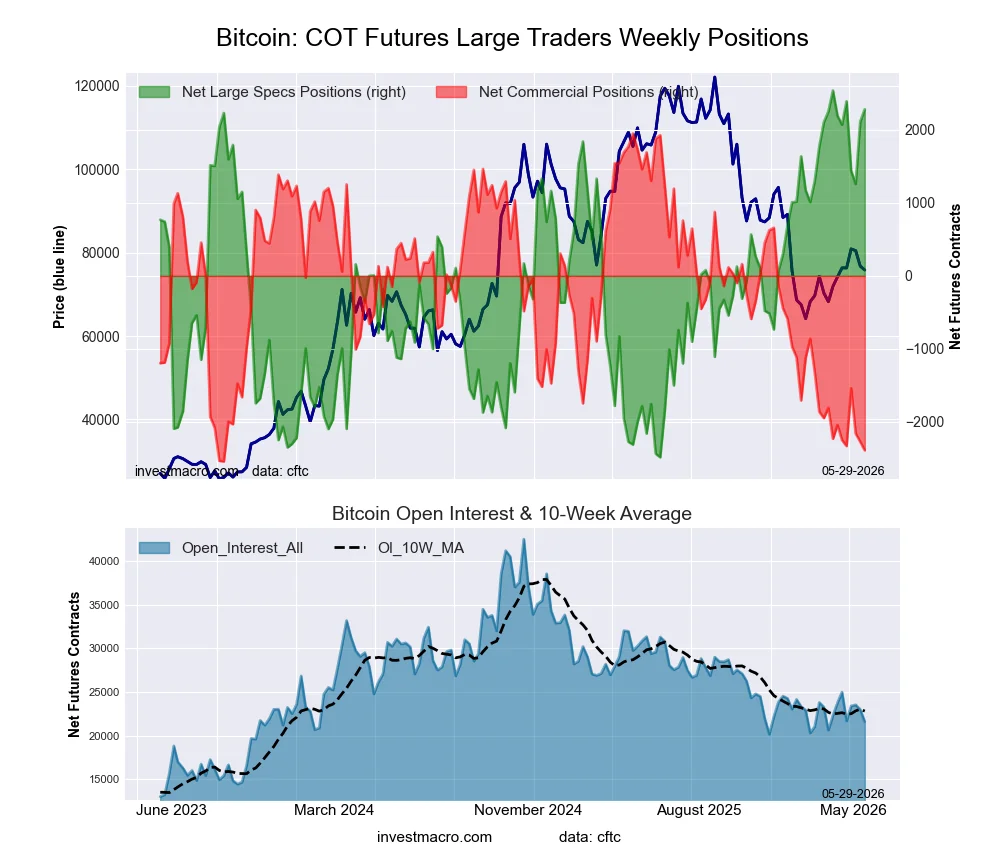
Bitcoin Futures:
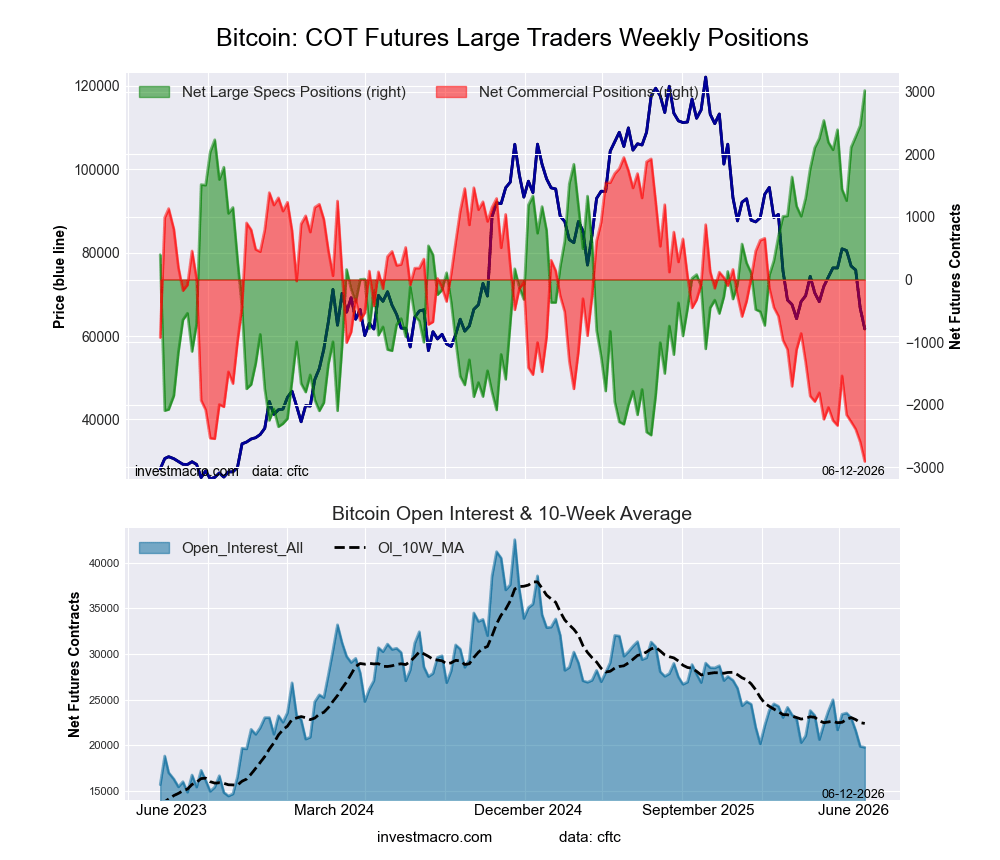 Positioning Notes:
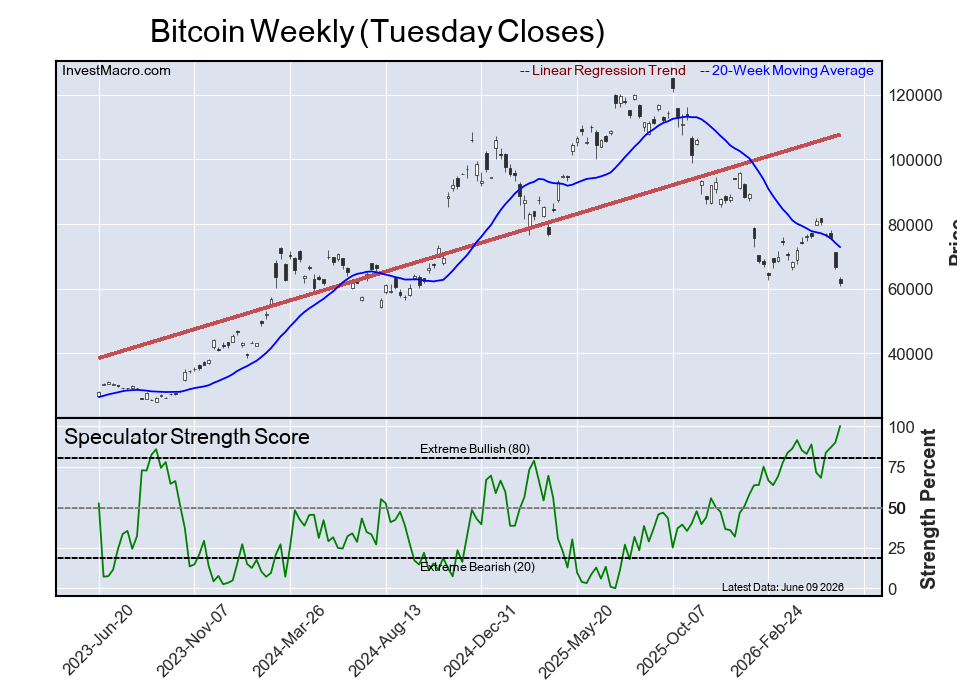
- Bitcoin large speculator standing this week came in at a net position of 3,018 contracts in the data reported through Tuesday.
- Weekly Speculator position rise of 560 contracts from the previous week which had a total of 2,458 net contracts.
- This week’s current strength score (range over the past 3 years, measured from 0 to 100) shows the speculators are currently Bullish-Extreme with a score of 100.0 percent.
- The Commercials are Bearish-Extreme with a score of 0.0 percent.
- The Small Traders (not shown in chart) are Bearish with a score of 31.5 percent.
Price Trend-Following Model: Downtrend
Our weekly trend-following model classifies the current market price position as: Downtrend.
| BITCOIN Statistics | SPECULATORS | COMMERCIALS | SMALL TRADERS |
| – Percent of Open Interest Longs: | 86.9 | 0.5 | 5.1 |
| – Percent of Open Interest Shorts: | 71.6 | 15.2 | 5.7 |
| – Net Position: | 3,018 | -2,906 | -112 |
| – Gross Longs: | 17,178 | 106 | 1,009 |
| – Gross Shorts: | 14,160 | 3,012 | 1,121 |
| – Long to Short Ratio: | 1.2 to 1 | 0.0 to 1 | 0.9 to 1 |
| NET POSITION TREND: | |||
| – Strength Index Score (3 Year Range Pct): | 100.0 | 0.0 | 31.5 |
| – Strength Index Reading (3 Year Range): | Bullish-Extreme | Bearish-Extreme | Bearish |
| NET POSITION MOVEMENT INDEX: | |||
| – 6-Week Change in Strength Index: | 11.4 | -11.8 | -2.7 |
Article By InvestMacro – Receive our weekly COT Reports by Email
*COT Report: The COT data, released weekly to the public each Friday, is updated through the most recent Tuesday (data is 3 days old) and shows a quick view of how large speculators or non-commercials (for-profit traders) were positioned in the futures markets.
The CFTC categorizes trader positions according to commercial hedgers (traders who use futures contracts for hedging as part of the business), non-commercials (large traders who speculate to realize trading profits) and nonreportable traders (usually small traders/speculators) as well as their open interest (contracts open in the market at time of reporting).See CFTC criteria here.
All information and opinions on this website and contained in this article are for general informational purposes only and do not constitute investment advice.