By InvestMacro
Here are the latest charts and statistics for the Commitment of Traders (COT) data published by the Commodities Futures Trading Commission (CFTC).
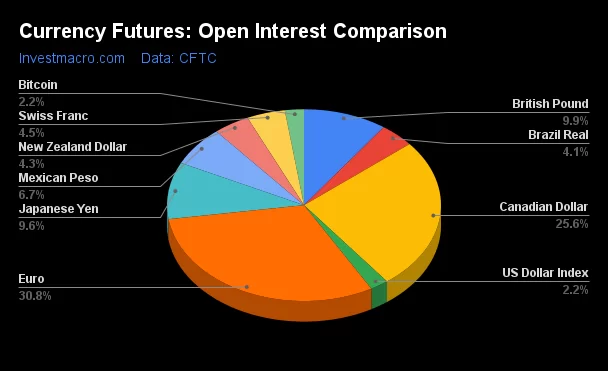
The latest COT data is updated through Tuesday December 17th and shows a quick view of how large market participants (for-profit speculators and commercial traders) were positioned in the futures markets. All currency positions are in direct relation to the US dollar where, for example, a bet for the euro is a bet that the euro will rise versus the dollar while a bet against the euro will be a bet that the euro will decline versus the dollar.
Weekly Speculator Bets led by Swiss Franc & EuroFX
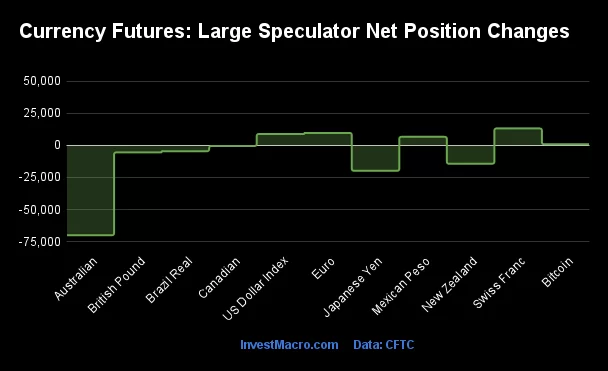
The COT currency market speculator bets were overall lower this week as five out of the eleven currency markets we cover had higher positioning while the other six markets had lower speculator contracts.
Leading the gains for the currency markets was the Swiss Franc (13,192 contracts) with the EuroFX (9,678 contracts), the US Dollar Index (8,865 contracts), the Mexican Peso (6,686 contracts) and Bitcoin (891 contracts) also having positive weeks.
The currencies seeing declines in speculator bets on the week were the Australian Dollar (-70,016 contracts), the Japanese Yen (-19,791 contracts), the New Zealand Dollar (-14,300 contracts), the British Pound (-5,478 contracts), the Brazilian Real (-4,544 contracts) and with the Canadian Dollar (-501 contracts) also recording lower bets on the week.
US Dollar Index Speculator bets rise for 1st time in 7 weeks, AUD bets plunge
Highlighting the COT currency’s data this week is the increase in the speculator’s positioning in the US Dollar Index. The large speculative US Dollar Index positions jumped this week for the first time in the past seven weeks and by the highest weekly amount (+8,865 contracts) since June.
The Dollar Index bets had fallen for seven straight weeks and spec positions were in bearish territory for the past five weeks before this week’s gain. Now, the Dollar Index is back in a bullish standing and at the highest level since September. Speculators had been cutting their bullish bets despite the strong buying action in the markets for the Dollar.
The Dollar Index futures (DX) rose again this week for a third consecutive week and have now been higher in ten out of the past twelve weeks. This week’s high level over 108 is the highest point touched since 2022 and the DX managed to close over the 107.00 level for the first time since November.
Australian dollar bets plunge
The Australian dollar speculator positions fell by the most on record this week with a huge drop by -70,016 contracts. This surpasses the previous most bearish weekly plunge of -56,065 contracts that took place in 2007 around the time of the Great Financial Crisis.
The Australian Dollar exchange versus the US Dollar has been falling sharply with declines in eleven out of the past twelve weeks as well. The AUD exchange level closed at 0.6267 on Friday, marking the lowest close since the fourth quarter of 2022.
The strong Dollar has been laying waste to most of the other major currencies as the Euro, Canadian dollar, Australian dollar, New Zealand dollar, Mexican peso and the Brazilian real are all trading at or near multi-year lows.
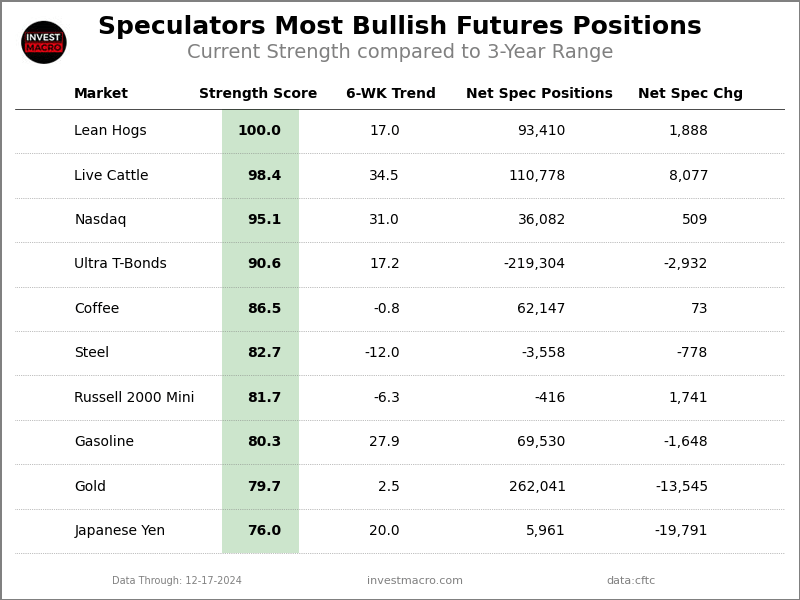
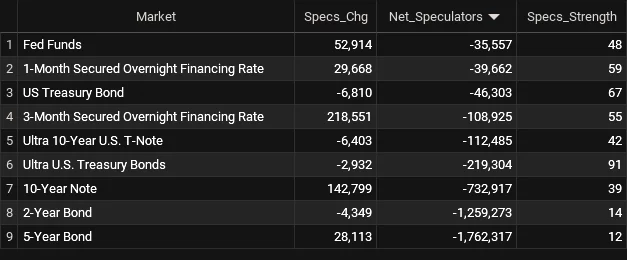
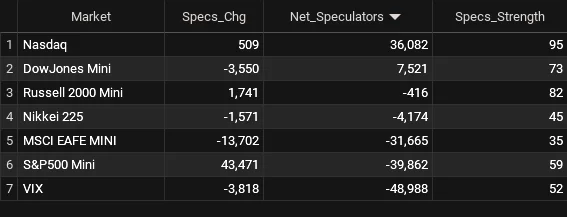
Currencies Net Speculators Leaderboard
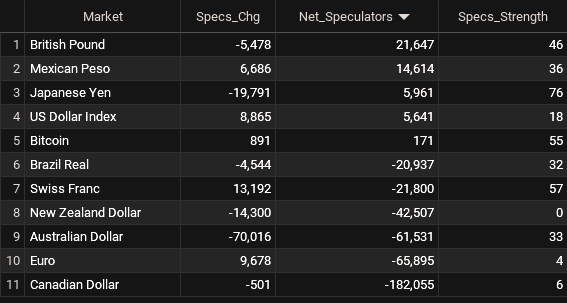
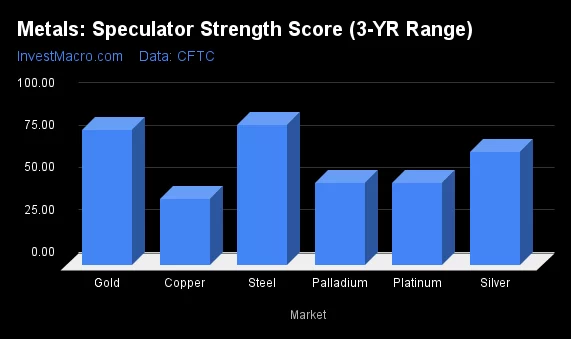
Legend: Weekly Speculators Change | Speculators Current Net Position | Speculators Strength Score compared to last 3-Years (0-100 range)
Strength Scores led by Japanese Yen & Swiss Franc

COT Strength Scores (a normalized measure of Speculator positions over a 3-Year range, from 0 to 100 where above 80 is Extreme-Bullish and below 20 is Extreme-Bearish) showed that the Japanese Yen (76 percent) and the Swiss Franc (57 percent) lead the currency markets this week. Bitcoin (55 percent) comes in as the next highest in the weekly strength scores.
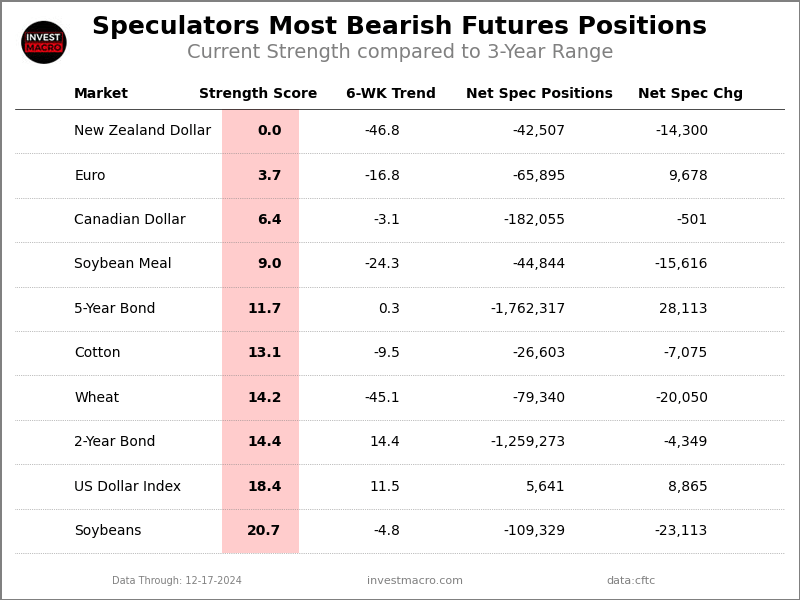
On the downside, the New Zealand Dollar (0 percent), the EuroFX (4 percent), the Canadian Dollar (6 percent) and the US Dollar Index (18 percent) come in at the lowest strength levels currently and are in Extreme-Bearish territory (below 20 percent).
3-Year Strength Statistics:
US Dollar Index (18.4 percent) vs US Dollar Index previous week (0.0 percent)
EuroFX (3.7 percent) vs EuroFX previous week (0.0 percent)
British Pound Sterling (45.8 percent) vs British Pound Sterling previous week (48.3 percent)
Japanese Yen (76.0 percent) vs Japanese Yen previous week (83.9 percent)
Swiss Franc (56.7 percent) vs Swiss Franc previous week (30.0 percent)
Canadian Dollar (6.4 percent) vs Canadian Dollar previous week (6.6 percent)
Australian Dollar (32.6 percent) vs Australian Dollar previous week (82.3 percent)
New Zealand Dollar (0.0 percent) vs New Zealand Dollar previous week (19.5 percent)
Mexican Peso (36.2 percent) vs Mexican Peso previous week (32.8 percent)
Brazilian Real (32.2 percent) vs Brazilian Real previous week (36.5 percent)
Bitcoin (55.0 percent) vs Bitcoin previous week (35.6 percent)
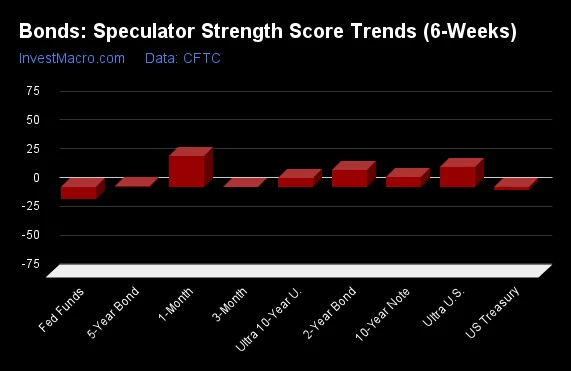
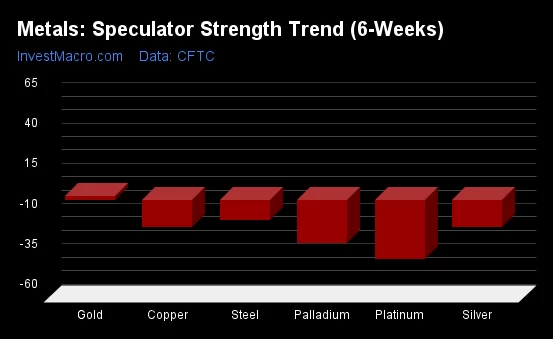
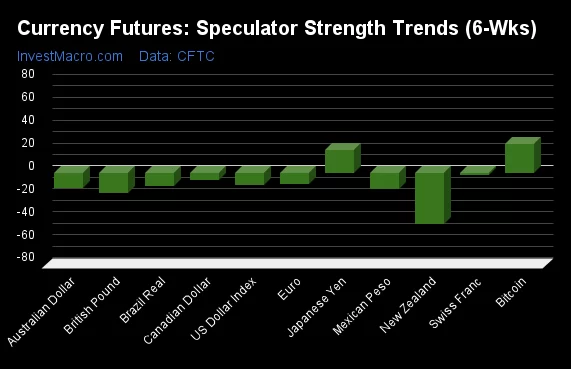
Bitcoin & Japanese Yen top the 6-Week Strength Trends
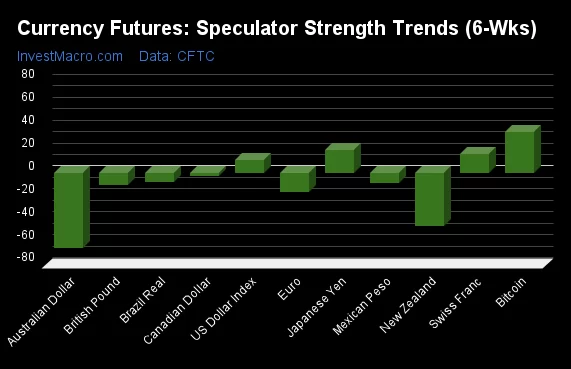
COT Strength Score Trends (or move index, calculates the 6-week changes in strength scores) showed that Bitcoin (36 percent) and the Japanese Yen (20 percent) lead the past six weeks trends for the currencies. The Swiss Franc (17 percent) and the US Dollar Index (11 percent) are the next highest positive movers in the 3-Year trends data.
The Australian Dollar (-66 percent) leads the downside trend scores currently with the New Zealand Dollar (-47 percent), EuroFX (-17 percent) and the British Pound (-11 percent) following next with lower trend scores.
3-Year Strength Trends:
US Dollar Index (11.5 percent) vs US Dollar Index previous week (-10.2 percent)
EuroFX (-16.8 percent) vs EuroFX previous week (-9.6 percent)
British Pound Sterling (-10.5 percent) vs British Pound Sterling previous week (-17.6 percent)
Japanese Yen (20.0 percent) vs Japanese Yen previous week (20.2 percent)
Swiss Franc (16.6 percent) vs Swiss Franc previous week (-2.0 percent)
Canadian Dollar (-3.1 percent) vs Canadian Dollar previous week (-6.3 percent)
Australian Dollar (-65.6 percent) vs Australian Dollar previous week (-13.5 percent)
New Zealand Dollar (-46.8 percent) vs New Zealand Dollar previous week (-35.5 percent)
Mexican Peso (-8.4 percent) vs Mexican Peso previous week (-13.8 percent)
Brazilian Real (-8.0 percent) vs Brazilian Real previous week (-11.5 percent)
Bitcoin (35.5 percent) vs Bitcoin previous week (25.1 percent)
Individual COT Forex Markets:
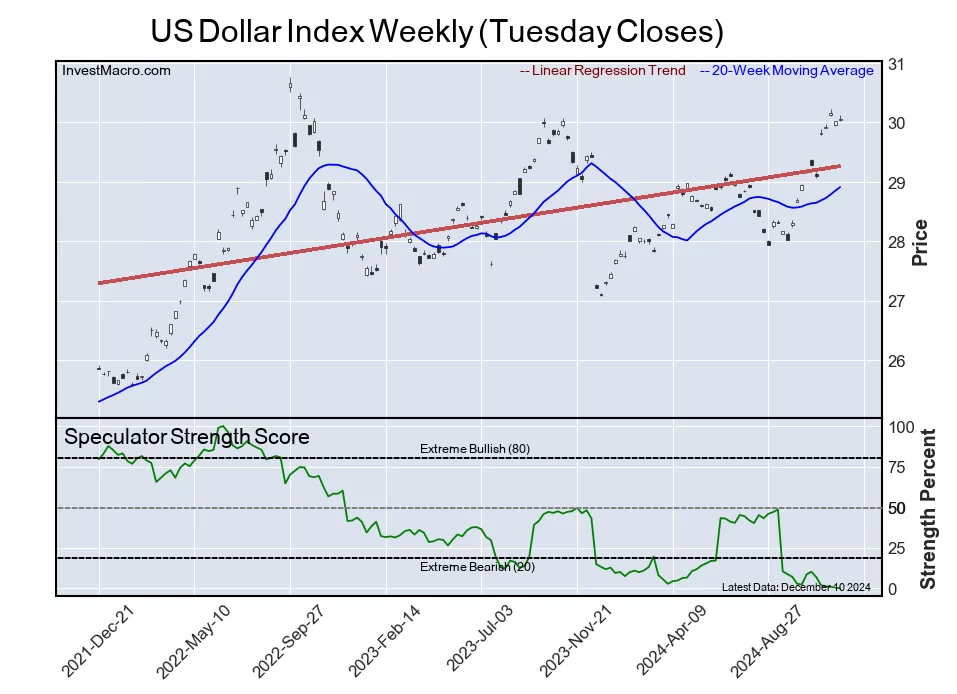
US Dollar Index Futures:
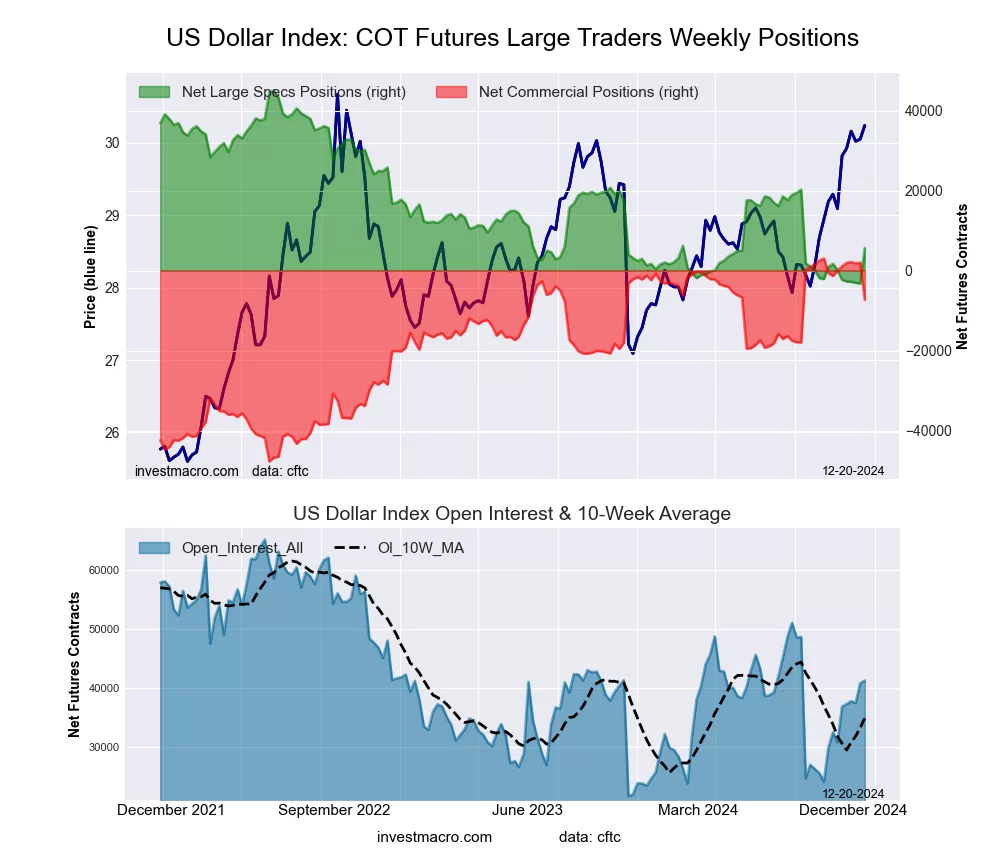 The US Dollar Index large speculator standing this week recorded a net position of 5,641 contracts in the data reported through Tuesday. This was a weekly rise of 8,865 contracts from the previous week which had a total of -3,224 net contracts.
This week’s current strength score (the trader positioning range over the past three years, measured from 0 to 100) shows the speculators are currently Bearish-Extreme with a score of 18.4 percent. The commercials are Bullish with a score of 79.6 percent and the small traders (not shown in chart) are Bearish with a score of 41.3 percent.
Price Trend-Following Model: Strong Uptrend
Our weekly trend-following model classifies the current market price position as: Strong Uptrend.
| US DOLLAR INDEX Statistics | SPECULATORS | COMMERCIALS | SMALL TRADERS |
| – Percent of Open Interest Longs: | 60.9 | 25.1 | 9.1 |
| – Percent of Open Interest Shorts: | 47.2 | 42.9 | 5.0 |
| – Net Position: | 5,641 | -7,349 | 1,708 |
| – Gross Longs: | 25,145 | 10,353 | 3,753 |
| – Gross Shorts: | 19,504 | 17,702 | 2,045 |
| – Long to Short Ratio: | 1.3 to 1 | 0.6 to 1 | 1.8 to 1 |
| NET POSITION TREND: | |||
| – Strength Index Score (3 Year Range Pct): | 18.4 | 79.6 | 41.3 |
| – Strength Index Reading (3 Year Range): | Bearish-Extreme | Bullish | Bearish |
| NET POSITION MOVEMENT INDEX: | |||
| – 6-Week Change in Strength Index: | 11.5 | -14.4 | 18.4 |
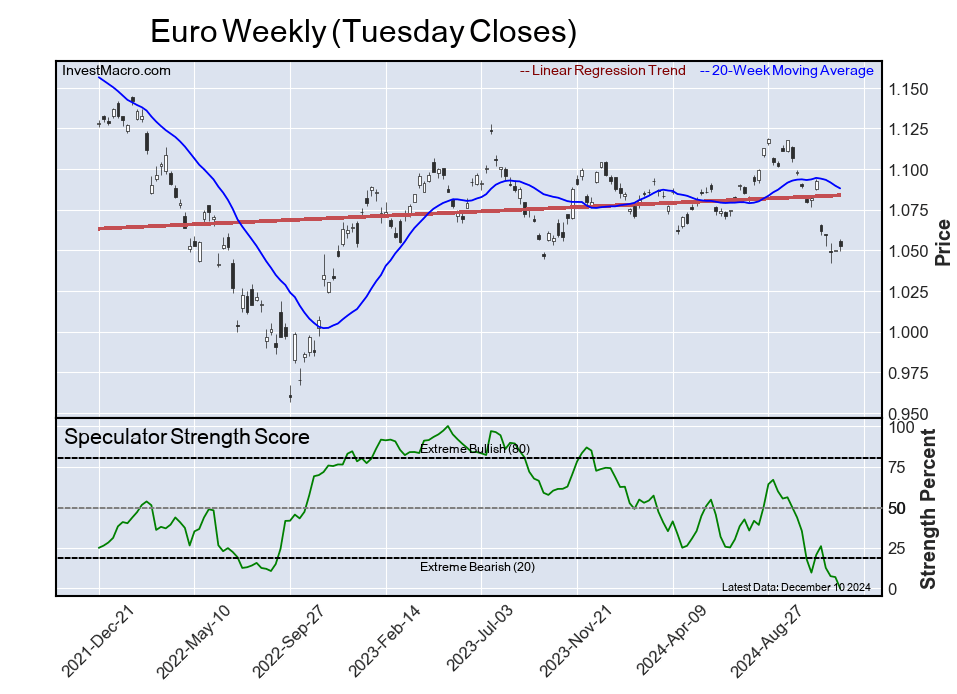
Euro Currency Futures:
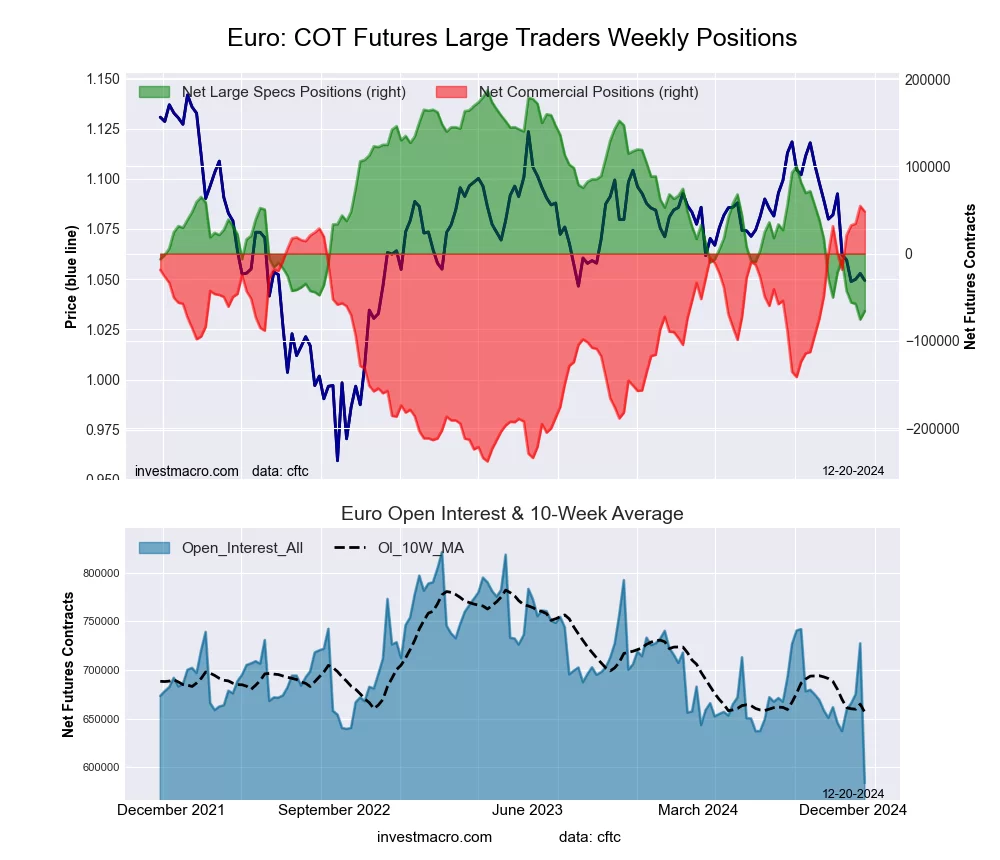 The Euro Currency large speculator standing this week recorded a net position of -65,895 contracts in the data reported through Tuesday. This was a weekly increase of 9,678 contracts from the previous week which had a total of -75,573 net contracts.
This week’s current strength score (the trader positioning range over the past three years, measured from 0 to 100) shows the speculators are currently Bearish-Extreme with a score of 3.7 percent. The commercials are Bullish-Extreme with a score of 97.7 percent and the small traders (not shown in chart) are Bearish-Extreme with a score of 10.6 percent.
Price Trend-Following Model: Strong Downtrend
Our weekly trend-following model classifies the current market price position as: Strong Downtrend.
| EURO Currency Statistics | SPECULATORS | COMMERCIALS | SMALL TRADERS |
| – Percent of Open Interest Longs: | 26.1 | 58.4 | 12.3 |
| – Percent of Open Interest Shorts: | 37.4 | 50.1 | 9.3 |
| – Net Position: | -65,895 | 48,089 | 17,806 |
| – Gross Longs: | 152,671 | 340,837 | 72,006 |
| – Gross Shorts: | 218,566 | 292,748 | 54,200 |
| – Long to Short Ratio: | 0.7 to 1 | 1.2 to 1 | 1.3 to 1 |
| NET POSITION TREND: | |||
| – Strength Index Score (3 Year Range Pct): | 3.7 | 97.7 | 10.6 |
| – Strength Index Reading (3 Year Range): | Bearish-Extreme | Bullish-Extreme | Bearish-Extreme |
| NET POSITION MOVEMENT INDEX: | |||
| – 6-Week Change in Strength Index: | -16.8 | 16.2 | -7.4 |
British Pound Sterling Futures:
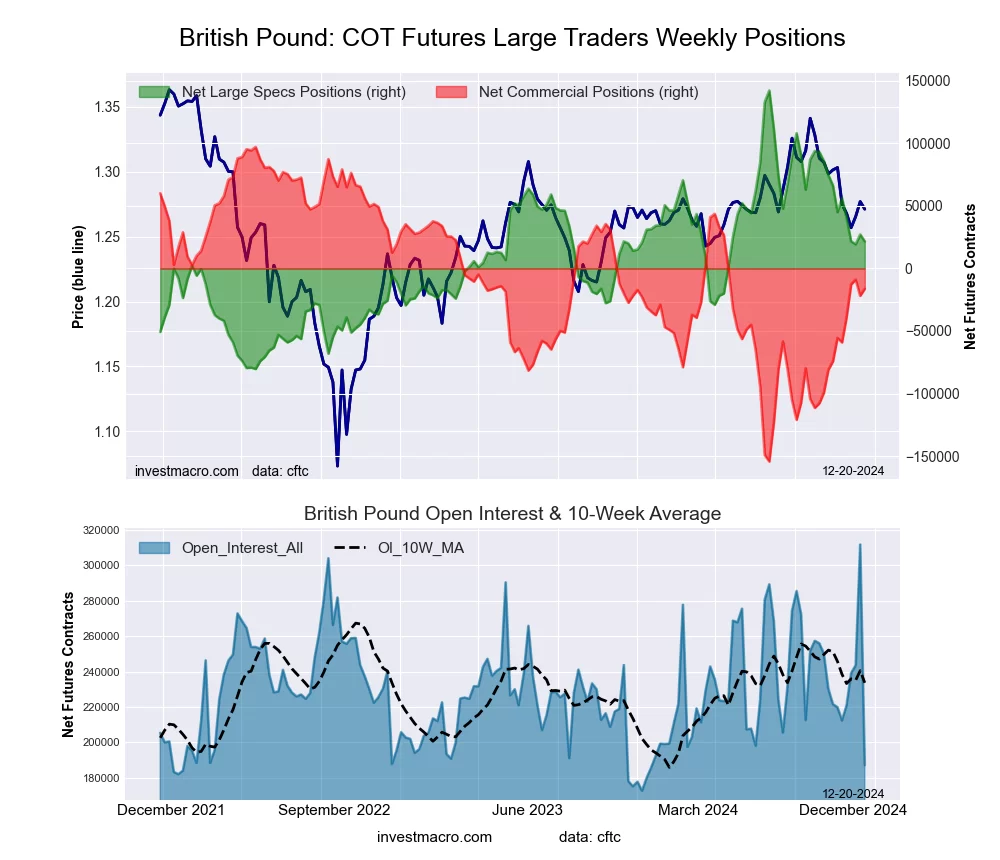 The British Pound Sterling large speculator standing this week recorded a net position of 21,647 contracts in the data reported through Tuesday. This was a weekly reduction of -5,478 contracts from the previous week which had a total of 27,125 net contracts.
This week’s current strength score (the trader positioning range over the past three years, measured from 0 to 100) shows the speculators are currently Bearish with a score of 45.8 percent. The commercials are Bullish with a score of 54.9 percent and the small traders (not shown in chart) are Bullish with a score of 50.9 percent.
Price Trend-Following Model: Strong Downtrend
Our weekly trend-following model classifies the current market price position as: Strong Downtrend.
| BRITISH POUND Statistics | SPECULATORS | COMMERCIALS | SMALL TRADERS |
| – Percent of Open Interest Longs: | 47.2 | 38.3 | 13.3 |
| – Percent of Open Interest Shorts: | 35.6 | 47.0 | 16.2 |
| – Net Position: | 21,647 | -16,258 | -5,389 |
| – Gross Longs: | 88,265 | 71,728 | 24,964 |
| – Gross Shorts: | 66,618 | 87,986 | 30,353 |
| – Long to Short Ratio: | 1.3 to 1 | 0.8 to 1 | 0.8 to 1 |
| NET POSITION TREND: | |||
| – Strength Index Score (3 Year Range Pct): | 45.8 | 54.9 | 50.9 |
| – Strength Index Reading (3 Year Range): | Bearish | Bullish | Bullish |
| NET POSITION MOVEMENT INDEX: | |||
| – 6-Week Change in Strength Index: | -10.5 | 15.6 | -33.4 |
Japanese Yen Futures:
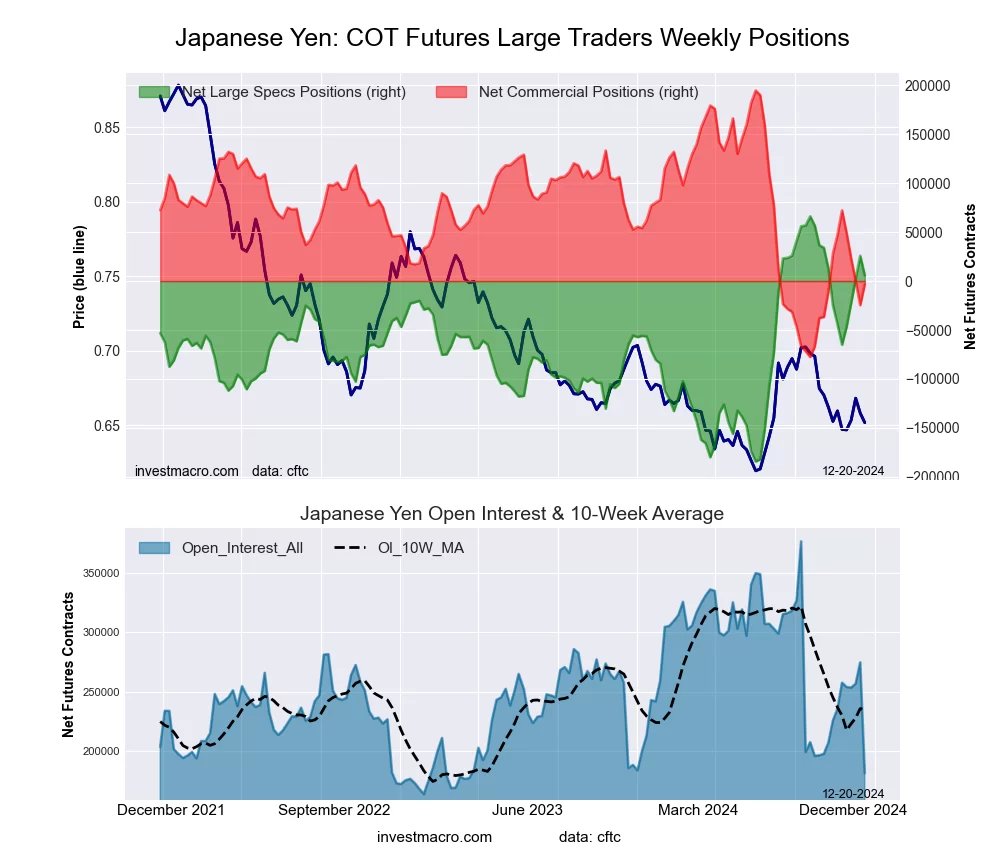 The Japanese Yen large speculator standing this week recorded a net position of 5,961 contracts in the data reported through Tuesday. This was a weekly decline of -19,791 contracts from the previous week which had a total of 25,752 net contracts.
This week’s current strength score (the trader positioning range over the past three years, measured from 0 to 100) shows the speculators are currently Bullish with a score of 76.0 percent. The commercials are Bearish with a score of 27.4 percent and the small traders (not shown in chart) are Bullish with a score of 56.8 percent.
Price Trend-Following Model: Strong Downtrend
Our weekly trend-following model classifies the current market price position as: Strong Downtrend.
| JAPANESE YEN Statistics | SPECULATORS | COMMERCIALS | SMALL TRADERS |
| – Percent of Open Interest Longs: | 48.0 | 31.4 | 19.1 |
| – Percent of Open Interest Shorts: | 44.7 | 33.1 | 20.7 |
| – Net Position: | 5,961 | -3,101 | -2,860 |
| – Gross Longs: | 87,208 | 57,107 | 34,688 |
| – Gross Shorts: | 81,247 | 60,208 | 37,548 |
| – Long to Short Ratio: | 1.1 to 1 | 0.9 to 1 | 0.9 to 1 |
| NET POSITION TREND: | |||
| – Strength Index Score (3 Year Range Pct): | 76.0 | 27.4 | 56.8 |
| – Strength Index Reading (3 Year Range): | Bullish | Bearish | Bullish |
| NET POSITION MOVEMENT INDEX: | |||
| – 6-Week Change in Strength Index: | 20.0 | -18.5 | 0.6 |
Swiss Franc Futures:
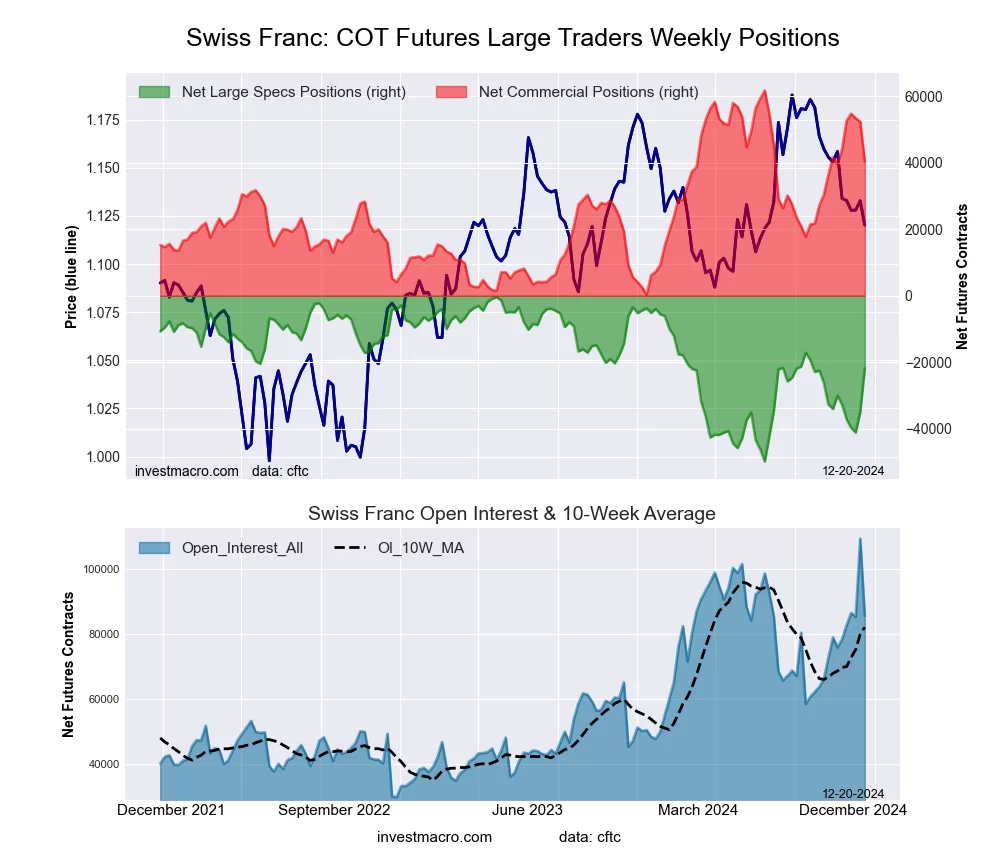 The Swiss Franc large speculator standing this week recorded a net position of -21,800 contracts in the data reported through Tuesday. This was a weekly advance of 13,192 contracts from the previous week which had a total of -34,992 net contracts.
This week’s current strength score (the trader positioning range over the past three years, measured from 0 to 100) shows the speculators are currently Bullish with a score of 56.7 percent. The commercials are Bullish with a score of 65.3 percent and the small traders (not shown in chart) are Bearish-Extreme with a score of 0.0 percent.
Price Trend-Following Model: Strong Downtrend
Our weekly trend-following model classifies the current market price position as: Strong Downtrend.
| SWISS FRANC Statistics | SPECULATORS | COMMERCIALS | SMALL TRADERS |
| – Percent of Open Interest Longs: | 19.7 | 71.7 | 8.0 |
| – Percent of Open Interest Shorts: | 45.2 | 24.6 | 29.7 |
| – Net Position: | -21,800 | 40,379 | -18,579 |
| – Gross Longs: | 16,872 | 61,407 | 6,853 |
| – Gross Shorts: | 38,672 | 21,028 | 25,432 |
| – Long to Short Ratio: | 0.4 to 1 | 2.9 to 1 | 0.3 to 1 |
| NET POSITION TREND: | |||
| – Strength Index Score (3 Year Range Pct): | 56.7 | 65.3 | 0.0 |
| – Strength Index Reading (3 Year Range): | Bullish | Bullish | Bearish-Extreme |
| NET POSITION MOVEMENT INDEX: | |||
| – 6-Week Change in Strength Index: | 16.6 | 1.4 | -38.3 |
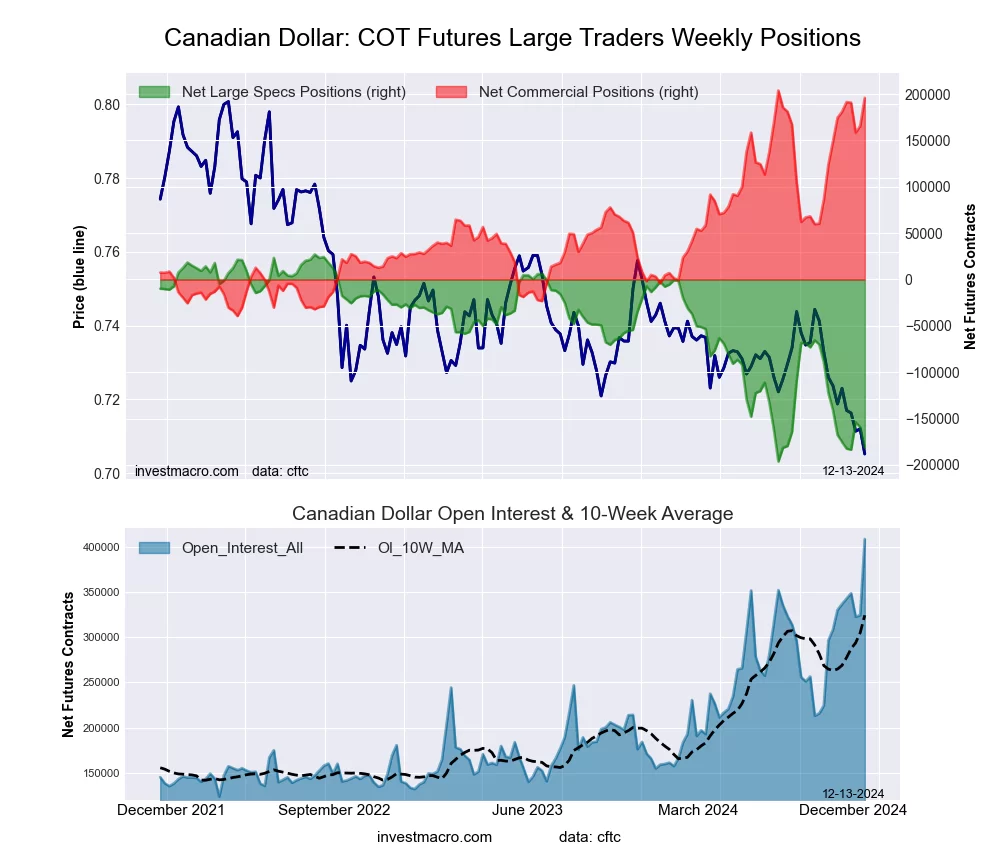
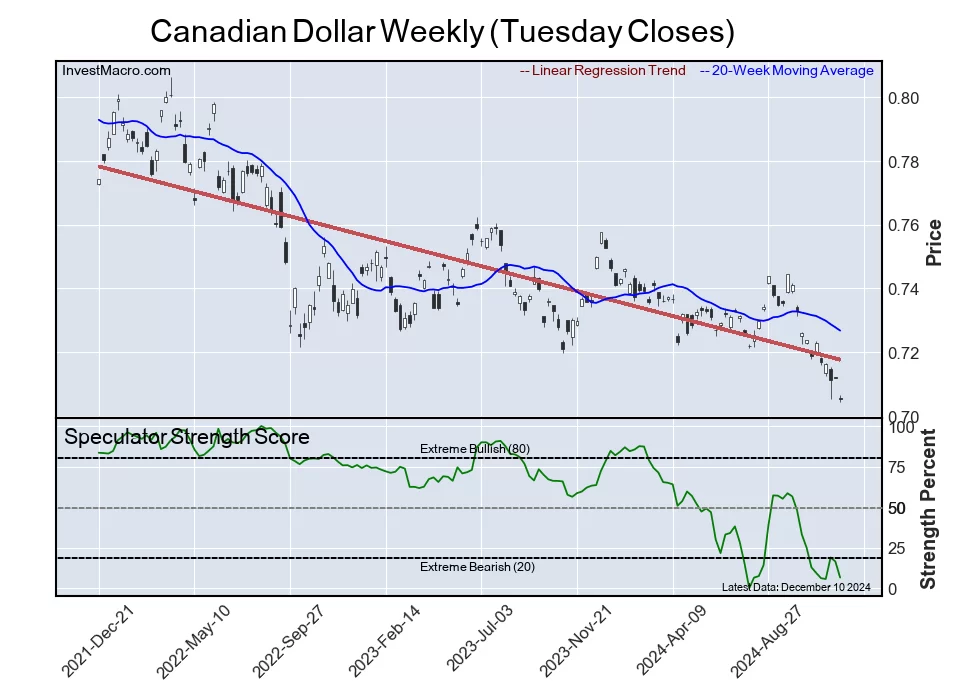
Canadian Dollar Futures:
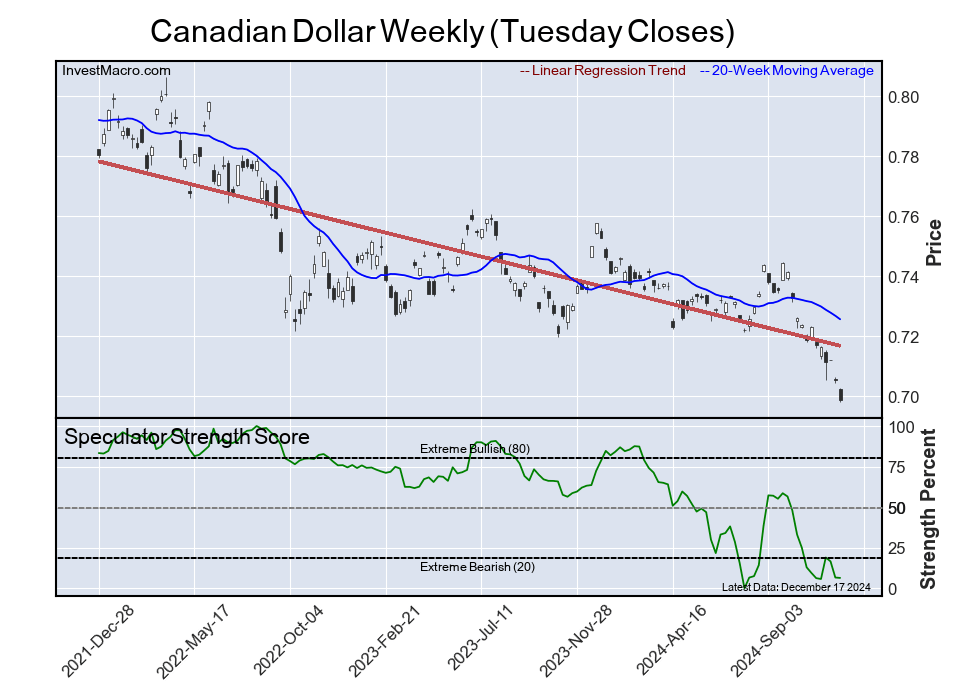
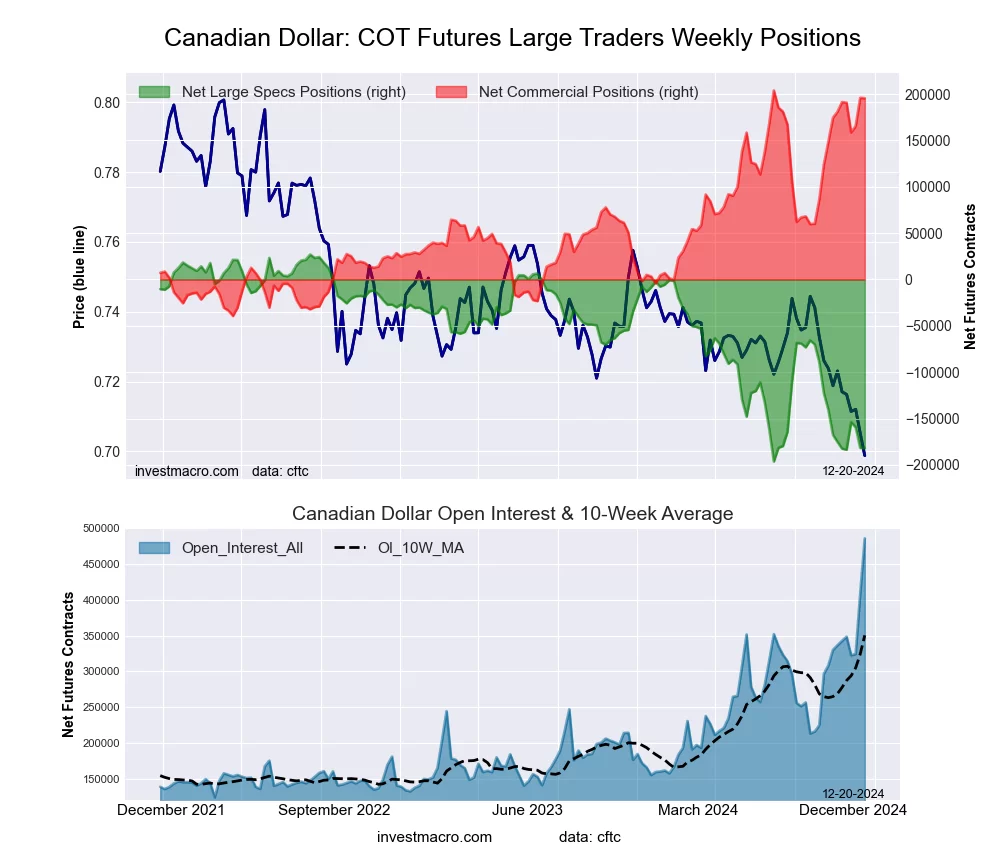 The Canadian Dollar large speculator standing this week recorded a net position of -182,055 contracts in the data reported through Tuesday. This was a weekly reduction of -501 contracts from the previous week which had a total of -181,554 net contracts.
This week’s current strength score (the trader positioning range over the past three years, measured from 0 to 100) shows the speculators are currently Bearish-Extreme with a score of 6.4 percent. The commercials are Bullish-Extreme with a score of 96.6 percent and the small traders (not shown in chart) are Bearish-Extreme with a score of 2.6 percent.
Price Trend-Following Model: Strong Downtrend
Our weekly trend-following model classifies the current market price position as: Strong Downtrend.
| CANADIAN DOLLAR Statistics | SPECULATORS | COMMERCIALS | SMALL TRADERS |
| – Percent of Open Interest Longs: | 3.9 | 88.8 | 5.9 |
| – Percent of Open Interest Shorts: | 41.4 | 48.5 | 8.7 |
| – Net Position: | -182,055 | 195,457 | -13,402 |
| – Gross Longs: | 19,170 | 430,972 | 28,710 |
| – Gross Shorts: | 201,225 | 235,515 | 42,112 |
| – Long to Short Ratio: | 0.1 to 1 | 1.8 to 1 | 0.7 to 1 |
| NET POSITION TREND: | |||
| – Strength Index Score (3 Year Range Pct): | 6.4 | 96.6 | 2.6 |
| – Strength Index Reading (3 Year Range): | Bearish-Extreme | Bullish-Extreme | Bearish-Extreme |
| NET POSITION MOVEMENT INDEX: | |||
| – 6-Week Change in Strength Index: | -3.1 | 6.0 | -20.4 |
Australian Dollar Futures:
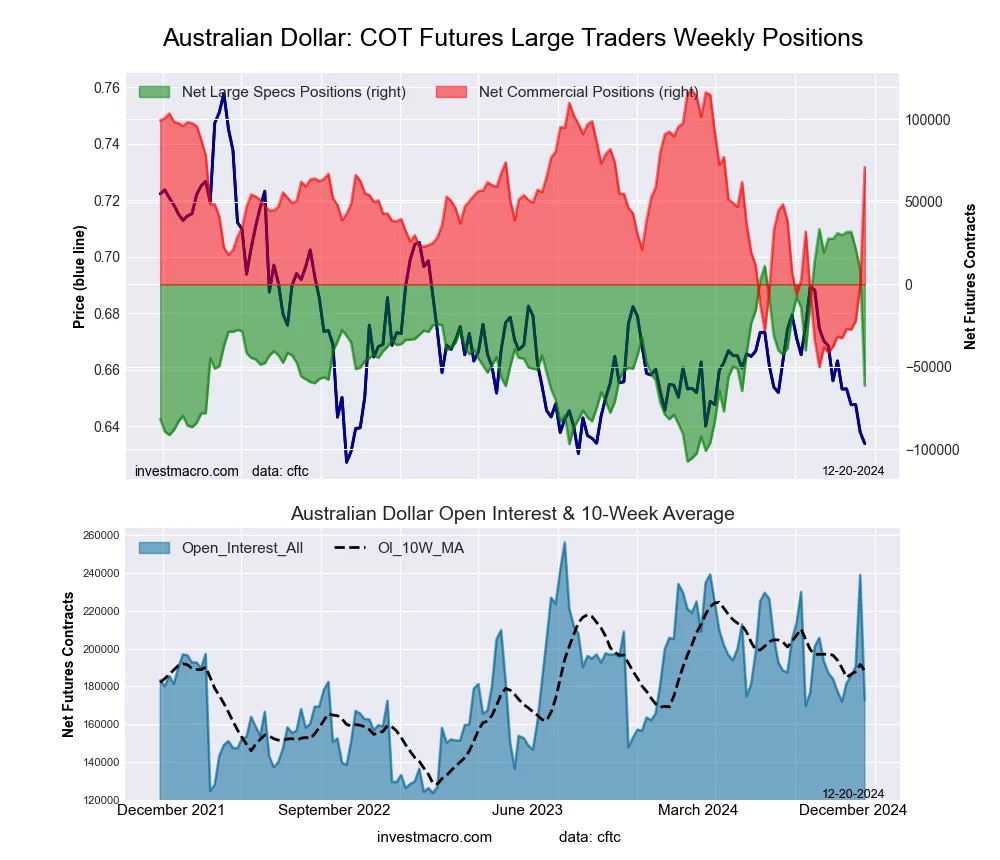 The Australian Dollar large speculator standing this week recorded a net position of -61,531 contracts in the data reported through Tuesday. This was a weekly decrease of -70,016 contracts from the previous week which had a total of 8,485 net contracts.
This week’s current strength score (the trader positioning range over the past three years, measured from 0 to 100) shows the speculators are currently Bearish with a score of 32.6 percent. The commercials are Bullish with a score of 72.3 percent and the small traders (not shown in chart) are Bearish with a score of 23.9 percent.
Price Trend-Following Model: Strong Downtrend
Our weekly trend-following model classifies the current market price position as: Strong Downtrend.
| AUSTRALIAN DOLLAR Statistics | SPECULATORS | COMMERCIALS | SMALL TRADERS |
| – Percent of Open Interest Longs: | 19.1 | 64.4 | 12.7 |
| – Percent of Open Interest Shorts: | 54.7 | 23.3 | 18.3 |
| – Net Position: | -61,531 | 71,099 | -9,568 |
| – Gross Longs: | 32,929 | 111,276 | 21,997 |
| – Gross Shorts: | 94,460 | 40,177 | 31,565 |
| – Long to Short Ratio: | 0.3 to 1 | 2.8 to 1 | 0.7 to 1 |
| NET POSITION TREND: | |||
| – Strength Index Score (3 Year Range Pct): | 32.6 | 72.3 | 23.9 |
| – Strength Index Reading (3 Year Range): | Bearish | Bullish | Bearish |
| NET POSITION MOVEMENT INDEX: | |||
| – 6-Week Change in Strength Index: | -65.6 | 61.3 | -27.3 |
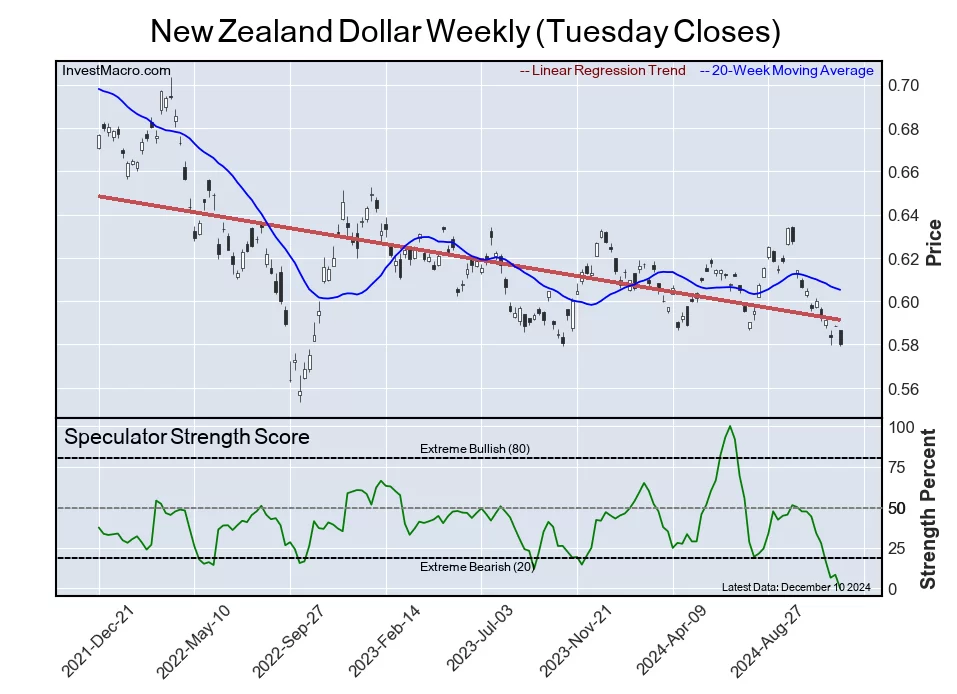
New Zealand Dollar Futures:
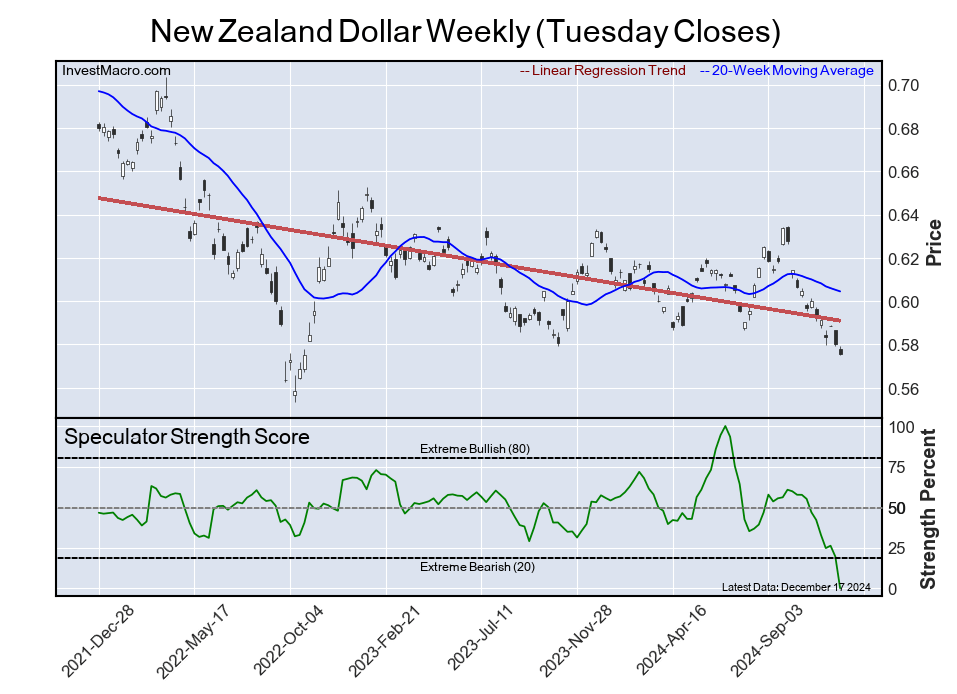
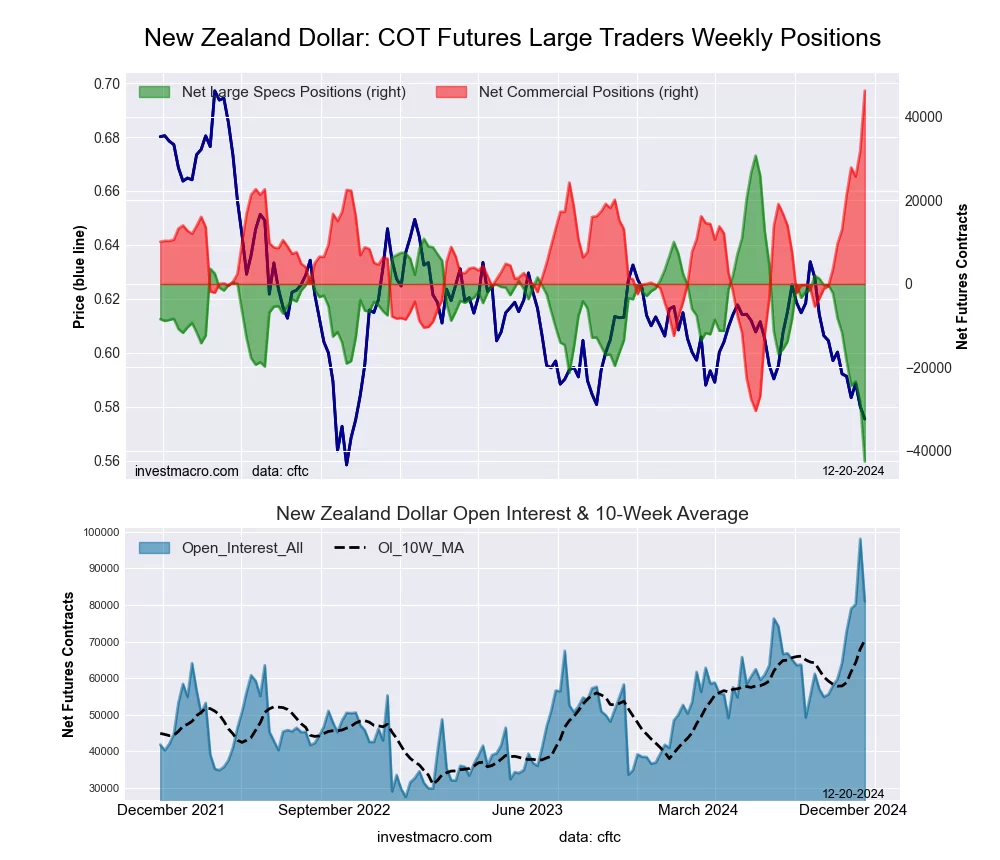 The New Zealand Dollar large speculator standing this week recorded a net position of -42,507 contracts in the data reported through Tuesday. This was a weekly reduction of -14,300 contracts from the previous week which had a total of -28,207 net contracts.
This week’s current strength score (the trader positioning range over the past three years, measured from 0 to 100) shows the speculators are currently Bearish-Extreme with a score of 0.0 percent. The commercials are Bullish-Extreme with a score of 100.0 percent and the small traders (not shown in chart) are Bearish-Extreme with a score of 4.9 percent.
Price Trend-Following Model: Strong Downtrend
Our weekly trend-following model classifies the current market price position as: Strong Downtrend.
| NEW ZEALAND DOLLAR Statistics | SPECULATORS | COMMERCIALS | SMALL TRADERS |
| – Percent of Open Interest Longs: | 11.6 | 84.1 | 3.7 |
| – Percent of Open Interest Shorts: | 64.0 | 26.9 | 8.4 |
| – Net Position: | -42,507 | 46,323 | -3,816 |
| – Gross Longs: | 9,370 | 68,108 | 2,967 |
| – Gross Shorts: | 51,877 | 21,785 | 6,783 |
| – Long to Short Ratio: | 0.2 to 1 | 3.1 to 1 | 0.4 to 1 |
| NET POSITION TREND: | |||
| – Strength Index Score (3 Year Range Pct): | 0.0 | 100.0 | 4.9 |
| – Strength Index Reading (3 Year Range): | Bearish-Extreme | Bullish-Extreme | Bearish-Extreme |
| NET POSITION MOVEMENT INDEX: | |||
| – 6-Week Change in Strength Index: | -46.8 | 47.8 | -30.5 |
Mexican Peso Futures:
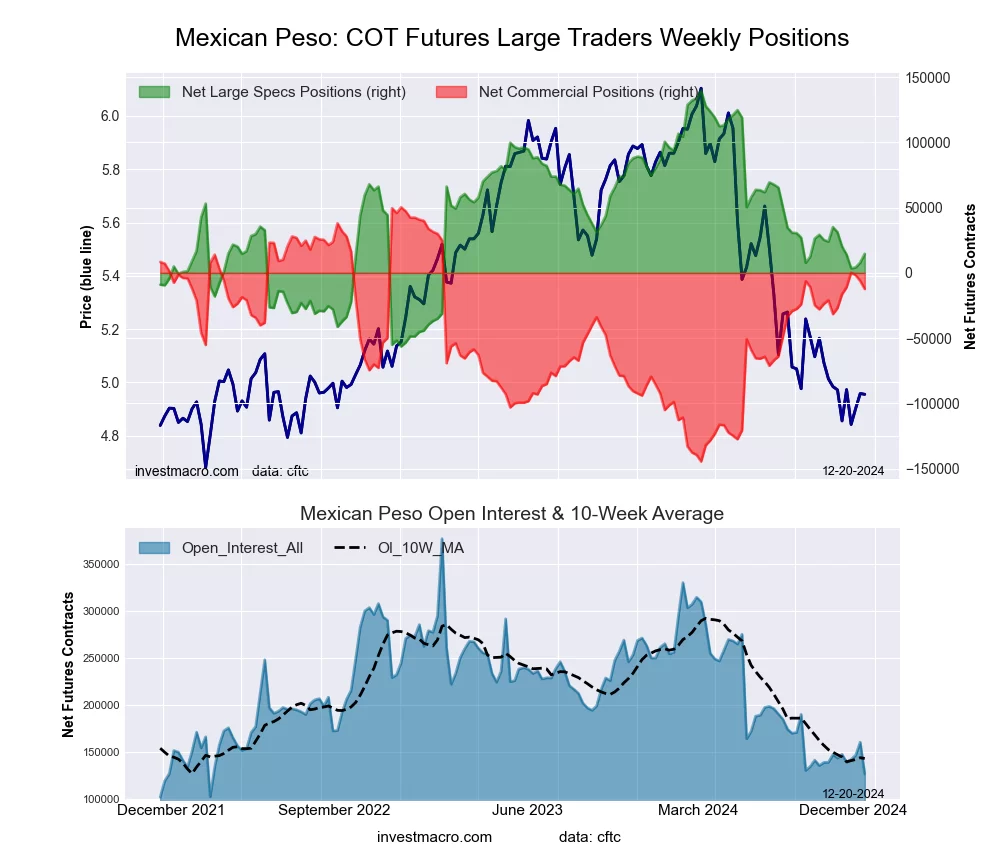 The Mexican Peso large speculator standing this week recorded a net position of 14,614 contracts in the data reported through Tuesday. This was a weekly rise of 6,686 contracts from the previous week which had a total of 7,928 net contracts.
This week’s current strength score (the trader positioning range over the past three years, measured from 0 to 100) shows the speculators are currently Bearish with a score of 36.2 percent. The commercials are Bullish with a score of 67.9 percent and the small traders (not shown in chart) are Bearish-Extreme with a score of 10.1 percent.
Price Trend-Following Model: Downtrend
Our weekly trend-following model classifies the current market price position as: Downtrend.
| MEXICAN PESO Statistics | SPECULATORS | COMMERCIALS | SMALL TRADERS |
| – Percent of Open Interest Longs: | 43.8 | 50.3 | 2.9 |
| – Percent of Open Interest Shorts: | 32.2 | 60.1 | 4.7 |
| – Net Position: | 14,614 | -12,332 | -2,282 |
| – Gross Longs: | 55,529 | 63,901 | 3,680 |
| – Gross Shorts: | 40,915 | 76,233 | 5,962 |
| – Long to Short Ratio: | 1.4 to 1 | 0.8 to 1 | 0.6 to 1 |
| NET POSITION TREND: | |||
| – Strength Index Score (3 Year Range Pct): | 36.2 | 67.9 | 10.1 |
| – Strength Index Reading (3 Year Range): | Bearish | Bullish | Bearish-Extreme |
| NET POSITION MOVEMENT INDEX: | |||
| – 6-Week Change in Strength Index: | -8.4 | 7.5 | 10.1 |
Brazilian Real Futures:
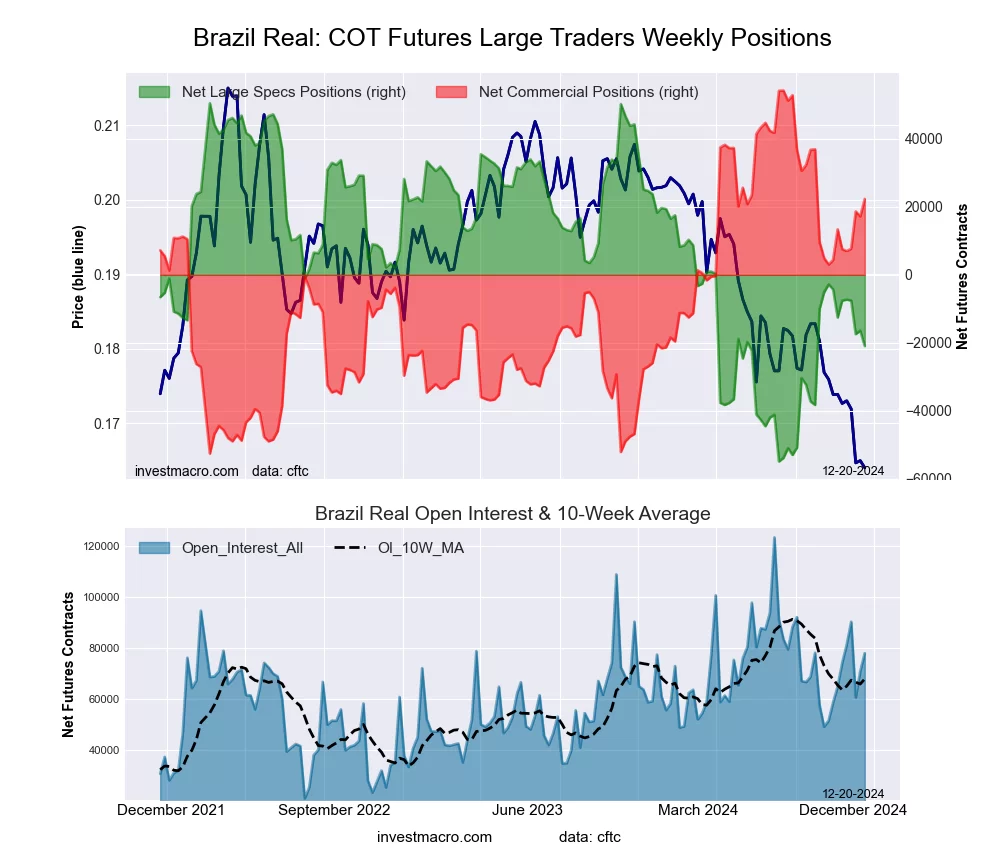 The Brazilian Real large speculator standing this week recorded a net position of -20,937 contracts in the data reported through Tuesday. This was a weekly decrease of -4,544 contracts from the previous week which had a total of -16,393 net contracts.
This week’s current strength score (the trader positioning range over the past three years, measured from 0 to 100) shows the speculators are currently Bearish with a score of 32.2 percent. The commercials are Bullish with a score of 70.1 percent and the small traders (not shown in chart) are Bearish-Extreme with a score of 13.1 percent.
Price Trend-Following Model: Strong Downtrend
Our weekly trend-following model classifies the current market price position as: Strong Downtrend.
| BRAZIL REAL Statistics | SPECULATORS | COMMERCIALS | SMALL TRADERS |
| – Percent of Open Interest Longs: | 41.0 | 55.6 | 2.7 |
| – Percent of Open Interest Shorts: | 67.8 | 26.9 | 4.5 |
| – Net Position: | -20,937 | 22,320 | -1,383 |
| – Gross Longs: | 31,931 | 43,312 | 2,103 |
| – Gross Shorts: | 52,868 | 20,992 | 3,486 |
| – Long to Short Ratio: | 0.6 to 1 | 2.1 to 1 | 0.6 to 1 |
| NET POSITION TREND: | |||
| – Strength Index Score (3 Year Range Pct): | 32.2 | 70.1 | 13.1 |
| – Strength Index Reading (3 Year Range): | Bearish | Bullish | Bearish-Extreme |
| NET POSITION MOVEMENT INDEX: | |||
| – 6-Week Change in Strength Index: | -8.0 | 8.4 | -3.0 |
Bitcoin Futures:
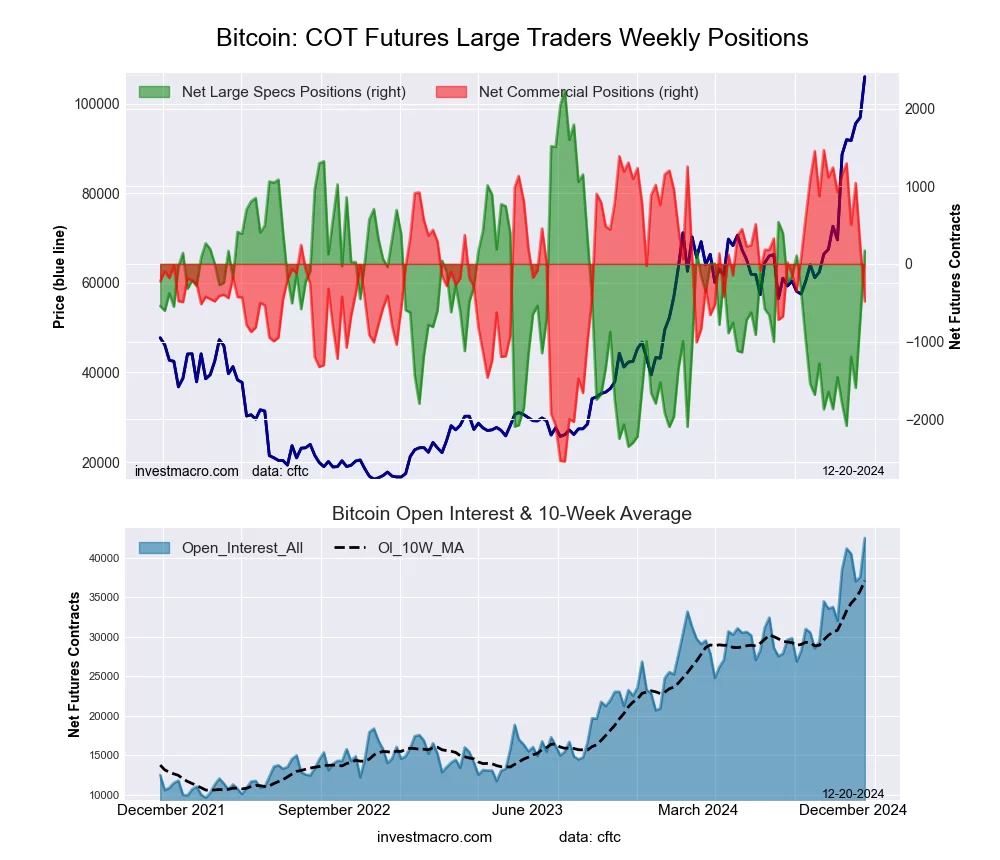 The Bitcoin large speculator standing this week recorded a net position of 171 contracts in the data reported through Tuesday. This was a weekly boost of 891 contracts from the previous week which had a total of -720 net contracts.
This week’s current strength score (the trader positioning range over the past three years, measured from 0 to 100) shows the speculators are currently Bullish with a score of 55.0 percent. The commercials are Bullish with a score of 51.4 percent and the small traders (not shown in chart) are Bearish with a score of 33.4 percent.
Price Trend-Following Model: Uptrend
Our weekly trend-following model classifies the current market price position as: Uptrend.
| BITCOIN Statistics | SPECULATORS | COMMERCIALS | SMALL TRADERS |
| – Percent of Open Interest Longs: | 77.8 | 4.0 | 3.9 |
| – Percent of Open Interest Shorts: | 77.4 | 5.2 | 3.1 |
| – Net Position: | 171 | -483 | 312 |
| – Gross Longs: | 33,073 | 1,720 | 1,639 |
| – Gross Shorts: | 32,902 | 2,203 | 1,327 |
| – Long to Short Ratio: | 1.0 to 1 | 0.8 to 1 | 1.2 to 1 |
| NET POSITION TREND: | |||
| – Strength Index Score (3 Year Range Pct): | 55.0 | 51.4 | 33.4 |
| – Strength Index Reading (3 Year Range): | Bullish | Bullish | Bearish |
| NET POSITION MOVEMENT INDEX: | |||
| – 6-Week Change in Strength Index: | 35.5 | -35.2 | -16.2 |
Article By InvestMacro – Receive our weekly COT Newsletter
*COT Report: The COT data, released weekly to the public each Friday, is updated through the most recent Tuesday (data is 3 days old) and shows a quick view of how large speculators or non-commercials (for-profit traders) were positioned in the futures markets.
The CFTC categorizes trader positions according to commercial hedgers (traders who use futures contracts for hedging as part of the business), non-commercials (large traders who speculate to realize trading profits) and nonreportable traders (usually small traders/speculators) as well as their open interest (contracts open in the market at time of reporting). See CFTC criteria here.