By InvestMacro
Here are the latest charts and statistics for the Commitment of Traders (COT) reports data published by the Commodities Futures Trading Commission (CFTC).
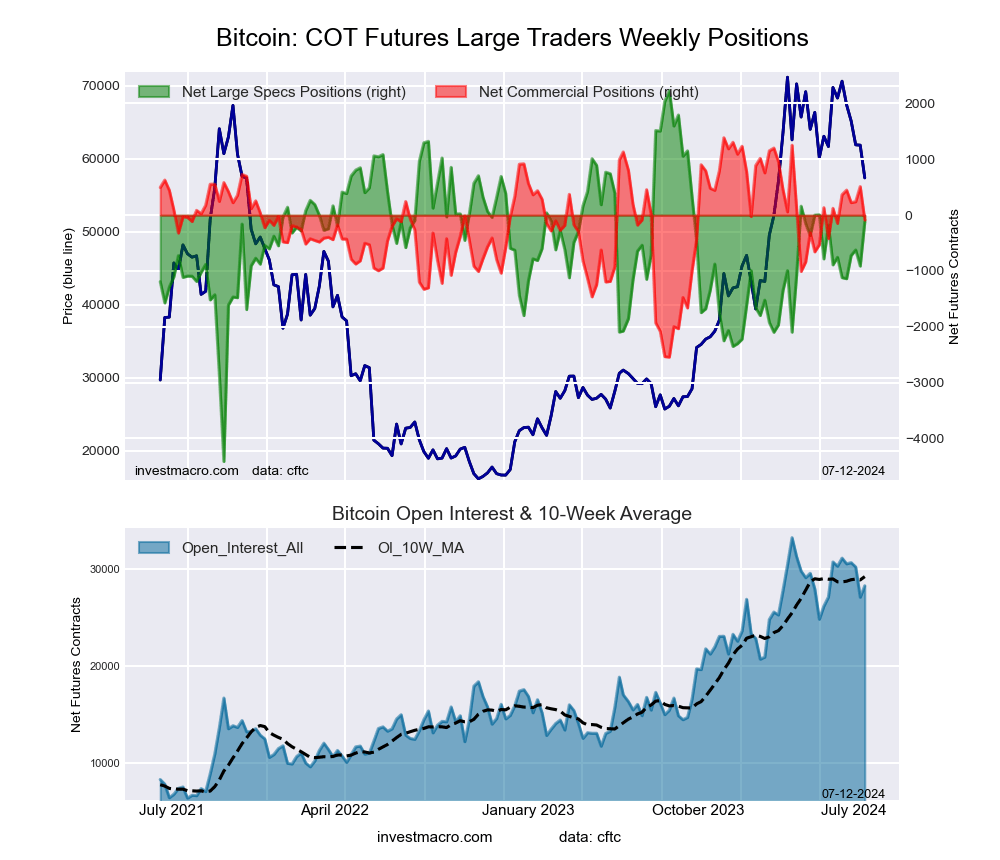
The latest COT data is updated through Tuesday August 6th and shows a quick view of how large traders (for-profit speculators and commercial entities) were positioned in the futures markets.
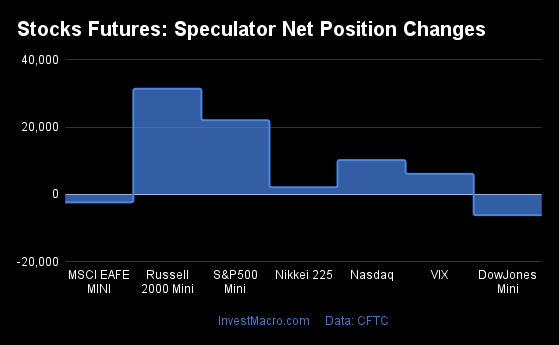
Weekly Speculator Changes led by Corn & Soybeans
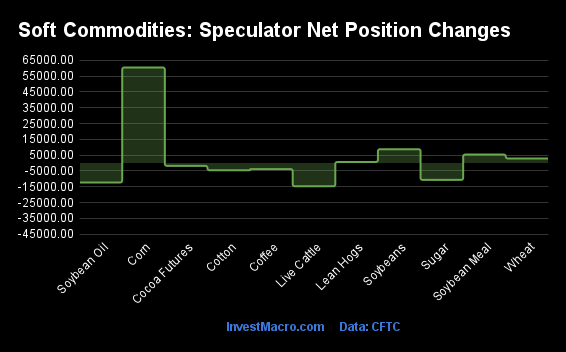
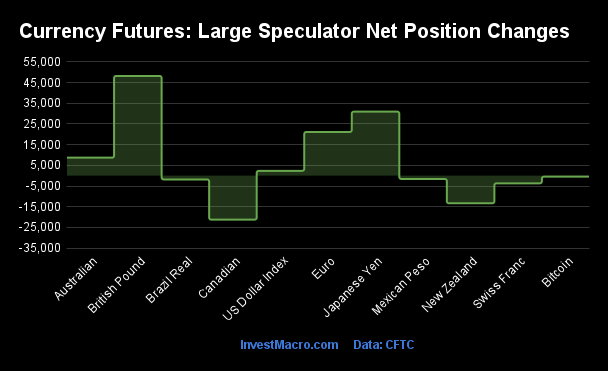
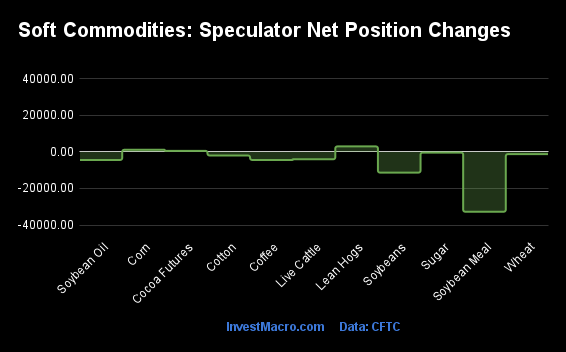
The COT soft commodities markets speculator bets were slightly lower this week as five out of the eleven softs markets we cover had higher positioning while the other six markets had lower speculator contracts.
Leading the gains for the softs markets was Corn (60,473 contracts) with Soybeans (8,772 contracts), Soybean Meal (5,397 contracts), Wheat (2,873 contracts) and Lean Hogs (705 contracts) also showing positive weeks.
The markets with the declines in speculator bets this week were Live Cattle (-14,702 contracts), Soybean Oil (-12,288 contracts), Sugar (-10,664 contracts), Cotton (-4,567 contracts), Coffee (-3,809 contracts) and with Cocoa (-1,773 contracts) also registering lower bets on the week.
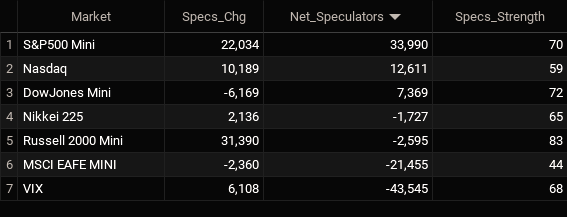
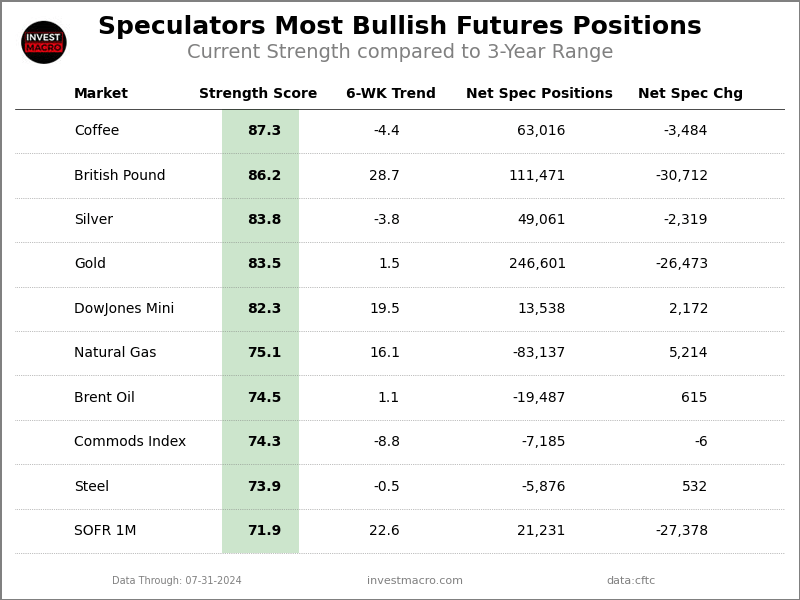
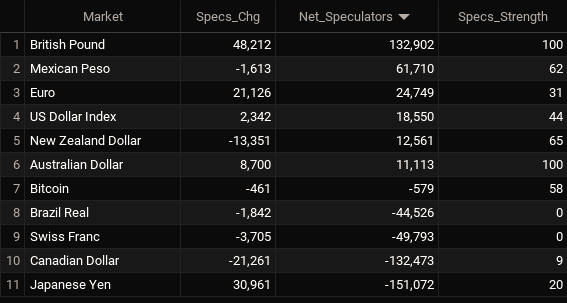
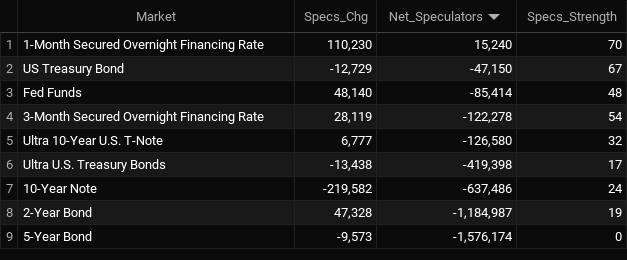
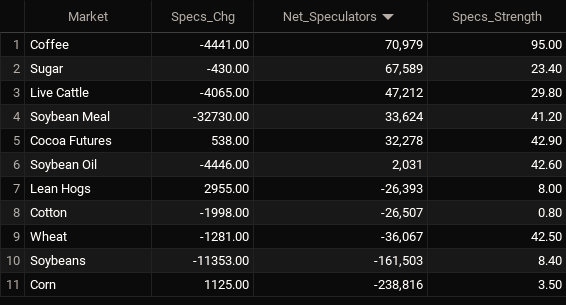
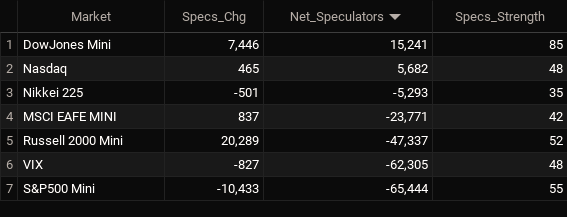
Soft Commodities Net Speculators Leaderboard
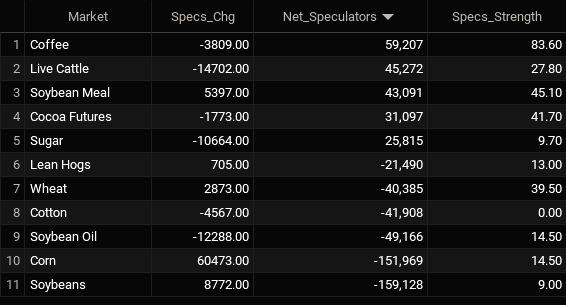
Legend: Weekly Speculators Change | Speculators Current Net Position | Speculators Strength Score compared to last 3-Years (0-100 range)
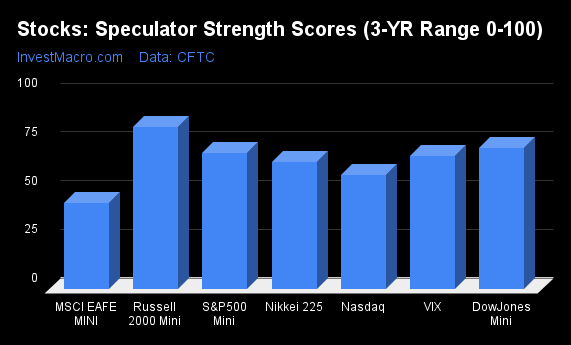
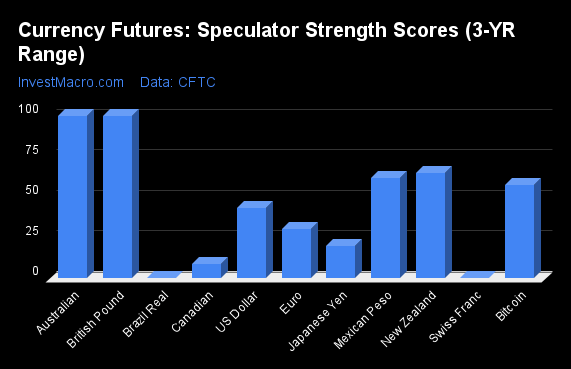
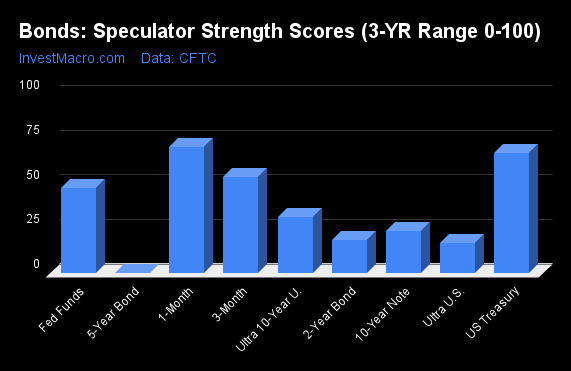
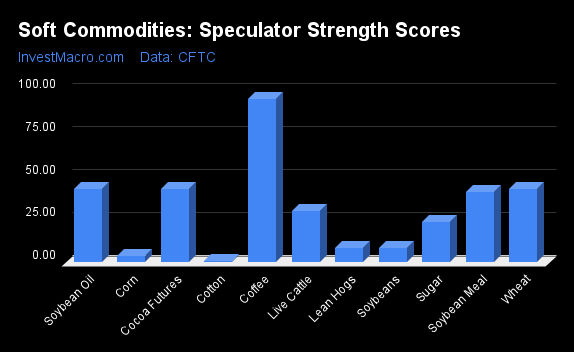
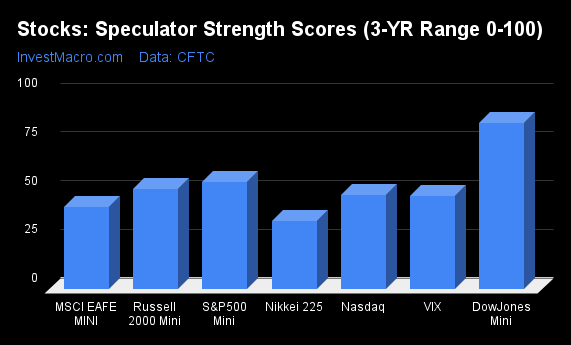
Strength Scores led by Coffee
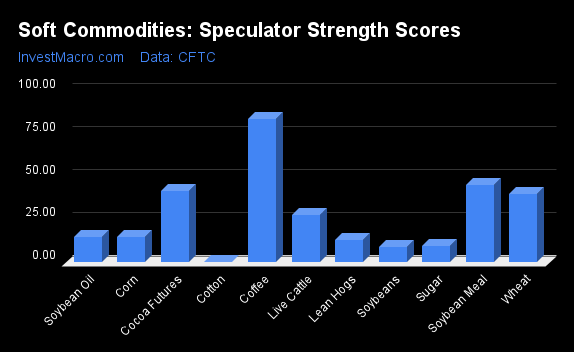
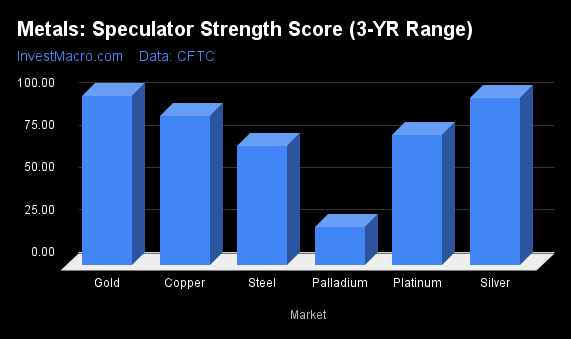
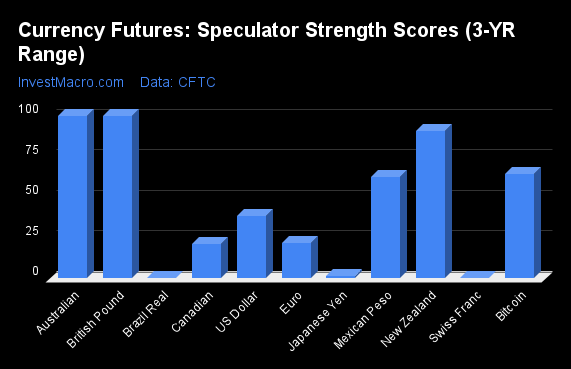
COT Strength Scores (a normalized measure of Speculator positions over a 3-Year range, from 0 to 100 where above 80 is Extreme-Bullish and below 20 is Extreme-Bearish) showed that Coffee (84 percent) leads the softs markets this week.
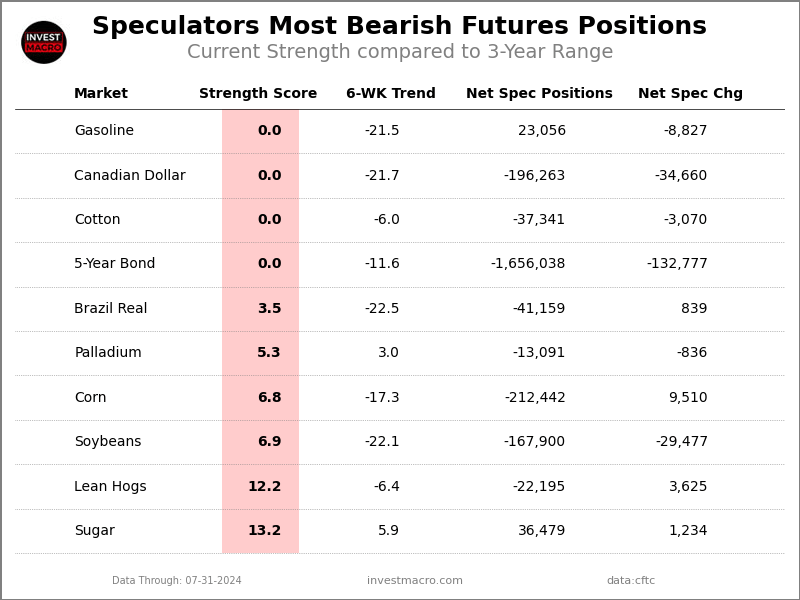
On the downside, Cotton (0 percent), Soybeans (9 percent), Sugar (10 percent), Lean Hogs (13 percent), Corn (15 percent) and Soybean Oil (15 percent) come in at the lowest strength levels currently and are in Extreme-Bearish territory (below 20 percent).
Strength Statistics:
Corn (14.5 percent) vs Corn previous week (6.8 percent)
Sugar (9.7 percent) vs Sugar previous week (13.2 percent)
Coffee (83.6 percent) vs Coffee previous week (87.3 percent)
Soybeans (9.0 percent) vs Soybeans previous week (6.9 percent)
Soybean Oil (14.5 percent) vs Soybean Oil previous week (21.3 percent)
Soybean Meal (45.1 percent) vs Soybean Meal previous week (42.9 percent)
Live Cattle (27.8 percent) vs Live Cattle previous week (43.6 percent)
Lean Hogs (13.0 percent) vs Lean Hogs previous week (12.4 percent)
Cotton (0.0 percent) vs Cotton previous week (2.8 percent)
Cocoa (41.7 percent) vs Cocoa previous week (43.5 percent)
Wheat (39.5 percent) vs Wheat previous week (37.5 percent)
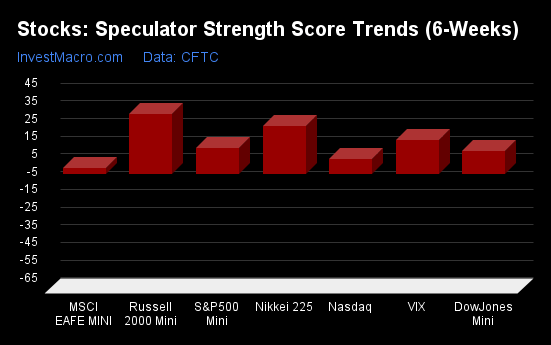
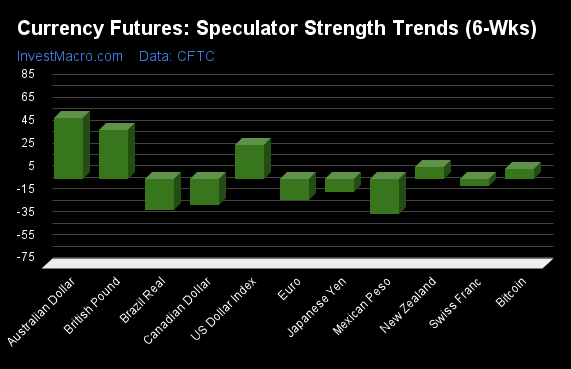
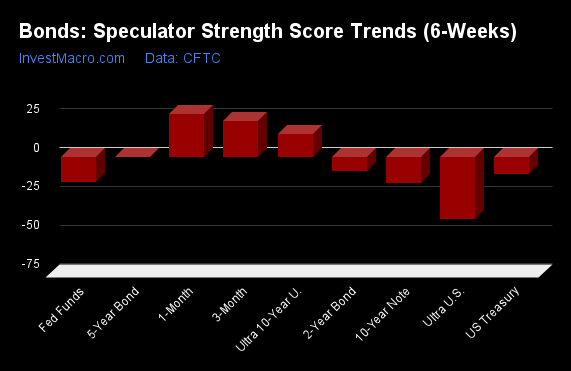
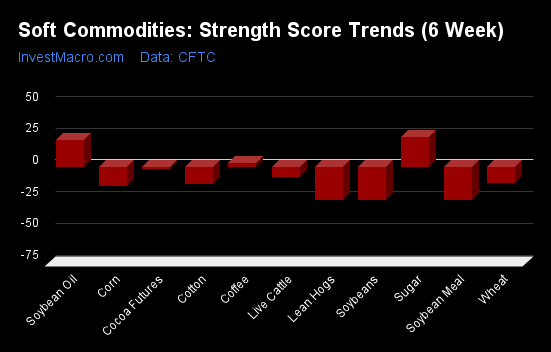
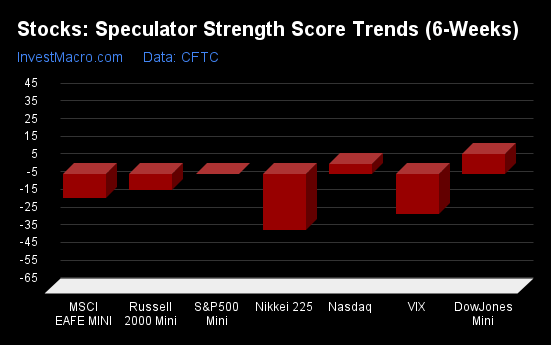
Soybean Oil & Lean Hogs top the 6-Week Strength Trends
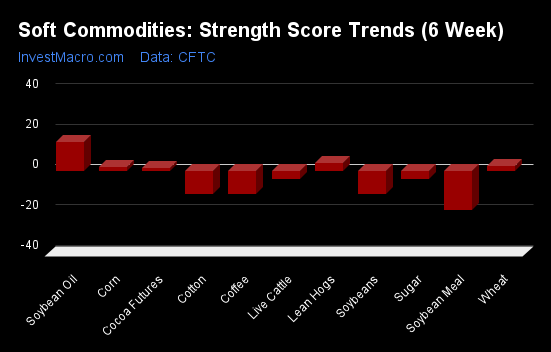
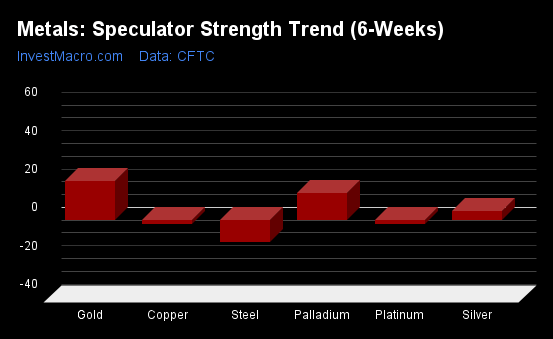
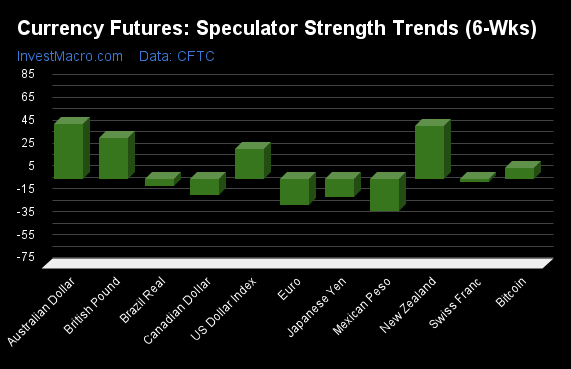
COT Strength Score Trends (or move index, calculates the 6-week changes in strength scores) showed that Soybean Oil (15 percent) and Lean Hogs (4 percent) lead the past six weeks trends for soft commodities. Wheat (3 percent), Corn (2 percent) and Cocoa (2 percent) are the next highest positive movers in the latest trends data.
Soybean Meal (-19 percent) leads the downside trend scores currently with Cotton (-11 percent), Coffee (-11 percent) and Soybeans (-11 percent) following next with lower trend scores.
Strength Trend Statistics:
Corn (2.3 percent) vs Corn previous week (-17.3 percent)
Sugar (-3.7 percent) vs Sugar previous week (5.9 percent)
Coffee (-11.2 percent) vs Coffee previous week (-4.4 percent)
Soybeans (-11.3 percent) vs Soybeans previous week (-22.1 percent)
Soybean Oil (14.5 percent) vs Soybean Oil previous week (5.6 percent)
Soybean Meal (-19.2 percent) vs Soybean Meal previous week (-26.1 percent)
Live Cattle (-3.7 percent) vs Live Cattle previous week (8.1 percent)
Lean Hogs (4.4 percent) vs Lean Hogs previous week (-6.5 percent)
Cotton (-11.0 percent) vs Cotton previous week (-5.9 percent)
Cocoa (1.8 percent) vs Cocoa previous week (-0.9 percent)
Wheat (2.9 percent) vs Wheat previous week (-11.6 percent)
Individual Soft Commodities Markets:
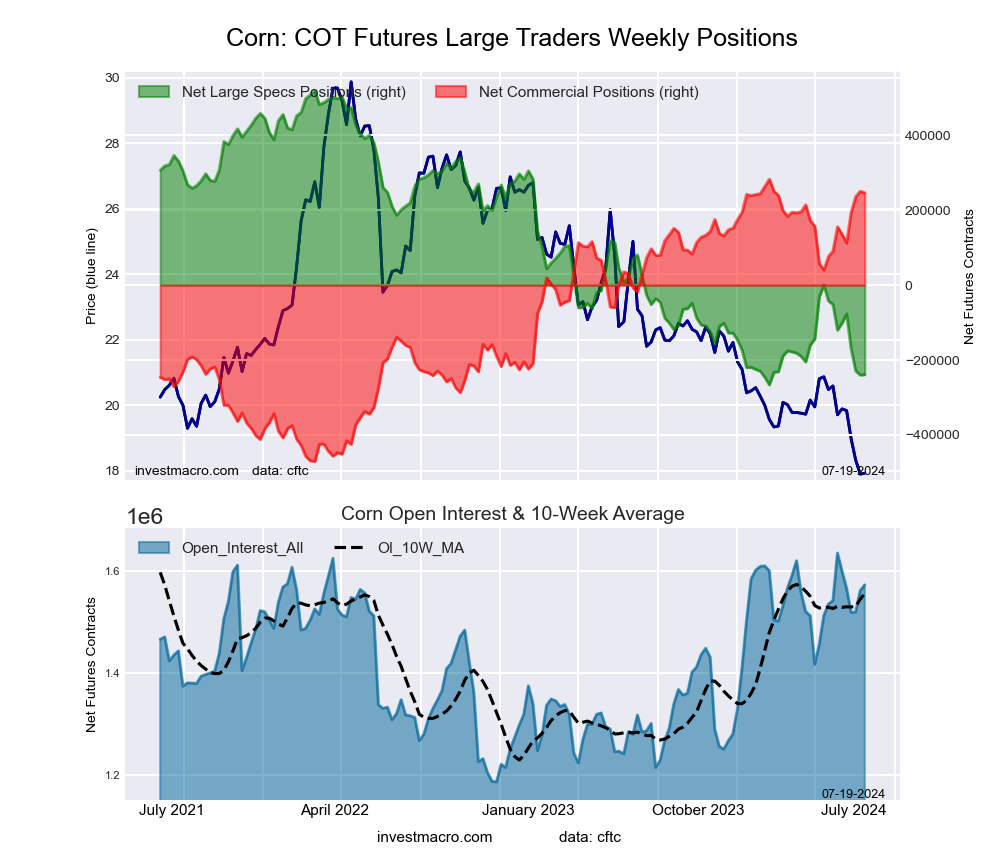
CORN Futures:
 The CORN large speculator standing this week reached a net position of -151,969 contracts in the data reported through Tuesday. This was a weekly boost of 60,473 contracts from the previous week which had a total of -212,442 net contracts.
This week’s current strength score (the trader positioning range over the past three years, measured from 0 to 100) shows the speculators are currently Bearish-Extreme with a score of 14.5 percent. The commercials are Bullish-Extreme with a score of 85.5 percent and the small traders (not shown in chart) are Bullish with a score of 79.0 percent.
Price Trend-Following Model: Strong Downtrend
Our weekly trend-following model classifies the current market price position as: Strong Downtrend. The current action for the model is considered to be: Hold – Maintain Short Position.
| CORN Futures Statistics | SPECULATORS | COMMERCIALS | SMALL TRADERS |
| – Percent of Open Interest Longs: | 20.3 | 44.7 | 9.3 |
| – Percent of Open Interest Shorts: | 29.9 | 33.7 | 10.7 |
| – Net Position: | -151,969 | 173,479 | -21,510 |
| – Gross Longs: | 320,403 | 705,379 | 147,095 |
| – Gross Shorts: | 472,372 | 531,900 | 168,605 |
| – Long to Short Ratio: | 0.7 to 1 | 1.3 to 1 | 0.9 to 1 |
| NET POSITION TREND: | |||
| – Strength Index Score (3 Year Range Pct): | 14.5 | 85.5 | 79.0 |
| – Strength Index Reading (3 Year Range): | Bearish-Extreme | Bullish-Extreme | Bullish |
| NET POSITION MOVEMENT INDEX: | |||
| – 6-Week Change in Strength Index: | 2.3 | -2.7 | 3.5 |
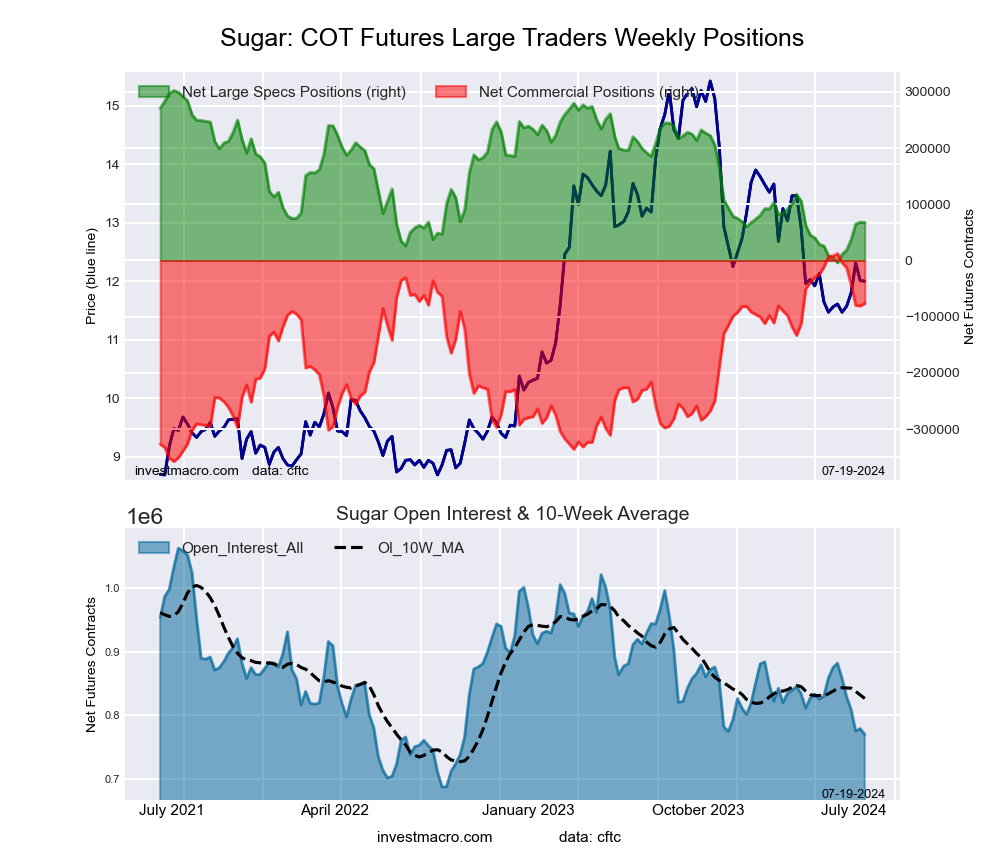
SUGAR Futures:
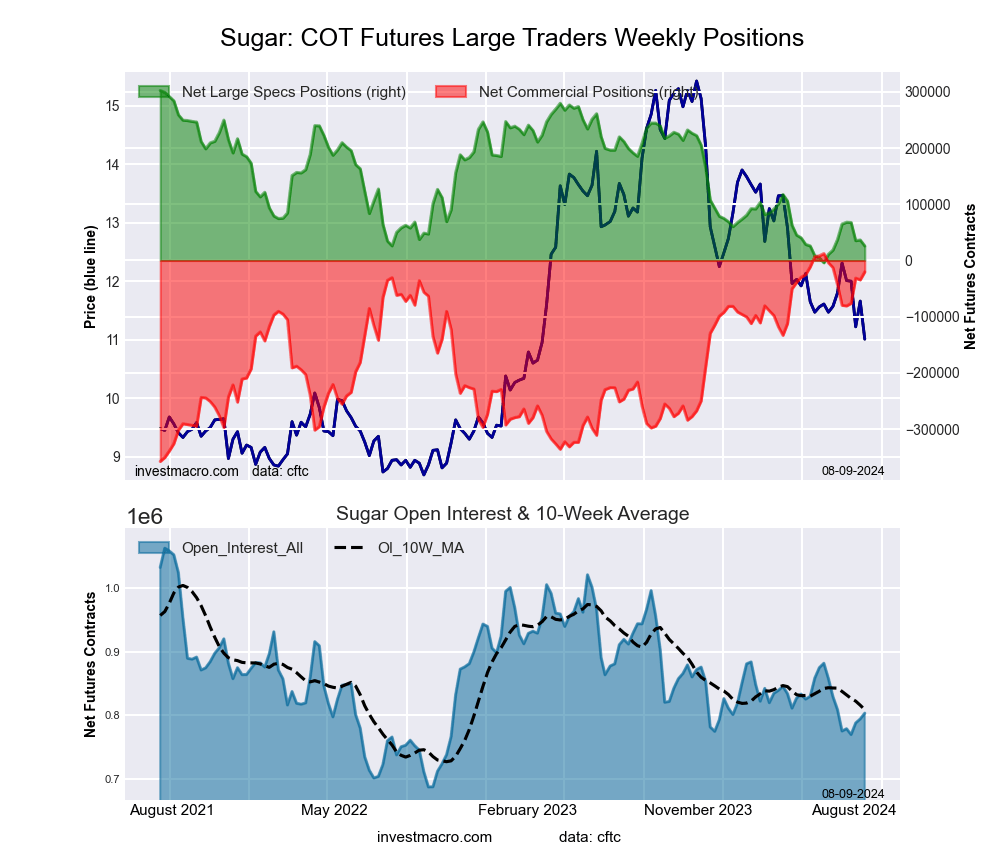 The SUGAR large speculator standing this week reached a net position of 25,815 contracts in the data reported through Tuesday. This was a weekly reduction of -10,664 contracts from the previous week which had a total of 36,479 net contracts.
This week’s current strength score (the trader positioning range over the past three years, measured from 0 to 100) shows the speculators are currently Bearish-Extreme with a score of 9.7 percent. The commercials are Bullish-Extreme with a score of 91.2 percent and the small traders (not shown in chart) are Bearish-Extreme with a score of 12.4 percent.
Price Trend-Following Model: Downtrend
Our weekly trend-following model classifies the current market price position as: Downtrend. The current action for the model is considered to be: Hold – Maintain Short Position.
| SUGAR Futures Statistics | SPECULATORS | COMMERCIALS | SMALL TRADERS |
| – Percent of Open Interest Longs: | 23.3 | 55.2 | 7.5 |
| – Percent of Open Interest Shorts: | 20.1 | 57.7 | 8.2 |
| – Net Position: | 25,815 | -20,274 | -5,541 |
| – Gross Longs: | 186,989 | 443,364 | 60,431 |
| – Gross Shorts: | 161,174 | 463,638 | 65,972 |
| – Long to Short Ratio: | 1.2 to 1 | 1.0 to 1 | 0.9 to 1 |
| NET POSITION TREND: | |||
| – Strength Index Score (3 Year Range Pct): | 9.7 | 91.2 | 12.4 |
| – Strength Index Reading (3 Year Range): | Bearish-Extreme | Bullish-Extreme | Bearish-Extreme |
| NET POSITION MOVEMENT INDEX: | |||
| – 6-Week Change in Strength Index: | -3.7 | 6.2 | -15.2 |
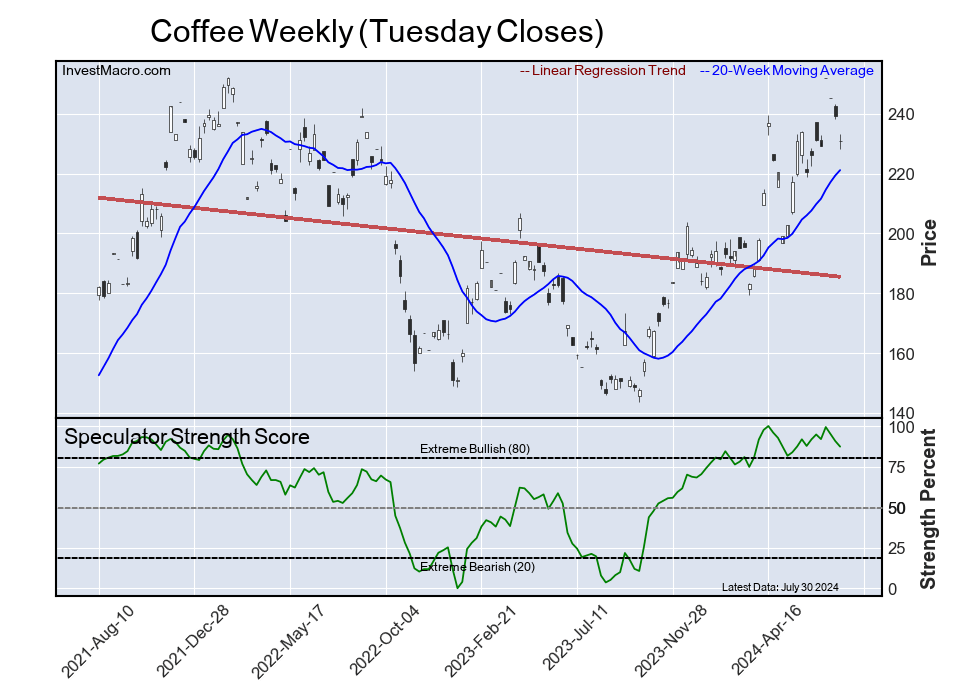
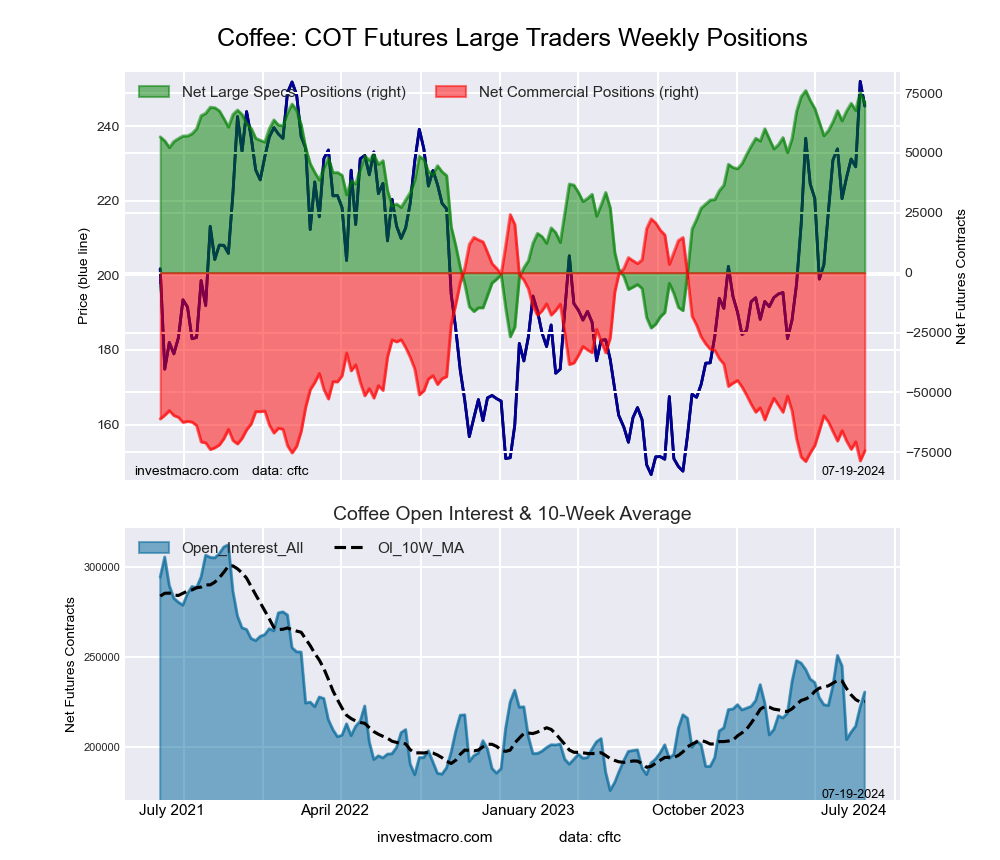
COFFEE Futures:
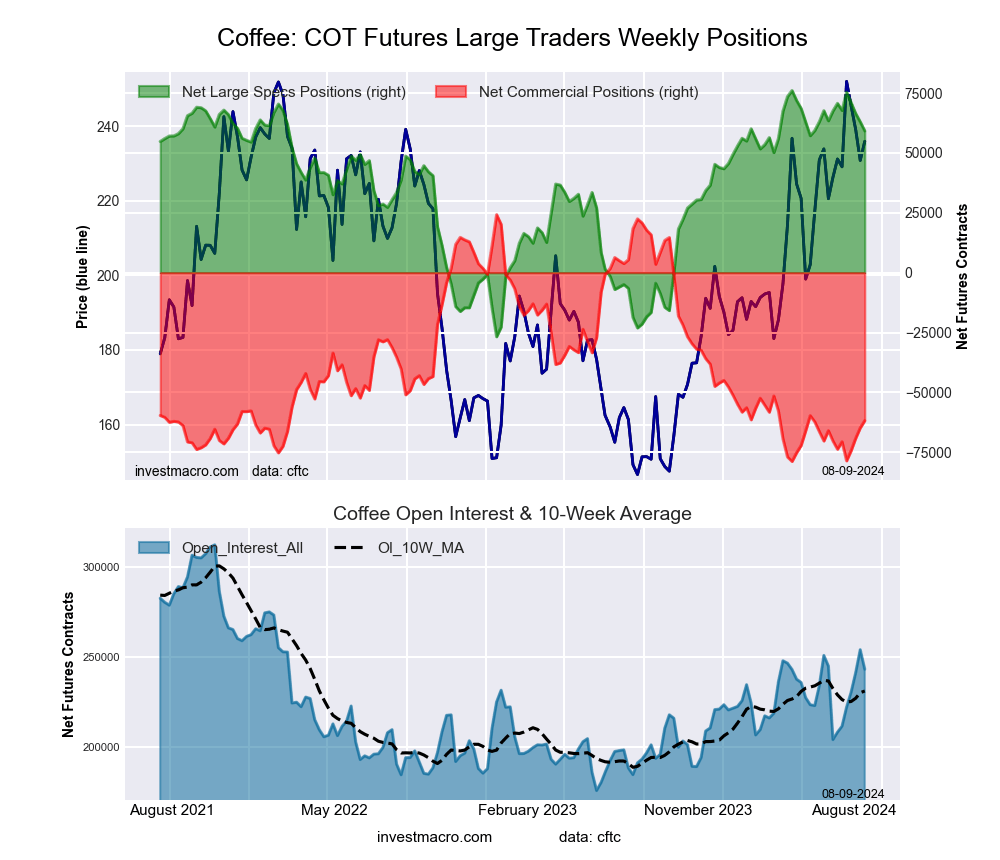 The COFFEE large speculator standing this week reached a net position of 59,207 contracts in the data reported through Tuesday. This was a weekly decrease of -3,809 contracts from the previous week which had a total of 63,016 net contracts.
This week’s current strength score (the trader positioning range over the past three years, measured from 0 to 100) shows the speculators are currently Bullish-Extreme with a score of 83.6 percent. The commercials are Bearish-Extreme with a score of 16.6 percent and the small traders (not shown in chart) are Bullish with a score of 56.0 percent.
Price Trend-Following Model: Strong Uptrend
Our weekly trend-following model classifies the current market price position as: Strong Uptrend. The current action for the model is considered to be: Hold – Maintain Long Position.
| COFFEE Futures Statistics | SPECULATORS | COMMERCIALS | SMALL TRADERS |
| – Percent of Open Interest Longs: | 29.7 | 41.6 | 3.4 |
| – Percent of Open Interest Shorts: | 5.4 | 67.0 | 2.4 |
| – Net Position: | 59,207 | -61,771 | 2,564 |
| – Gross Longs: | 72,262 | 101,059 | 8,330 |
| – Gross Shorts: | 13,055 | 162,830 | 5,766 |
| – Long to Short Ratio: | 5.5 to 1 | 0.6 to 1 | 1.4 to 1 |
| NET POSITION TREND: | |||
| – Strength Index Score (3 Year Range Pct): | 83.6 | 16.6 | 56.0 |
| – Strength Index Reading (3 Year Range): | Bullish-Extreme | Bearish-Extreme | Bullish |
| NET POSITION MOVEMENT INDEX: | |||
| – 6-Week Change in Strength Index: | -11.2 | 11.6 | -6.9 |
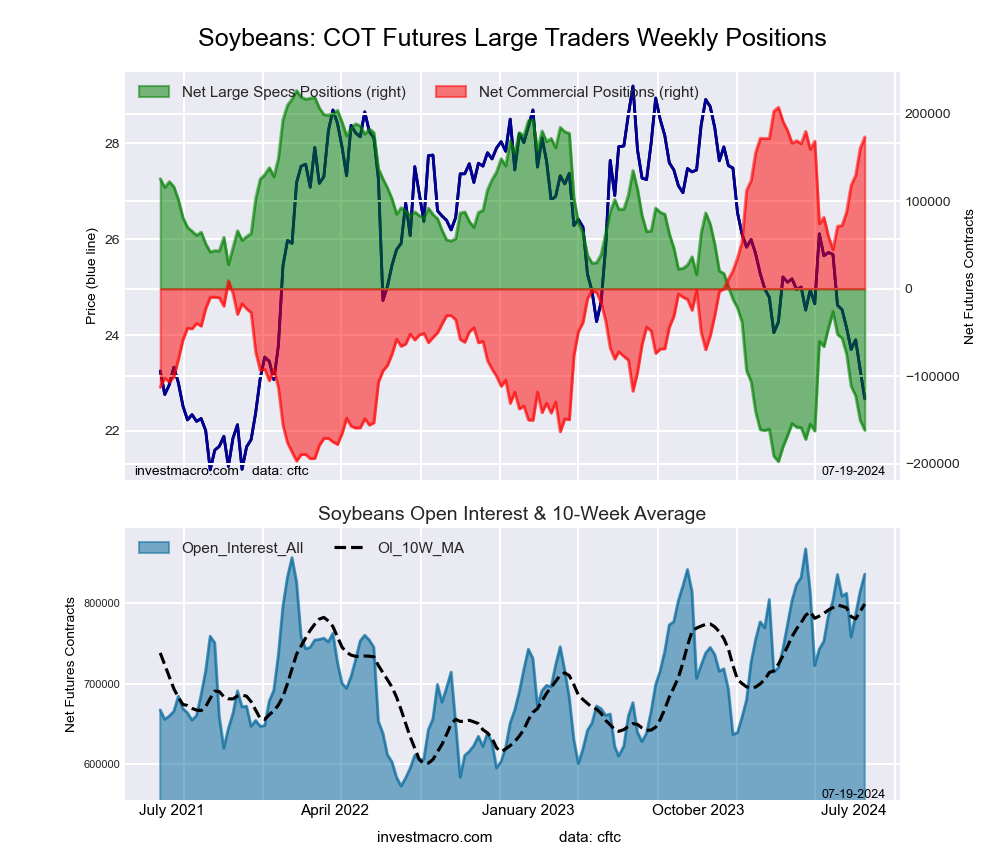
SOYBEANS Futures:
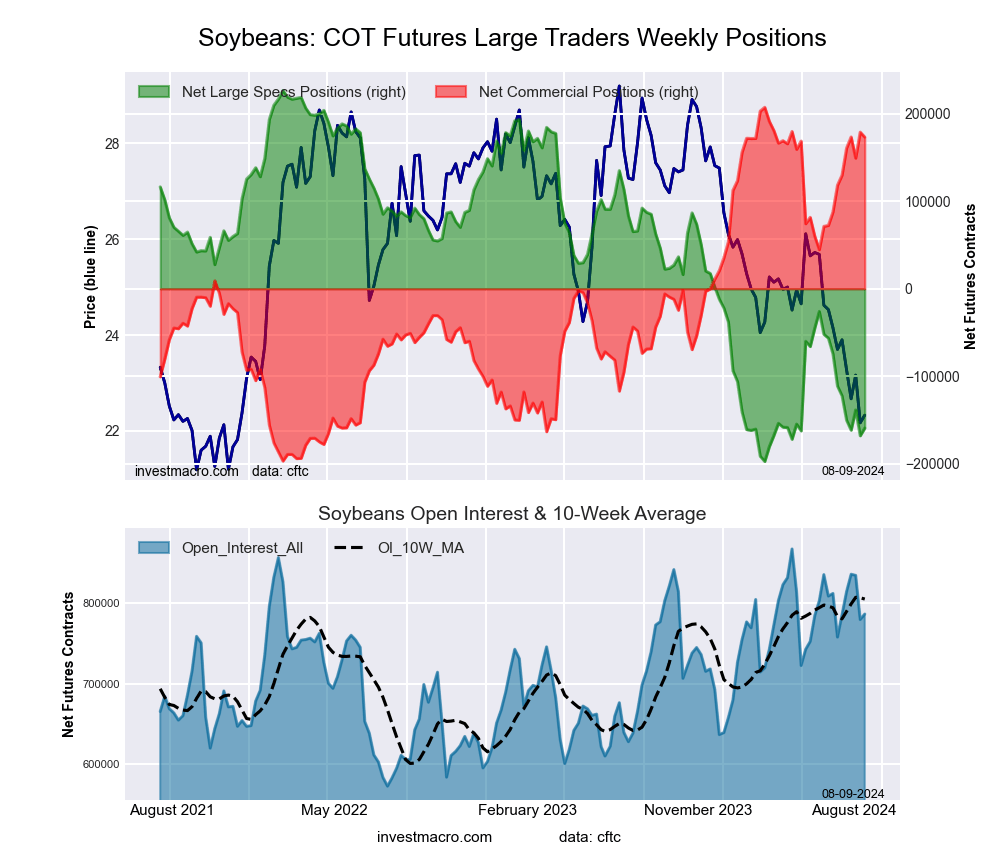 The SOYBEANS large speculator standing this week reached a net position of -159,128 contracts in the data reported through Tuesday. This was a weekly rise of 8,772 contracts from the previous week which had a total of -167,900 net contracts.
This week’s current strength score (the trader positioning range over the past three years, measured from 0 to 100) shows the speculators are currently Bearish-Extreme with a score of 9.0 percent. The commercials are Bullish-Extreme with a score of 91.6 percent and the small traders (not shown in chart) are Bullish with a score of 75.7 percent.
Price Trend-Following Model: Strong Downtrend
Our weekly trend-following model classifies the current market price position as: Strong Downtrend. The current action for the model is considered to be: Hold – Maintain Short Position.
| SOYBEANS Futures Statistics | SPECULATORS | COMMERCIALS | SMALL TRADERS |
| – Percent of Open Interest Longs: | 14.1 | 61.5 | 5.3 |
| – Percent of Open Interest Shorts: | 34.4 | 39.5 | 7.1 |
| – Net Position: | -159,128 | 173,211 | -14,083 |
| – Gross Longs: | 111,259 | 484,227 | 41,958 |
| – Gross Shorts: | 270,387 | 311,016 | 56,041 |
| – Long to Short Ratio: | 0.4 to 1 | 1.6 to 1 | 0.7 to 1 |
| NET POSITION TREND: | |||
| – Strength Index Score (3 Year Range Pct): | 9.0 | 91.6 | 75.7 |
| – Strength Index Reading (3 Year Range): | Bearish-Extreme | Bullish-Extreme | Bullish |
| NET POSITION MOVEMENT INDEX: | |||
| – 6-Week Change in Strength Index: | -11.3 | 13.6 | -18.3 |
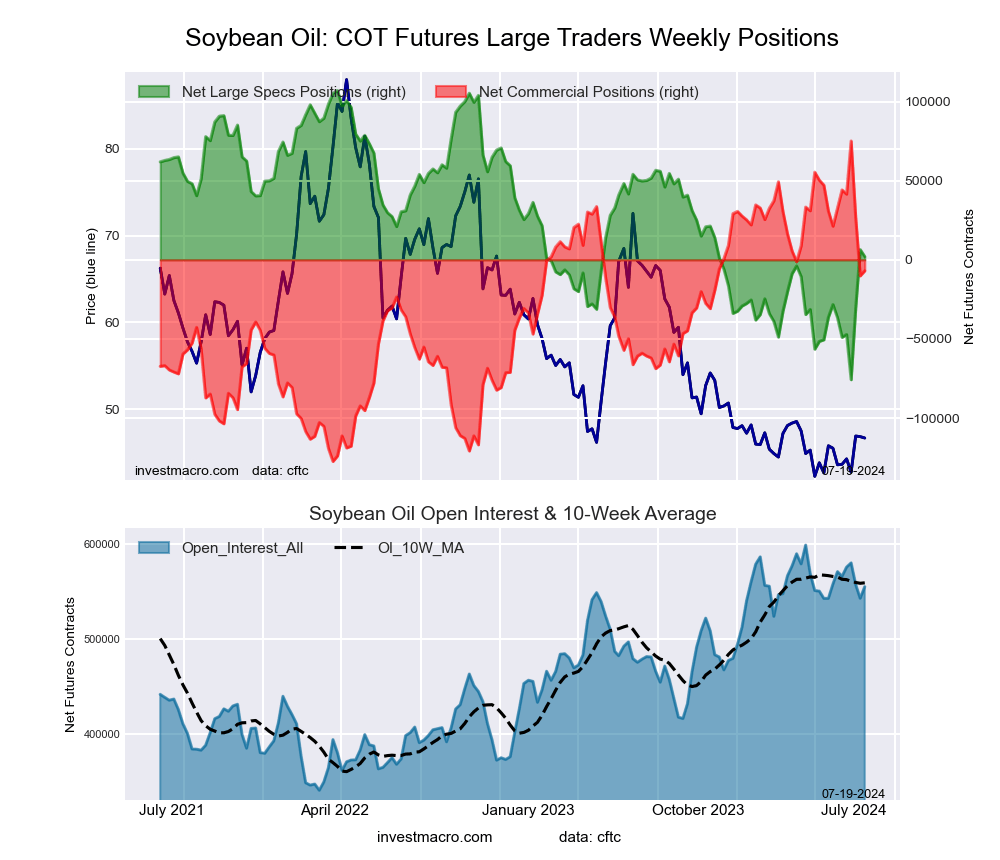
SOYBEAN OIL Futures:
 The SOYBEAN OIL large speculator standing this week reached a net position of -49,166 contracts in the data reported through Tuesday. This was a weekly fall of -12,288 contracts from the previous week which had a total of -36,878 net contracts.
This week’s current strength score (the trader positioning range over the past three years, measured from 0 to 100) shows the speculators are currently Bearish-Extreme with a score of 14.5 percent. The commercials are Bullish-Extreme with a score of 85.3 percent and the small traders (not shown in chart) are Bearish with a score of 29.1 percent.
Price Trend-Following Model: Strong Downtrend
Our weekly trend-following model classifies the current market price position as: Strong Downtrend. The current action for the model is considered to be: Hold – Maintain Short Position.
| SOYBEAN OIL Futures Statistics | SPECULATORS | COMMERCIALS | SMALL TRADERS |
| – Percent of Open Interest Longs: | 21.0 | 53.1 | 5.5 |
| – Percent of Open Interest Shorts: | 29.9 | 44.9 | 4.8 |
| – Net Position: | -49,166 | 45,285 | 3,881 |
| – Gross Longs: | 115,500 | 292,565 | 30,057 |
| – Gross Shorts: | 164,666 | 247,280 | 26,176 |
| – Long to Short Ratio: | 0.7 to 1 | 1.2 to 1 | 1.1 to 1 |
| NET POSITION TREND: | |||
| – Strength Index Score (3 Year Range Pct): | 14.5 | 85.3 | 29.1 |
| – Strength Index Reading (3 Year Range): | Bearish-Extreme | Bullish-Extreme | Bearish |
| NET POSITION MOVEMENT INDEX: | |||
| – 6-Week Change in Strength Index: | 14.5 | -14.7 | 12.5 |
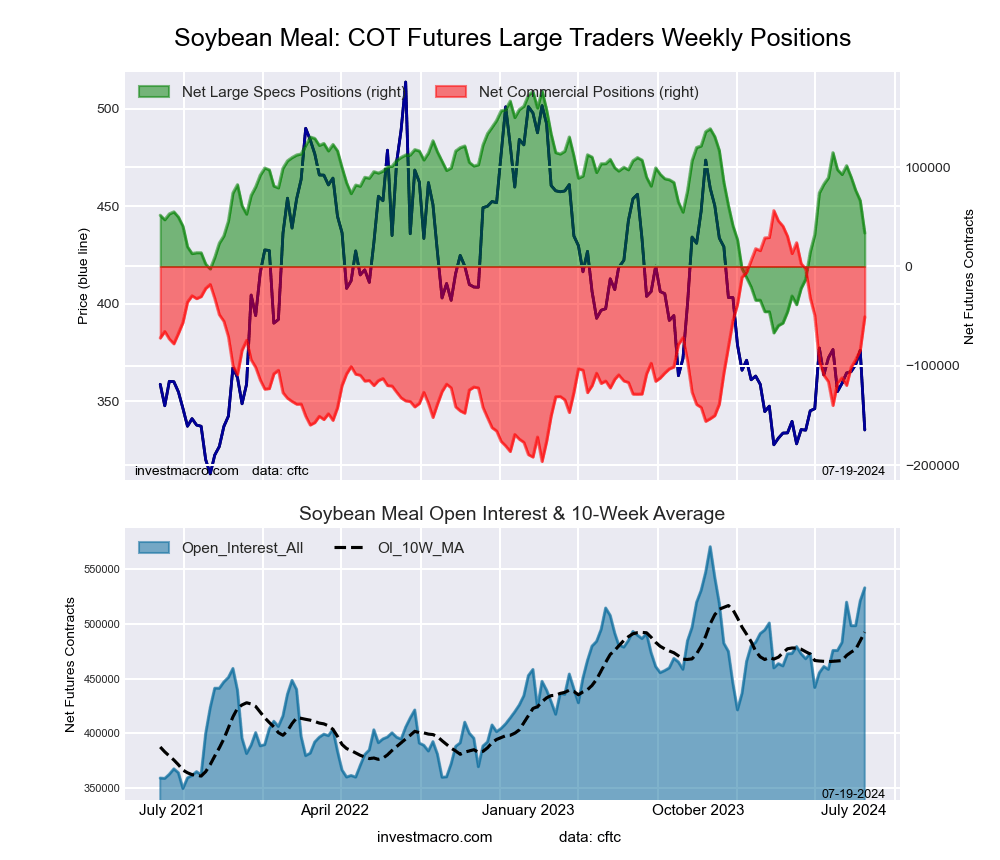
SOYBEAN MEAL Futures:
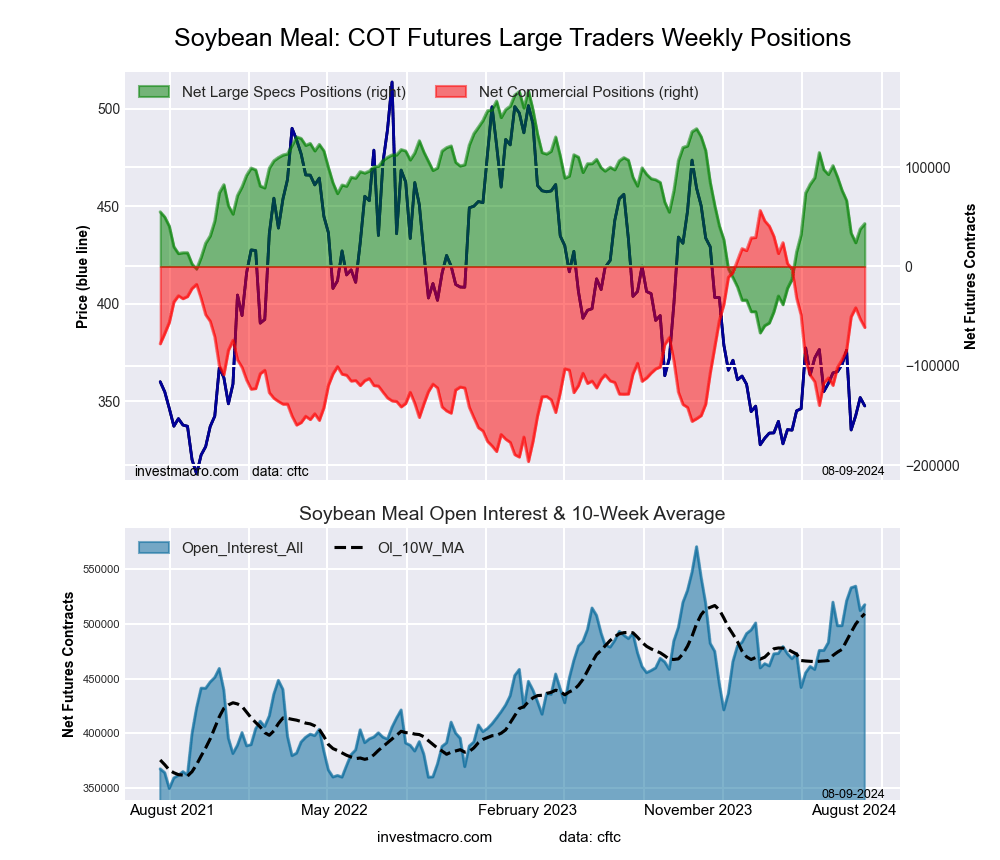 The SOYBEAN MEAL large speculator standing this week reached a net position of 43,091 contracts in the data reported through Tuesday. This was a weekly boost of 5,397 contracts from the previous week which had a total of 37,694 net contracts.
This week’s current strength score (the trader positioning range over the past three years, measured from 0 to 100) shows the speculators are currently Bearish with a score of 45.1 percent. The commercials are Bullish with a score of 53.4 percent and the small traders (not shown in chart) are Bearish with a score of 37.8 percent.
Price Trend-Following Model: Weak Uptrend
Our weekly trend-following model classifies the current market price position as: Weak Uptrend. The current action for the model is considered to be: Hold – Maintain Long Position.
| SOYBEAN MEAL Futures Statistics | SPECULATORS | COMMERCIALS | SMALL TRADERS |
| – Percent of Open Interest Longs: | 24.3 | 43.1 | 9.1 |
| – Percent of Open Interest Shorts: | 16.0 | 55.0 | 5.6 |
| – Net Position: | 43,091 | -61,351 | 18,260 |
| – Gross Longs: | 125,998 | 223,119 | 47,203 |
| – Gross Shorts: | 82,907 | 284,470 | 28,943 |
| – Long to Short Ratio: | 1.5 to 1 | 0.8 to 1 | 1.6 to 1 |
| NET POSITION TREND: | |||
| – Strength Index Score (3 Year Range Pct): | 45.1 | 53.4 | 37.8 |
| – Strength Index Reading (3 Year Range): | Bearish | Bullish | Bearish |
| NET POSITION MOVEMENT INDEX: | |||
| – 6-Week Change in Strength Index: | -19.2 | 15.9 | 30.1 |
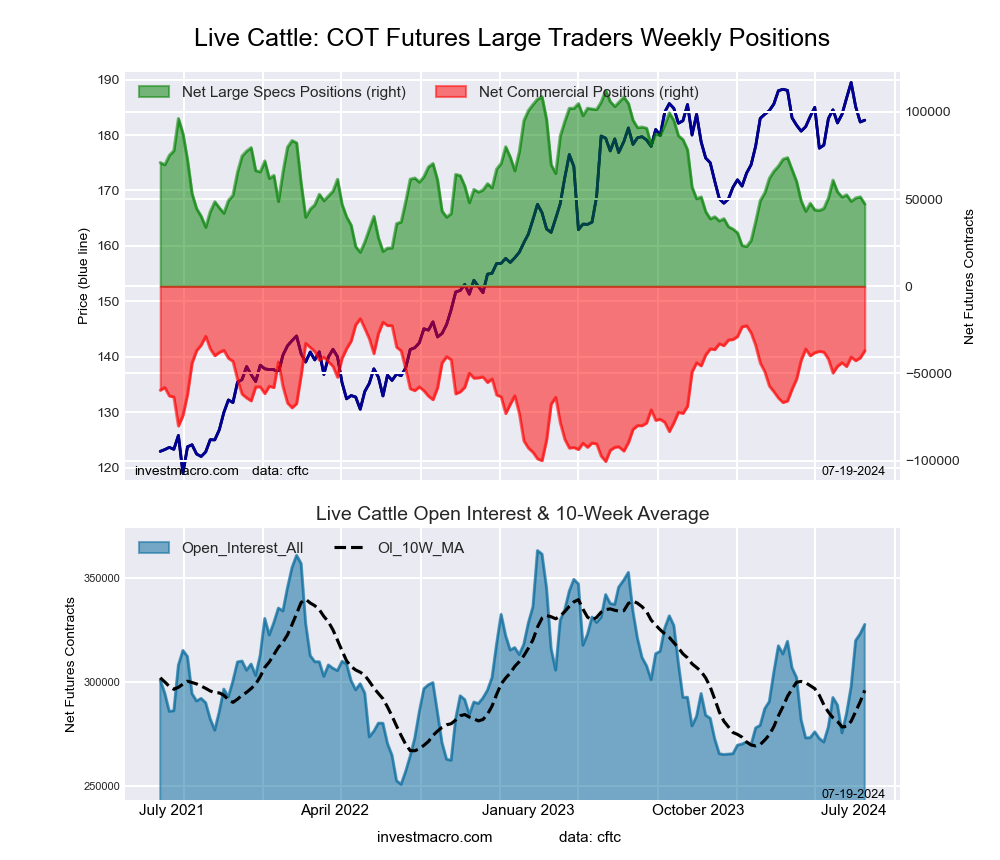
LIVE CATTLE Futures:
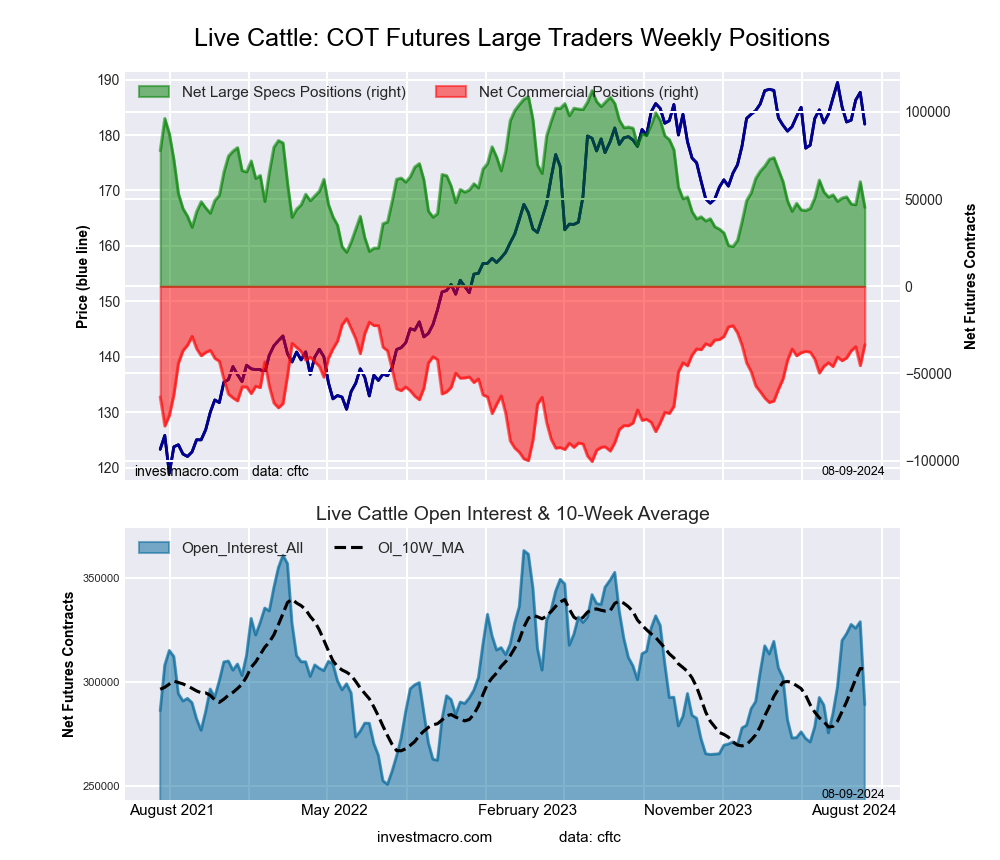 The LIVE CATTLE large speculator standing this week reached a net position of 45,272 contracts in the data reported through Tuesday. This was a weekly fall of -14,702 contracts from the previous week which had a total of 59,974 net contracts.
This week’s current strength score (the trader positioning range over the past three years, measured from 0 to 100) shows the speculators are currently Bearish with a score of 27.8 percent. The commercials are Bullish-Extreme with a score of 81.7 percent and the small traders (not shown in chart) are Bearish with a score of 27.2 percent.
Price Trend-Following Model: Weak Uptrend
Our weekly trend-following model classifies the current market price position as: Weak Uptrend. The current action for the model is considered to be: Hold – Maintain Long Position.
| LIVE CATTLE Futures Statistics | SPECULATORS | COMMERCIALS | SMALL TRADERS |
| – Percent of Open Interest Longs: | 37.6 | 32.5 | 10.0 |
| – Percent of Open Interest Shorts: | 21.9 | 44.1 | 14.1 |
| – Net Position: | 45,272 | -33,544 | -11,728 |
| – Gross Longs: | 108,655 | 94,052 | 28,946 |
| – Gross Shorts: | 63,383 | 127,596 | 40,674 |
| – Long to Short Ratio: | 1.7 to 1 | 0.7 to 1 | 0.7 to 1 |
| NET POSITION TREND: | |||
| – Strength Index Score (3 Year Range Pct): | 27.8 | 81.7 | 27.2 |
| – Strength Index Reading (3 Year Range): | Bearish | Bullish-Extreme | Bearish |
| NET POSITION MOVEMENT INDEX: | |||
| – 6-Week Change in Strength Index: | -3.7 | 8.6 | -19.0 |
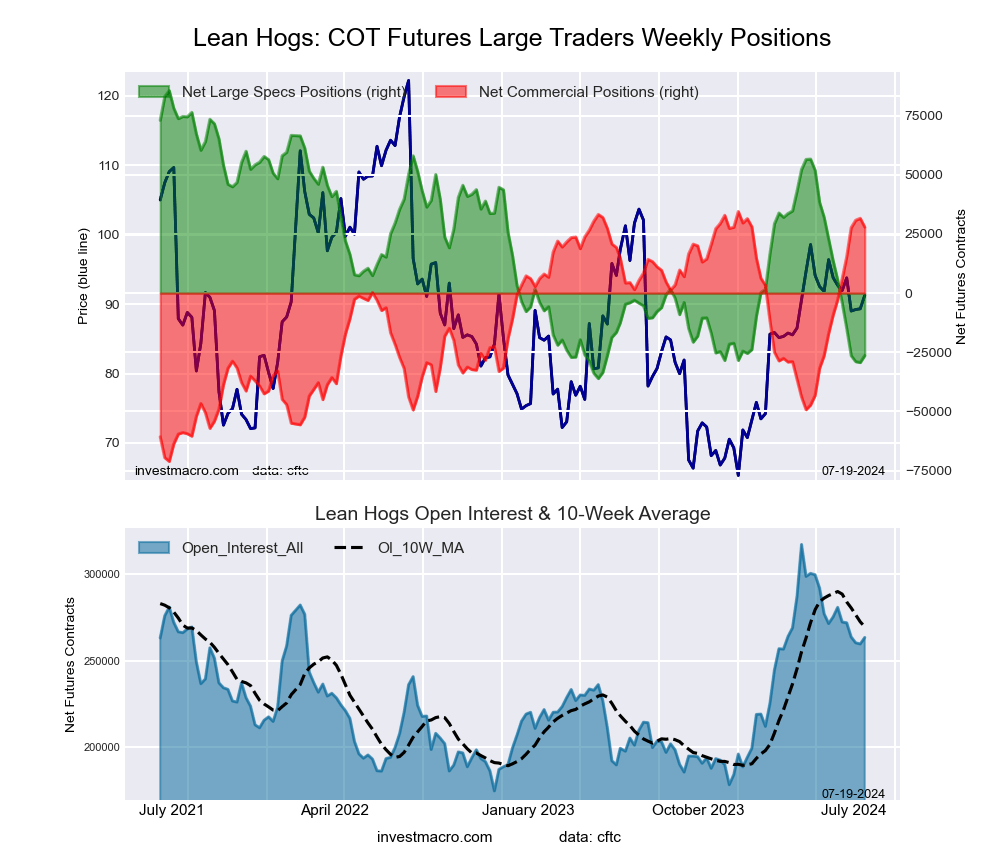
LEAN HOGS Futures:
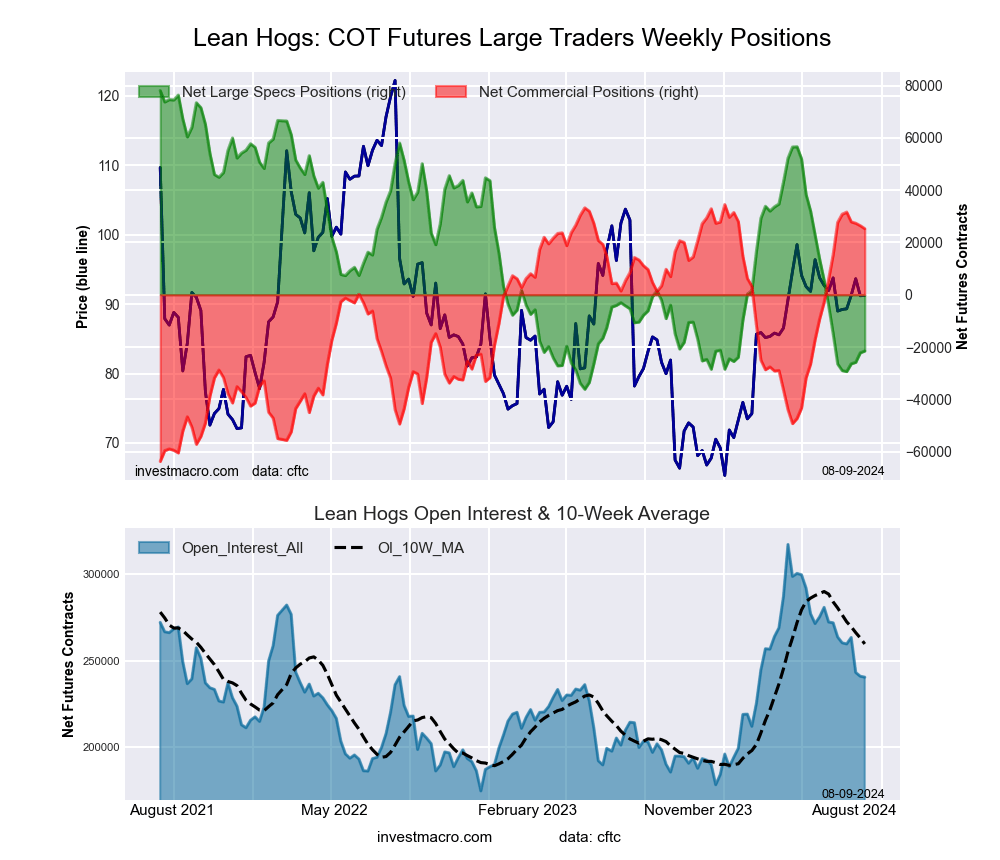 The LEAN HOGS large speculator standing this week reached a net position of -21,490 contracts in the data reported through Tuesday. This was a weekly increase of 705 contracts from the previous week which had a total of -22,195 net contracts.
This week’s current strength score (the trader positioning range over the past three years, measured from 0 to 100) shows the speculators are currently Bearish-Extreme with a score of 13.0 percent. The commercials are Bullish-Extreme with a score of 90.3 percent and the small traders (not shown in chart) are Bullish with a score of 66.4 percent.
Price Trend-Following Model: Weak Uptrend
Our weekly trend-following model classifies the current market price position as: Weak Uptrend. The current action for the model is considered to be: Hold – Maintain Long Position.
| LEAN HOGS Futures Statistics | SPECULATORS | COMMERCIALS | SMALL TRADERS |
| – Percent of Open Interest Longs: | 36.4 | 39.5 | 6.1 |
| – Percent of Open Interest Shorts: | 45.3 | 29.0 | 7.7 |
| – Net Position: | -21,490 | 25,276 | -3,786 |
| – Gross Longs: | 87,503 | 95,087 | 14,748 |
| – Gross Shorts: | 108,993 | 69,811 | 18,534 |
| – Long to Short Ratio: | 0.8 to 1 | 1.4 to 1 | 0.8 to 1 |
| NET POSITION TREND: | |||
| – Strength Index Score (3 Year Range Pct): | 13.0 | 90.3 | 66.4 |
| – Strength Index Reading (3 Year Range): | Bearish-Extreme | Bullish-Extreme | Bullish |
| NET POSITION MOVEMENT INDEX: | |||
| – 6-Week Change in Strength Index: | 4.4 | -2.5 | -11.5 |
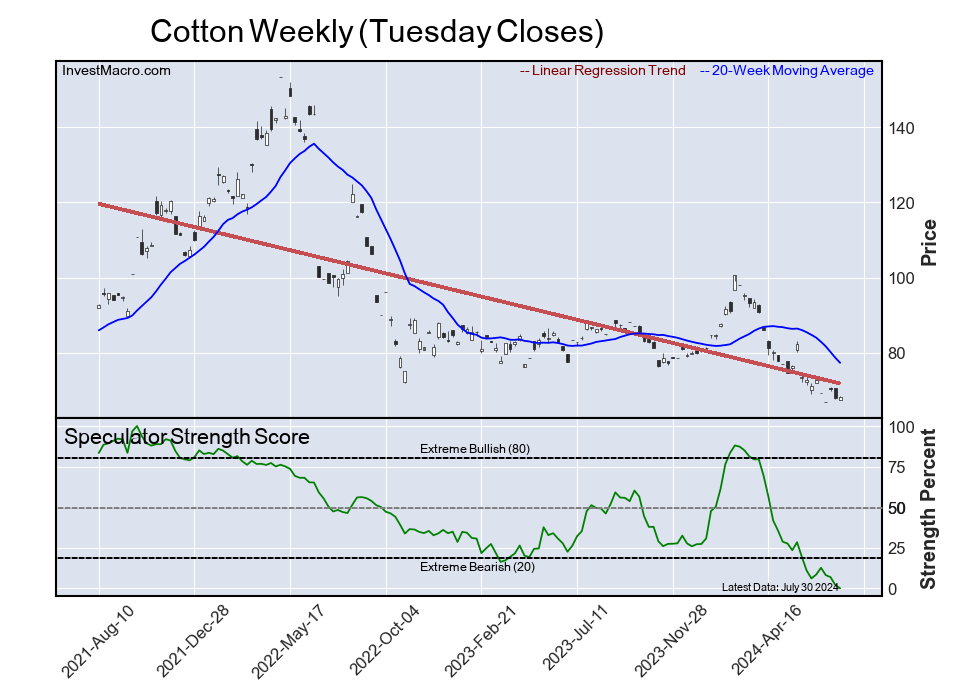
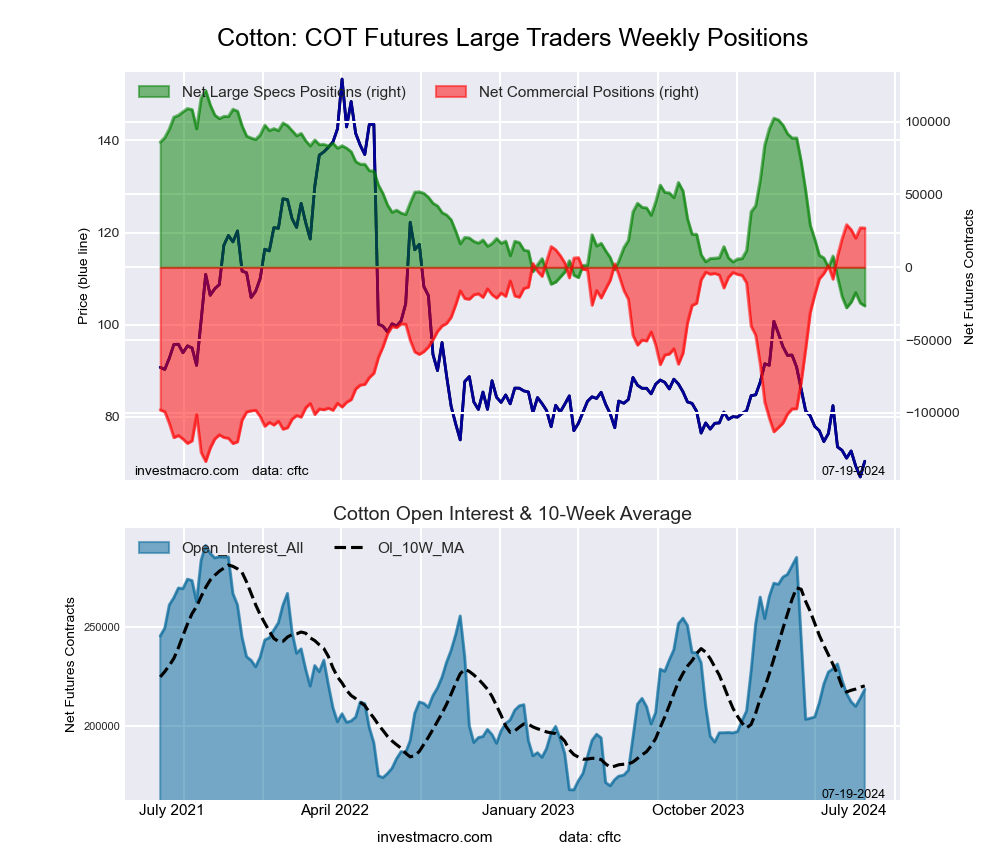
COTTON Futures:
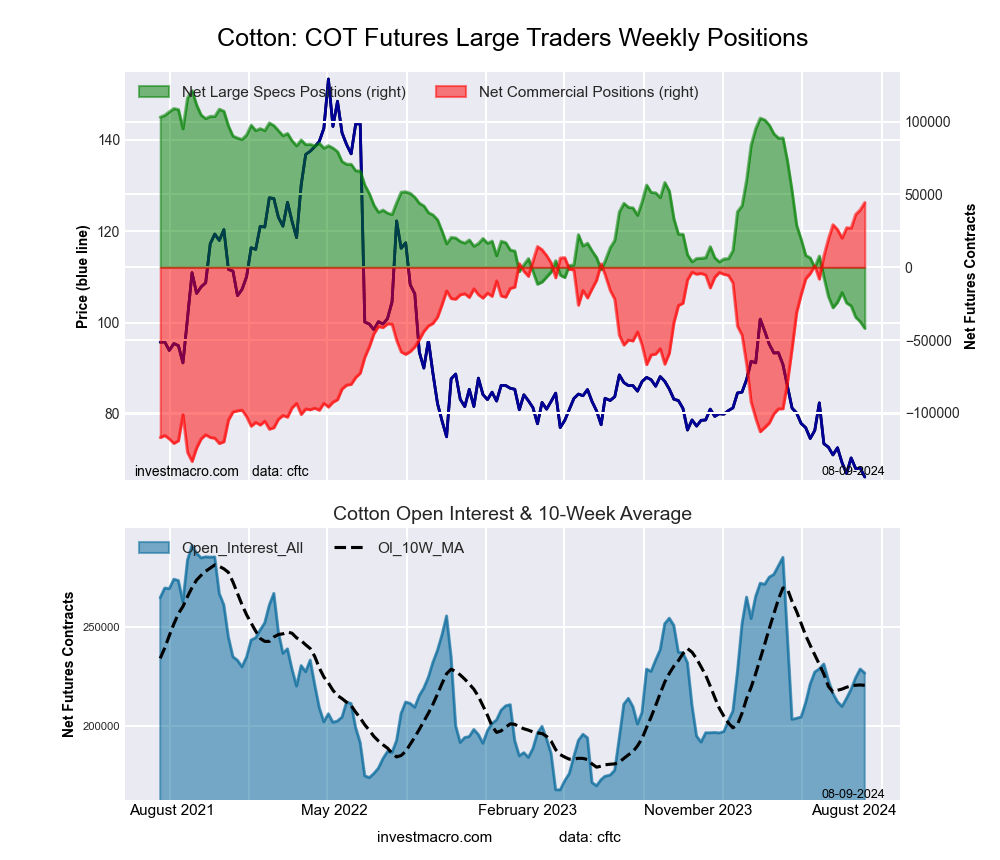 The COTTON large speculator standing this week reached a net position of -41,908 contracts in the data reported through Tuesday. This was a weekly decline of -4,567 contracts from the previous week which had a total of -37,341 net contracts.
This week’s current strength score (the trader positioning range over the past three years, measured from 0 to 100) shows the speculators are currently Bearish-Extreme with a score of 0.0 percent. The commercials are Bullish-Extreme with a score of 100.0 percent and the small traders (not shown in chart) are Bearish-Extreme with a score of 1.0 percent.
Price Trend-Following Model: Downtrend
Our weekly trend-following model classifies the current market price position as: Downtrend. The current action for the model is considered to be: Hold – Maintain Short Position.
| COTTON Futures Statistics | SPECULATORS | COMMERCIALS | SMALL TRADERS |
| – Percent of Open Interest Longs: | 26.5 | 50.8 | 5.4 |
| – Percent of Open Interest Shorts: | 45.0 | 31.2 | 6.5 |
| – Net Position: | -41,908 | 44,447 | -2,539 |
| – Gross Longs: | 60,131 | 115,178 | 12,254 |
| – Gross Shorts: | 102,039 | 70,731 | 14,793 |
| – Long to Short Ratio: | 0.6 to 1 | 1.6 to 1 | 0.8 to 1 |
| NET POSITION TREND: | |||
| – Strength Index Score (3 Year Range Pct): | 0.0 | 100.0 | 1.0 |
| – Strength Index Reading (3 Year Range): | Bearish-Extreme | Bullish-Extreme | Bearish-Extreme |
| NET POSITION MOVEMENT INDEX: | |||
| – 6-Week Change in Strength Index: | -11.0 | 10.5 | -4.1 |
COCOA Futures:
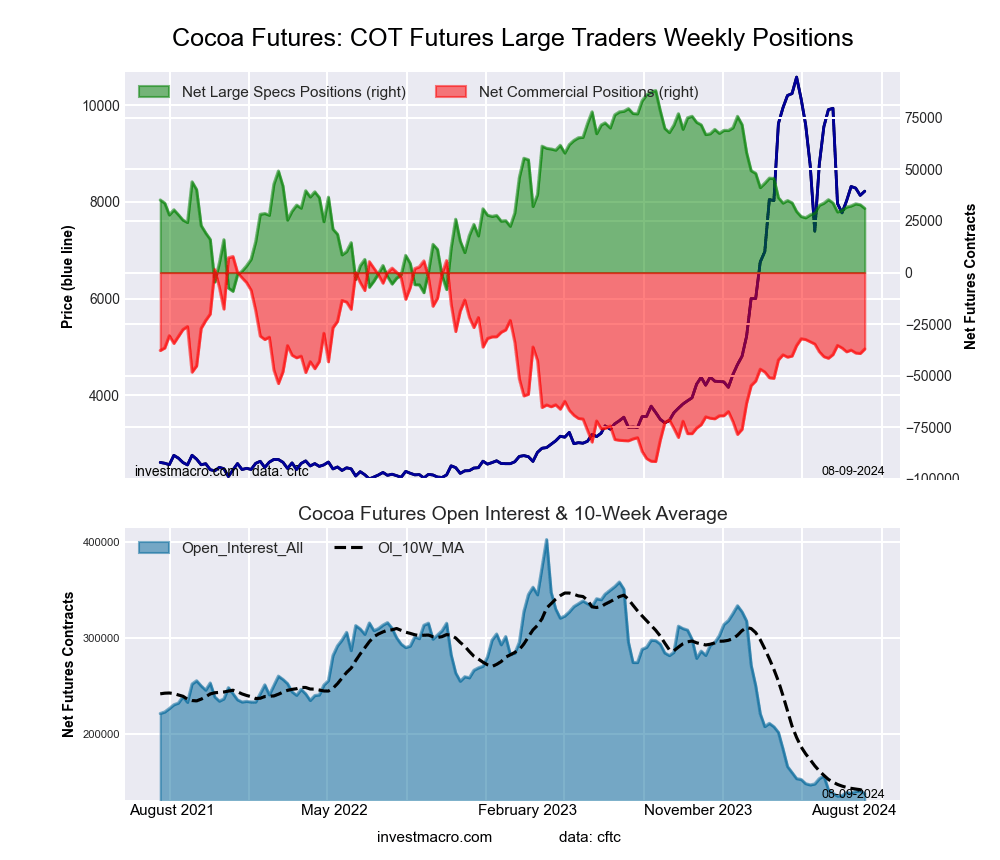 The COCOA large speculator standing this week reached a net position of 31,097 contracts in the data reported through Tuesday. This was a weekly decline of -1,773 contracts from the previous week which had a total of 32,870 net contracts.
This week’s current strength score (the trader positioning range over the past three years, measured from 0 to 100) shows the speculators are currently Bearish with a score of 41.7 percent. The commercials are Bullish with a score of 54.9 percent and the small traders (not shown in chart) are Bullish with a score of 63.1 percent.
Price Trend-Following Model: Downtrend
Our weekly trend-following model classifies the current market price position as: Downtrend. The current action for the model is considered to be: Hold – Maintain Short Position.
| COCOA Futures Statistics | SPECULATORS | COMMERCIALS | SMALL TRADERS |
| – Percent of Open Interest Longs: | 36.1 | 35.5 | 8.7 |
| – Percent of Open Interest Shorts: | 13.5 | 62.5 | 4.3 |
| – Net Position: | 31,097 | -37,073 | 5,976 |
| – Gross Longs: | 49,602 | 48,710 | 11,944 |
| – Gross Shorts: | 18,505 | 85,783 | 5,968 |
| – Long to Short Ratio: | 2.7 to 1 | 0.6 to 1 | 2.0 to 1 |
| NET POSITION TREND: | |||
| – Strength Index Score (3 Year Range Pct): | 41.7 | 54.9 | 63.1 |
| – Strength Index Reading (3 Year Range): | Bearish | Bullish | Bullish |
| NET POSITION MOVEMENT INDEX: | |||
| – 6-Week Change in Strength Index: | 1.8 | -1.7 | -0.1 |
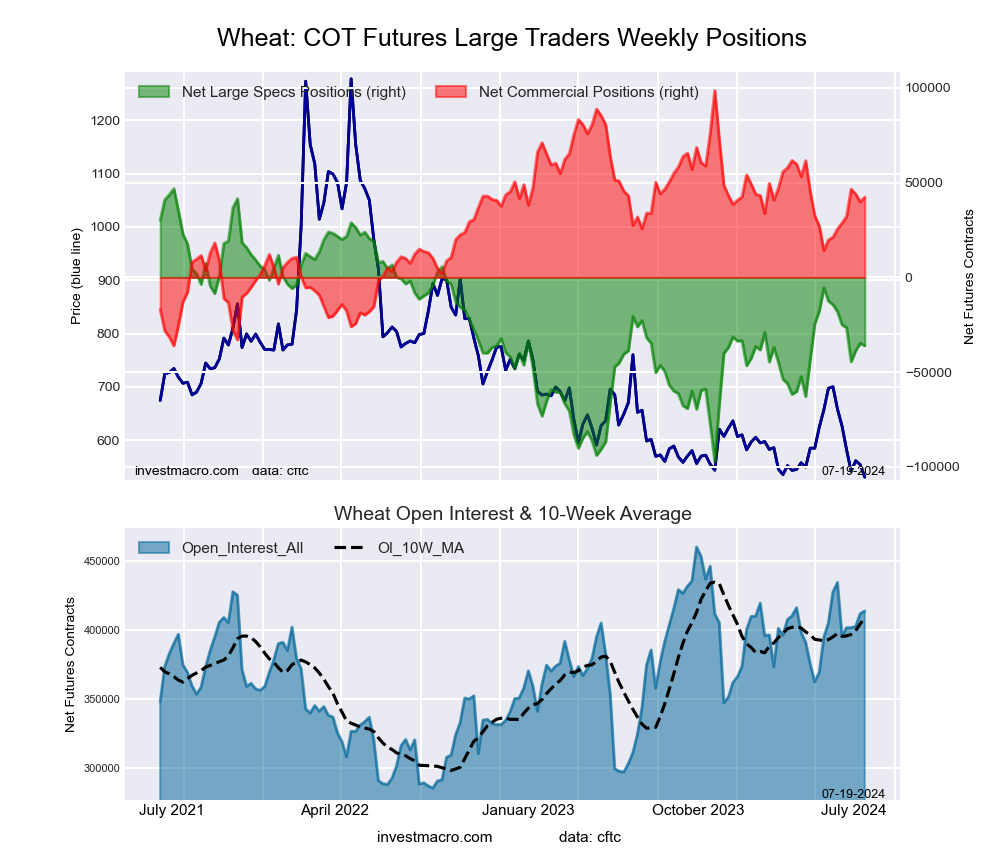
WHEAT Futures:
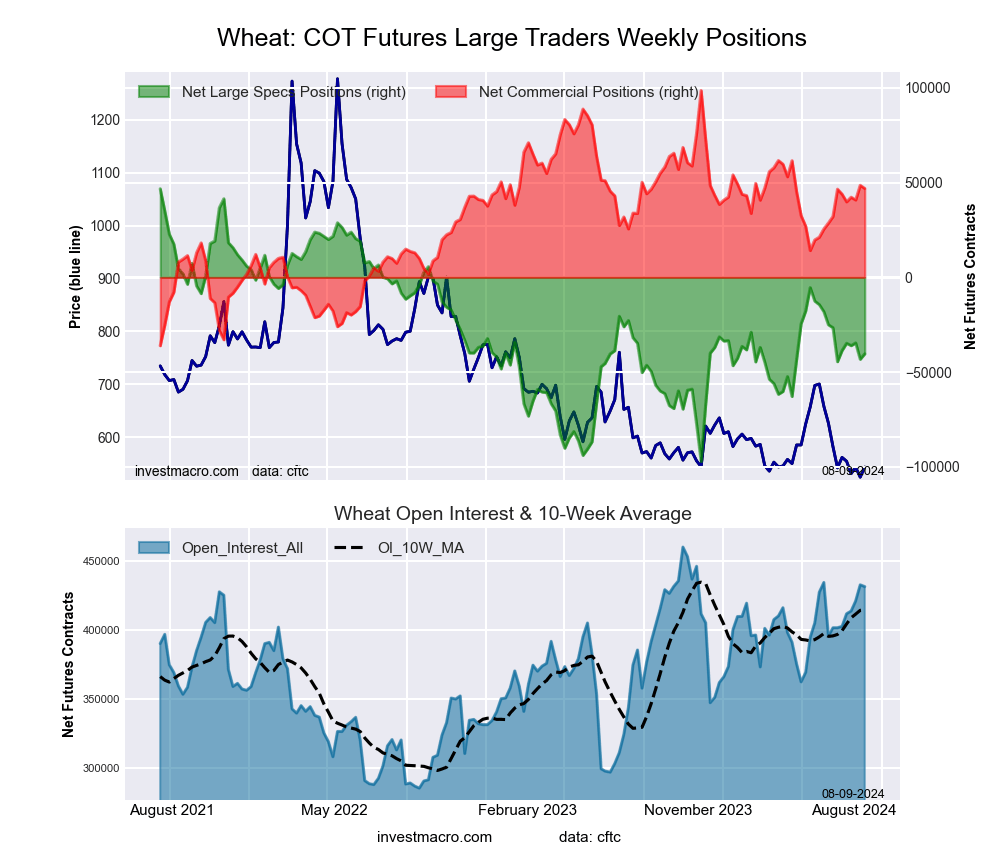 The WHEAT large speculator standing this week reached a net position of -40,385 contracts in the data reported through Tuesday. This was a weekly lift of 2,873 contracts from the previous week which had a total of -43,258 net contracts.
This week’s current strength score (the trader positioning range over the past three years, measured from 0 to 100) shows the speculators are currently Bearish with a score of 39.5 percent. The commercials are Bullish with a score of 61.6 percent and the small traders (not shown in chart) are Bearish with a score of 29.7 percent.
Price Trend-Following Model: Strong Downtrend
Our weekly trend-following model classifies the current market price position as: Strong Downtrend. The current action for the model is considered to be: Hold – Maintain Short Position.
| WHEAT Futures Statistics | SPECULATORS | COMMERCIALS | SMALL TRADERS |
| – Percent of Open Interest Longs: | 28.3 | 38.9 | 7.0 |
| – Percent of Open Interest Shorts: | 37.7 | 28.0 | 8.5 |
| – Net Position: | -40,385 | 46,947 | -6,562 |
| – Gross Longs: | 122,142 | 167,818 | 30,313 |
| – Gross Shorts: | 162,527 | 120,871 | 36,875 |
| – Long to Short Ratio: | 0.8 to 1 | 1.4 to 1 | 0.8 to 1 |
| NET POSITION TREND: | |||
| – Strength Index Score (3 Year Range Pct): | 39.5 | 61.6 | 29.7 |
| – Strength Index Reading (3 Year Range): | Bearish | Bullish | Bearish |
| NET POSITION MOVEMENT INDEX: | |||
| – 6-Week Change in Strength Index: | 2.9 | 0.3 | -22.2 |
Article By InvestMacro – Receive our weekly COT Newsletter
*COT Report: The COT data, released weekly to the public each Friday, is updated through the most recent Tuesday (data is 3 days old) and shows a quick view of how large speculators or non-commercials (for-profit traders) were positioned in the futures markets.
The CFTC categorizes trader positions according to commercial hedgers (traders who use futures contracts for hedging as part of the business), non-commercials (large traders who speculate to realize trading profits) and nonreportable traders (usually small traders/speculators) as well as their open interest (contracts open in the market at time of reporting). See CFTC criteria here.