By InvestMacro
Here are the latest charts and statistics for the Commitment of Traders (COT) reports data published by the Commodities Futures Trading Commission (CFTC).
The latest COT data is updated through Tuesday April 22nd and shows a quick view of how large traders (for-profit speculators and commercial hedgers) were positioned in the futures markets.
Weekly Speculator Changes led by SOFR 3-M & 10-Year Bonds
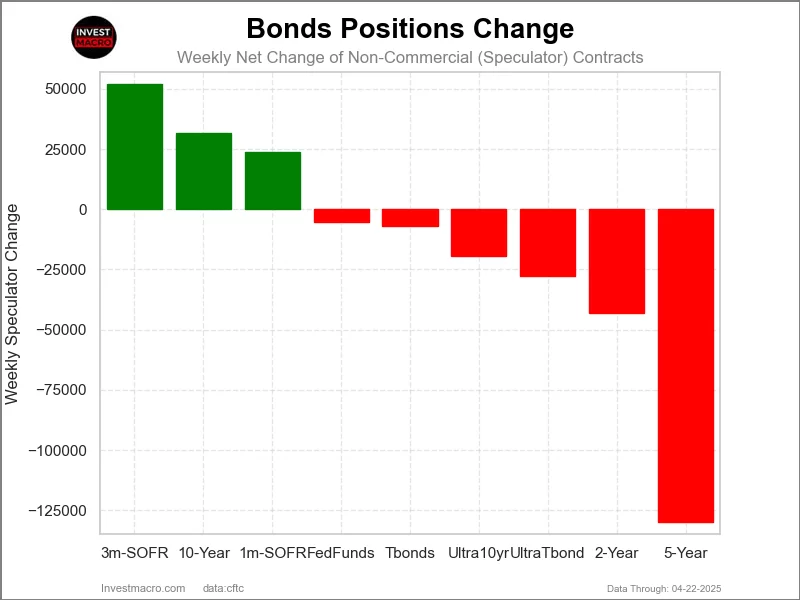
The COT bond market speculator bets were overall lower this week as just three out of the nine bond markets we cover had higher positioning while the other six markets had lower speculator contracts.
Leading the gains for the bond markets was the SOFR 3-Months (51,981 contracts) with the 10-Year Bonds (31,649 contracts) and the SOFR 1-Month (23,624 contracts) also showing positive weeks.
The bond markets with declines in speculator bets for the week were the 5-Year Bonds (-129,859 contracts), the 2-Year Bonds (-43,222 contracts), the Ultra Treasury Bonds (-27,545 contracts), the Ultra 10-Year Bonds (-19,489 contracts), the US Treasury Bonds (-6,902 contracts) and the Fed Funds (-5,442 contracts) also registering lower bets on the week.
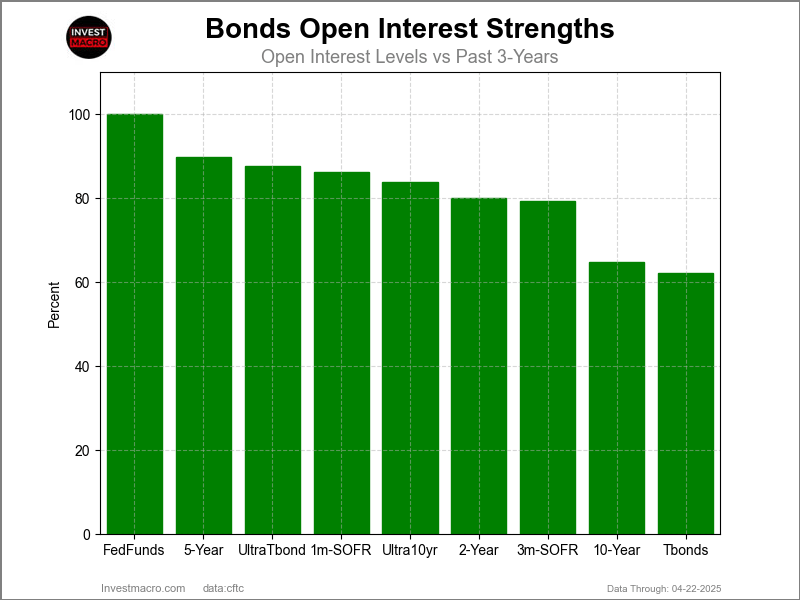
Bonds Data:
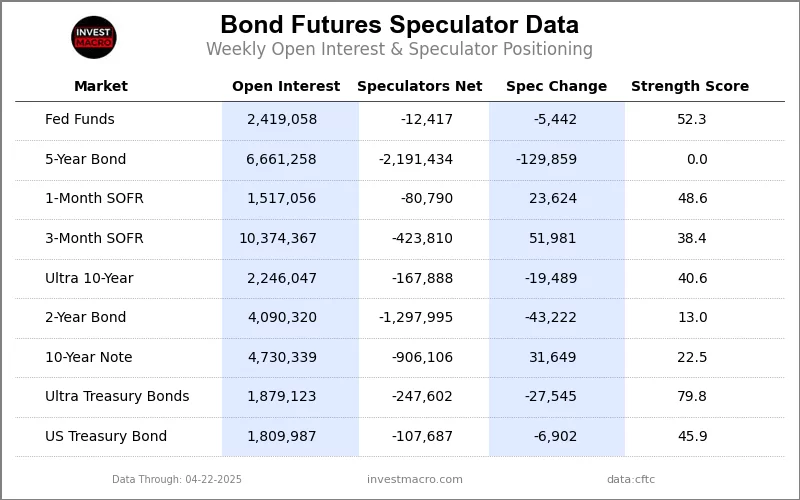
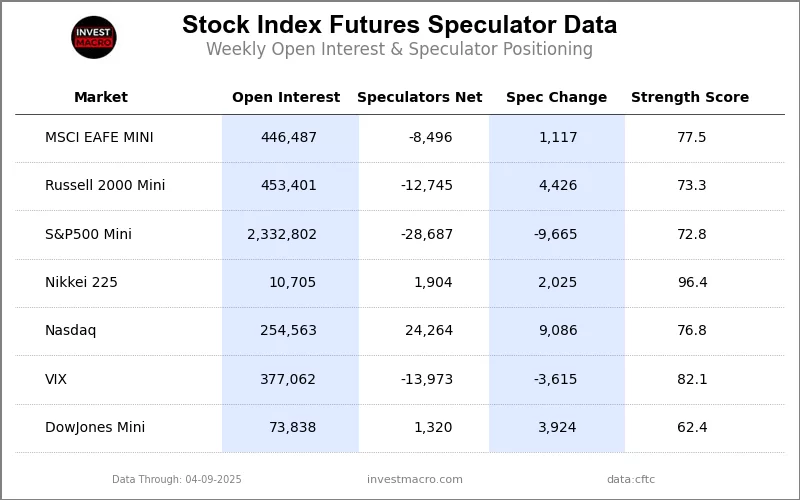
Legend: Open Interest | Speculators Current Net Position | Weekly Specs Change | Specs Strength Score compared to last 3-Years (0-100 range)
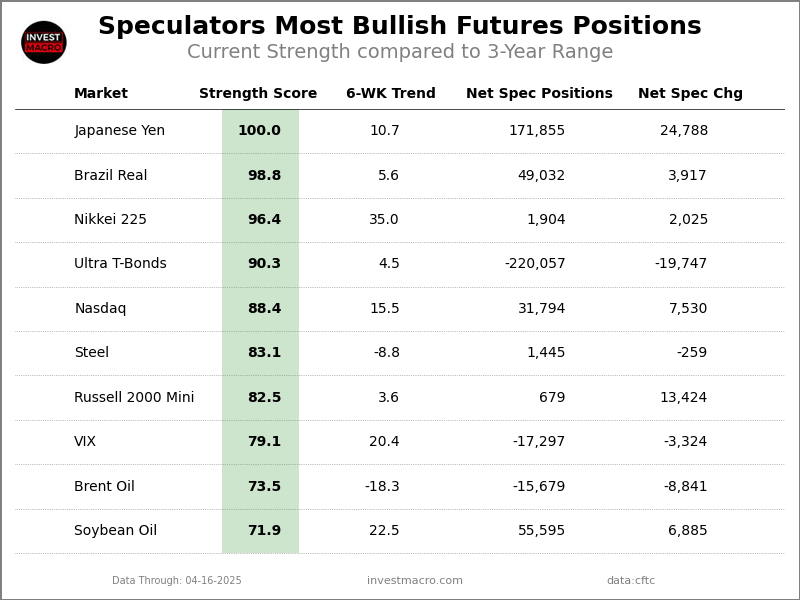
Strength Scores led by Ultra Treasury Bonds
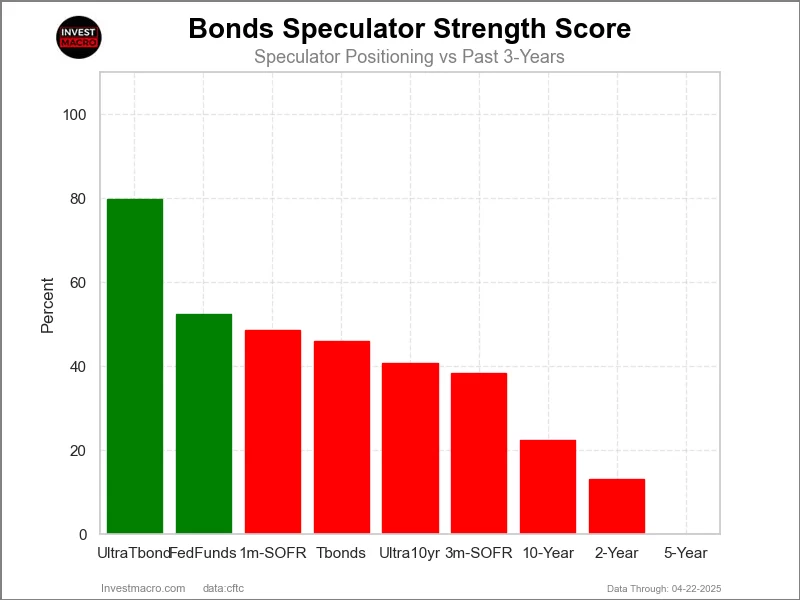
COT Strength Scores (a normalized measure of Speculator positions over a 3-Year range, from 0 to 100 where above 80 is Extreme-Bullish and below 20 is Extreme-Bearish) showed that the Ultra Treasury Bonds (80 percent) leads the bond markets this week. The Fed Funds (52 percent) comes in as the next highest in the weekly strength scores.
On the downside, the 5-Year Bond (0 percent) and the 2-Year Bonds (13 percent) come in at the lowest strength levels currently and are in Extreme-Bearish territory (below 20 percent). The next lowest strength scores were the the 10-Year Bond (23 percent), the SOFR 3-Months (38 percent) and the Ultra 10-Year Bonds (41 percent).
Strength Statistics:
Fed Funds (52.3 percent) vs Fed Funds previous week (53.3 percent)
2-Year Bond (13.0 percent) vs 2-Year Bond previous week (16.0 percent)
5-Year Bond (0.0 percent) vs 5-Year Bond previous week (6.2 percent)
10-Year Bond (22.5 percent) vs 10-Year Bond previous week (19.5 percent)
Ultra 10-Year Bond (40.6 percent) vs Ultra 10-Year Bond previous week (47.8 percent)
US Treasury Bond (45.9 percent) vs US Treasury Bond previous week (48.3 percent)
Ultra US Treasury Bond (79.8 percent) vs Ultra US Treasury Bond previous week (90.3 percent)
SOFR 1-Month (48.6 percent) vs SOFR 1-Month previous week (42.8 percent)
SOFR 3-Months (38.4 percent) vs SOFR 3-Months previous week (35.7 percent)
Fed Funds & SOFR 3-Months top the 6-Week Strength Trends
 COT Strength Score Trends (or move index, calculates the 6-week changes in strength scores) showed that the Fed Funds (34 percent) and the SOFR 3-Months (17 percent) lead the past six weeks trends for bonds. The Ultra Treasury Bonds (1 percent) are the next highest positive movers in the latest trends data.
The Ultra 10-Year Bond (-42.7 percent) and the US Treasury Bonds (-26 percent) lead the downside trend scores currently with the 10-Year Bonds (-16 percent) and the 5-Year Bonds (-15 percent) following next with lower trend scores.
Strength Trend Statistics:
Fed Funds (33.8 percent) vs Fed Funds previous week (43.1 percent)
2-Year Bond (-5.2 percent) vs 2-Year Bond previous week (-5.8 percent)
5-Year Bond (-15.2 percent) vs 5-Year Bond previous week (-12.6 percent)
10-Year Bond (-16.0 percent) vs 10-Year Bond previous week (-21.3 percent)
Ultra 10-Year Bond (-42.7 percent) vs Ultra 10-Year Bond previous week (-27.4 percent)
US Treasury Bond (-25.6 percent) vs US Treasury Bond previous week (-28.9 percent)
Ultra US Treasury Bond (1.4 percent) vs Ultra US Treasury Bond previous week (4.5 percent)
SOFR 1-Month (-10.3 percent) vs SOFR 1-Month previous week (-17.4 percent)
SOFR 3-Months (16.8 percent) vs SOFR 3-Months previous week (18.8 percent)
30-Day Federal Funds Futures:
 The 30-Day Federal Funds large speculator standing this week came in at a net position of -12,417 contracts in the data reported through Tuesday. This was a weekly decrease of -5,442 contracts from the previous week which had a total of -6,975 net contracts.
This week’s current strength score (the trader positioning range over the past three years, measured from 0 to 100) shows the speculators are currently Bullish with a score of 52.3 percent. The commercials are Bearish with a score of 42.7 percent and the small traders (not shown in chart) are Bullish with a score of 73.7 percent.
Price Trend-Following Model: Downtrend
Our weekly trend-following model classifies the current market price position as: Downtrend.
| 30-Day Federal Funds Statistics | SPECULATORS | COMMERCIALS | SMALL TRADERS |
| – Percent of Open Interest Longs: | 17.6 | 67.7 | 1.9 |
| – Percent of Open Interest Shorts: | 18.2 | 67.5 | 1.6 |
| – Net Position: | -12,417 | 3,500 | 8,917 |
| – Gross Longs: | 426,751 | 1,637,172 | 46,896 |
| – Gross Shorts: | 439,168 | 1,633,672 | 37,979 |
| – Long to Short Ratio: | 1.0 to 1 | 1.0 to 1 | 1.2 to 1 |
| NET POSITION TREND: | |||
| – Strength Index Score (3 Year Range Pct): | 52.3 | 42.7 | 73.7 |
| – Strength Index Reading (3 Year Range): | Bullish | Bearish | Bullish |
| NET POSITION MOVEMENT INDEX: | |||
| – 6-Week Change in Strength Index: | 33.8 | -32.1 | -8.6 |
Secured Overnight Financing Rate (3-Month) Futures:
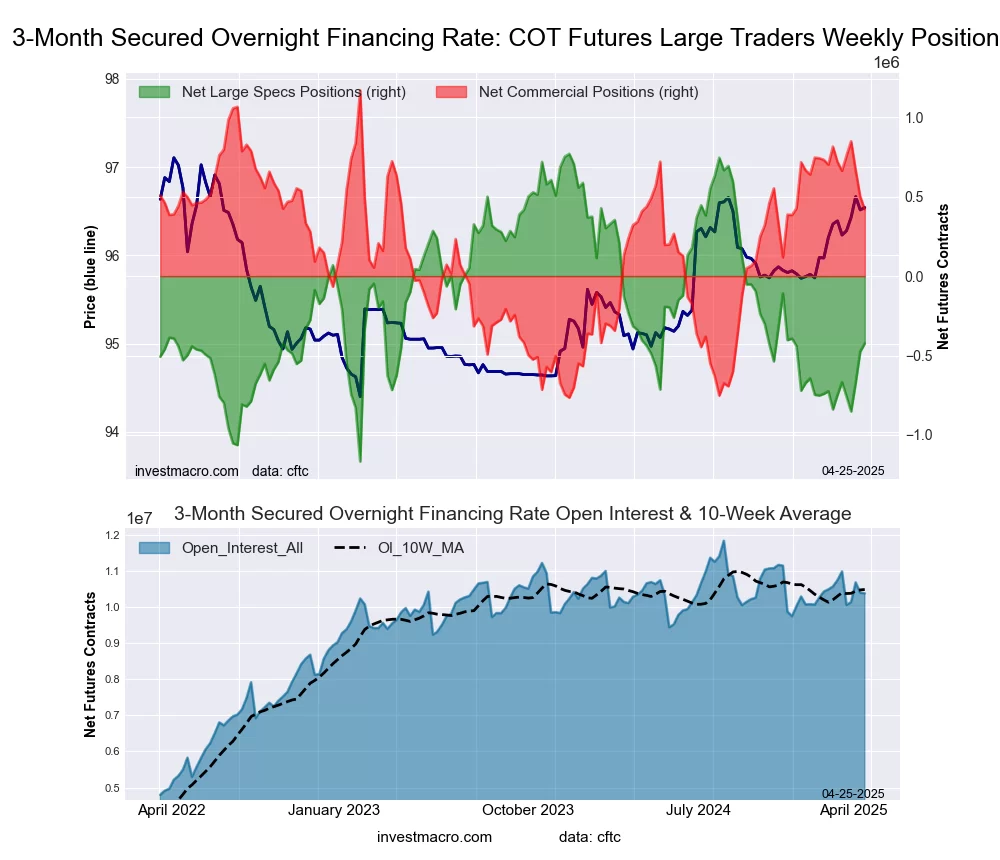 The Secured Overnight Financing Rate (3-Month) large speculator standing this week came in at a net position of -423,810 contracts in the data reported through Tuesday. This was a weekly boost of 51,981 contracts from the previous week which had a total of -475,791 net contracts.
This week’s current strength score (the trader positioning range over the past three years, measured from 0 to 100) shows the speculators are currently Bearish with a score of 38.4 percent. The commercials are Bullish with a score of 61.3 percent and the small traders (not shown in chart) are Bullish-Extreme with a score of 85.4 percent.
Price Trend-Following Model: Weak Uptrend
Our weekly trend-following model classifies the current market price position as: Weak Uptrend.
| SOFR 3-Months Statistics | SPECULATORS | COMMERCIALS | SMALL TRADERS |
| – Percent of Open Interest Longs: | 13.1 | 60.3 | 0.3 |
| – Percent of Open Interest Shorts: | 17.2 | 56.2 | 0.2 |
| – Net Position: | -423,810 | 420,573 | 3,237 |
| – Gross Longs: | 1,355,787 | 6,255,618 | 28,957 |
| – Gross Shorts: | 1,779,597 | 5,835,045 | 25,720 |
| – Long to Short Ratio: | 0.8 to 1 | 1.1 to 1 | 1.1 to 1 |
| NET POSITION TREND: | |||
| – Strength Index Score (3 Year Range Pct): | 38.4 | 61.3 | 85.4 |
| – Strength Index Reading (3 Year Range): | Bearish | Bullish | Bullish-Extreme |
| NET POSITION MOVEMENT INDEX: | |||
| – 6-Week Change in Strength Index: | 16.8 | -15.4 | -14.6 |
Individual Bond Markets:
Secured Overnight Financing Rate (1-Month) Futures:
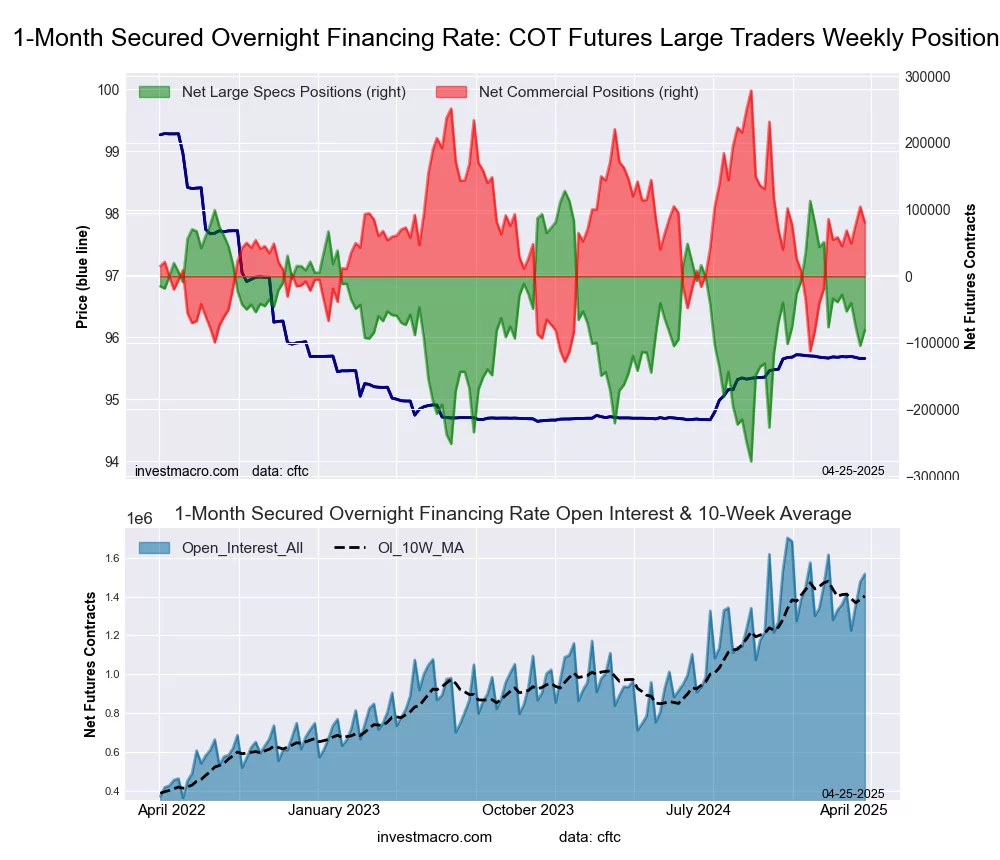 The Secured Overnight Financing Rate (1-Month) large speculator standing this week came in at a net position of -80,790 contracts in the data reported through Tuesday. This was a weekly increase of 23,624 contracts from the previous week which had a total of -104,414 net contracts.
This week’s current strength score (the trader positioning range over the past three years, measured from 0 to 100) shows the speculators are currently Bearish with a score of 48.6 percent. The commercials are Bullish with a score of 51.4 percent and the small traders (not shown in chart) are Bullish-Extreme with a score of 85.6 percent.
Price Trend-Following Model: Weak Uptrend
Our weekly trend-following model classifies the current market price position as: Weak Uptrend.
| SOFR 1-Month Statistics | SPECULATORS | COMMERCIALS | SMALL TRADERS |
| – Percent of Open Interest Longs: | 14.1 | 69.6 | 0.0 |
| – Percent of Open Interest Shorts: | 19.4 | 64.2 | 0.0 |
| – Net Position: | -80,790 | 80,731 | 59 |
| – Gross Longs: | 213,848 | 1,055,148 | 621 |
| – Gross Shorts: | 294,638 | 974,417 | 562 |
| – Long to Short Ratio: | 0.7 to 1 | 1.1 to 1 | 1.1 to 1 |
| NET POSITION TREND: | |||
| – Strength Index Score (3 Year Range Pct): | 48.6 | 51.4 | 85.6 |
| – Strength Index Reading (3 Year Range): | Bearish | Bullish | Bullish-Extreme |
| NET POSITION MOVEMENT INDEX: | |||
| – 6-Week Change in Strength Index: | -10.3 | 5.5 | 51.8 |
2-Year Treasury Note Futures:
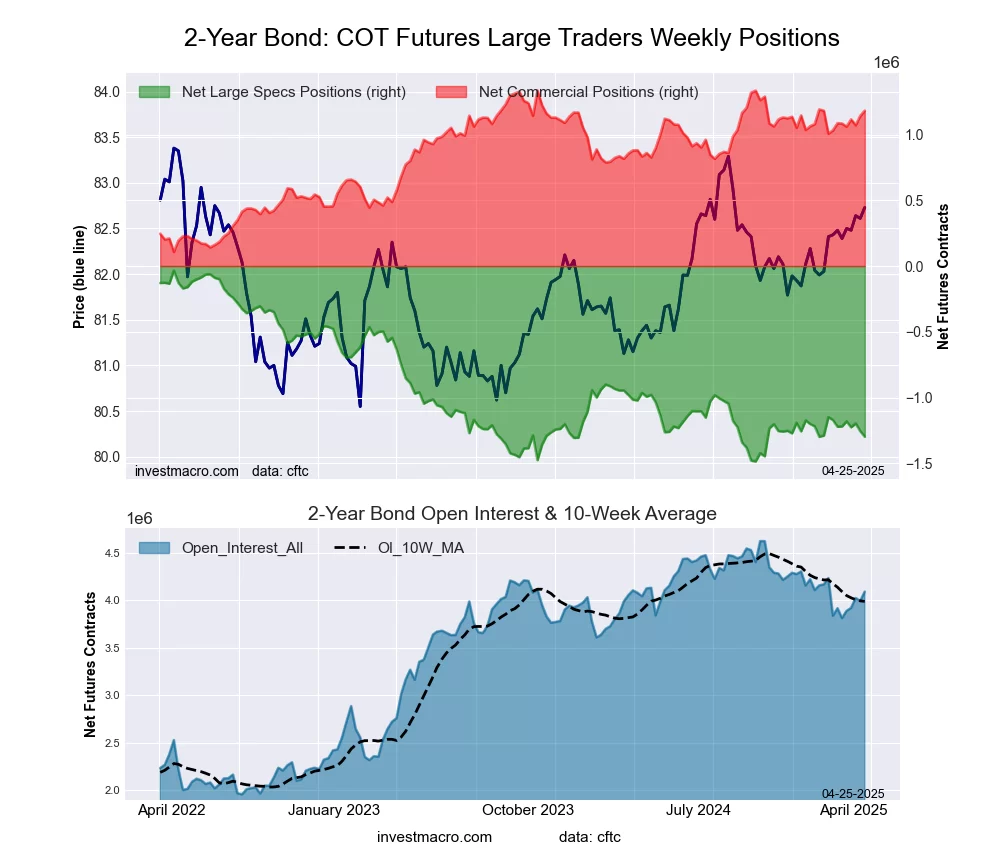 The 2-Year Treasury Note large speculator standing this week came in at a net position of -1,297,995 contracts in the data reported through Tuesday. This was a weekly decrease of -43,222 contracts from the previous week which had a total of -1,254,773 net contracts.
This week’s current strength score (the trader positioning range over the past three years, measured from 0 to 100) shows the speculators are currently Bearish-Extreme with a score of 13.0 percent. The commercials are Bullish-Extreme with a score of 87.5 percent and the small traders (not shown in chart) are Bullish with a score of 72.9 percent.
Price Trend-Following Model: Strong Uptrend
Our weekly trend-following model classifies the current market price position as: Strong Uptrend.
| 2-Year Treasury Note Statistics | SPECULATORS | COMMERCIALS | SMALL TRADERS |
| – Percent of Open Interest Longs: | 13.3 | 79.1 | 5.8 |
| – Percent of Open Interest Shorts: | 45.1 | 50.2 | 3.0 |
| – Net Position: | -1,297,995 | 1,181,471 | 116,524 |
| – Gross Longs: | 545,259 | 3,234,494 | 238,373 |
| – Gross Shorts: | 1,843,254 | 2,053,023 | 121,849 |
| – Long to Short Ratio: | 0.3 to 1 | 1.6 to 1 | 2.0 to 1 |
| NET POSITION TREND: | |||
| – Strength Index Score (3 Year Range Pct): | 13.0 | 87.5 | 72.9 |
| – Strength Index Reading (3 Year Range): | Bearish-Extreme | Bullish-Extreme | Bullish |
| NET POSITION MOVEMENT INDEX: | |||
| – 6-Week Change in Strength Index: | -5.2 | 7.8 | -6.4 |
5-Year Treasury Note Futures:
 The 5-Year Treasury Note large speculator standing this week came in at a net position of -2,191,434 contracts in the data reported through Tuesday. This was a weekly fall of -129,859 contracts from the previous week which had a total of -2,061,575 net contracts.
This week’s current strength score (the trader positioning range over the past three years, measured from 0 to 100) shows the speculators are currently Bearish-Extreme with a score of 0.0 percent. The commercials are Bullish-Extreme with a score of 100.0 percent and the small traders (not shown in chart) are Bullish-Extreme with a score of 87.0 percent.
Price Trend-Following Model: Strong Uptrend
Our weekly trend-following model classifies the current market price position as: Strong Uptrend.
| 5-Year Treasury Note Statistics | SPECULATORS | COMMERCIALS | SMALL TRADERS |
| – Percent of Open Interest Longs: | 8.1 | 84.0 | 6.4 |
| – Percent of Open Interest Shorts: | 41.0 | 54.0 | 3.5 |
| – Net Position: | -2,191,434 | 1,997,863 | 193,571 |
| – Gross Longs: | 536,772 | 5,596,235 | 429,630 |
| – Gross Shorts: | 2,728,206 | 3,598,372 | 236,059 |
| – Long to Short Ratio: | 0.2 to 1 | 1.6 to 1 | 1.8 to 1 |
| NET POSITION TREND: | |||
| – Strength Index Score (3 Year Range Pct): | 0.0 | 100.0 | 87.0 |
| – Strength Index Reading (3 Year Range): | Bearish-Extreme | Bullish-Extreme | Bullish-Extreme |
| NET POSITION MOVEMENT INDEX: | |||
| – 6-Week Change in Strength Index: | -15.2 | 17.4 | 4.8 |
10-Year Treasury Note Futures:
 The 10-Year Treasury Note large speculator standing this week came in at a net position of -906,106 contracts in the data reported through Tuesday. This was a weekly advance of 31,649 contracts from the previous week which had a total of -937,755 net contracts.
This week’s current strength score (the trader positioning range over the past three years, measured from 0 to 100) shows the speculators are currently Bearish with a score of 22.5 percent. The commercials are Bullish with a score of 72.3 percent and the small traders (not shown in chart) are Bullish-Extreme with a score of 94.0 percent.
Price Trend-Following Model: Uptrend
Our weekly trend-following model classifies the current market price position as: Uptrend.
| 10-Year Treasury Note Statistics | SPECULATORS | COMMERCIALS | SMALL TRADERS |
| – Percent of Open Interest Longs: | 10.5 | 77.5 | 9.6 |
| – Percent of Open Interest Shorts: | 29.6 | 61.3 | 6.6 |
| – Net Position: | -906,106 | 764,191 | 141,915 |
| – Gross Longs: | 495,027 | 3,663,652 | 452,338 |
| – Gross Shorts: | 1,401,133 | 2,899,461 | 310,423 |
| – Long to Short Ratio: | 0.4 to 1 | 1.3 to 1 | 1.5 to 1 |
| NET POSITION TREND: | |||
| – Strength Index Score (3 Year Range Pct): | 22.5 | 72.3 | 94.0 |
| – Strength Index Reading (3 Year Range): | Bearish | Bullish | Bullish-Extreme |
| NET POSITION MOVEMENT INDEX: | |||
| – 6-Week Change in Strength Index: | -16.0 | 15.0 | 13.5 |
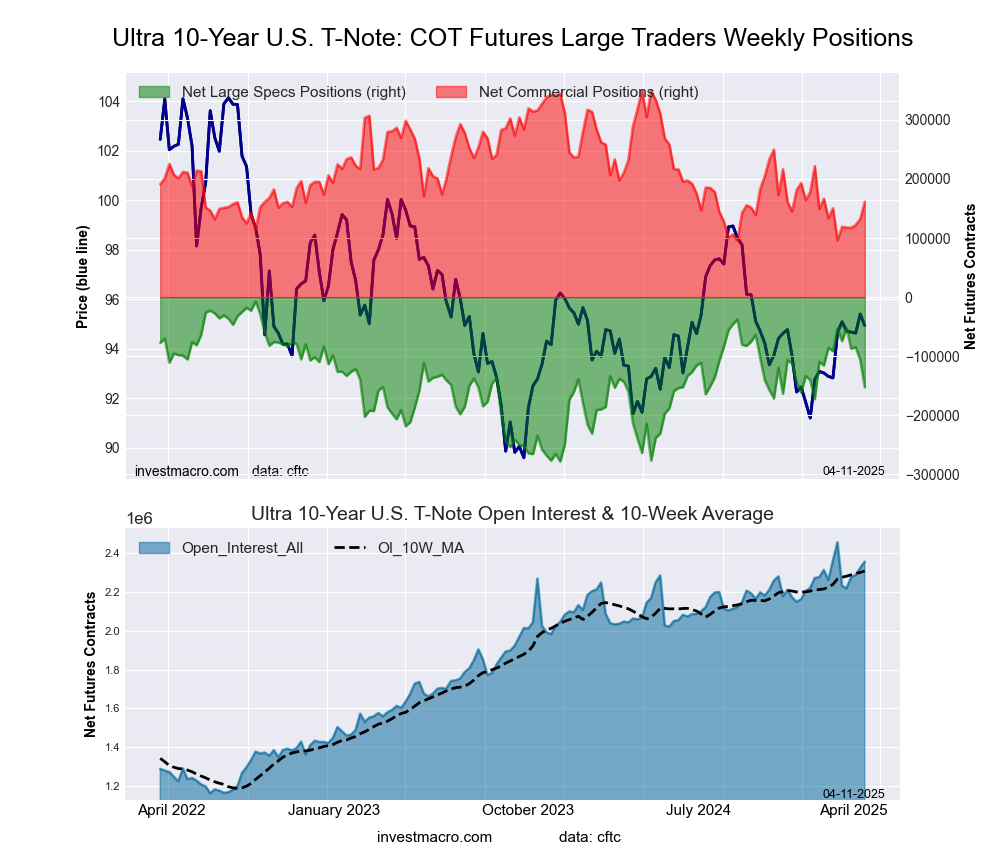
Ultra 10-Year Notes Futures:
 The Ultra 10-Year Notes large speculator standing this week came in at a net position of -167,888 contracts in the data reported through Tuesday. This was a weekly reduction of -19,489 contracts from the previous week which had a total of -148,399 net contracts.
This week’s current strength score (the trader positioning range over the past three years, measured from 0 to 100) shows the speculators are currently Bearish with a score of 40.6 percent. The commercials are Bearish with a score of 38.1 percent and the small traders (not shown in chart) are Bullish-Extreme with a score of 88.9 percent.
Price Trend-Following Model: Weak Uptrend
Our weekly trend-following model classifies the current market price position as: Weak Uptrend.
| Ultra 10-Year Notes Statistics | SPECULATORS | COMMERCIALS | SMALL TRADERS |
| – Percent of Open Interest Longs: | 12.4 | 76.8 | 10.0 |
| – Percent of Open Interest Shorts: | 19.8 | 68.2 | 11.1 |
| – Net Position: | -167,888 | 192,447 | -24,559 |
| – Gross Longs: | 277,763 | 1,725,230 | 224,733 |
| – Gross Shorts: | 445,651 | 1,532,783 | 249,292 |
| – Long to Short Ratio: | 0.6 to 1 | 1.1 to 1 | 0.9 to 1 |
| NET POSITION TREND: | |||
| – Strength Index Score (3 Year Range Pct): | 40.6 | 38.1 | 88.9 |
| – Strength Index Reading (3 Year Range): | Bearish | Bearish | Bullish-Extreme |
| NET POSITION MOVEMENT INDEX: | |||
| – 6-Week Change in Strength Index: | -42.7 | 29.4 | 29.2 |
US Treasury Bonds Futures:
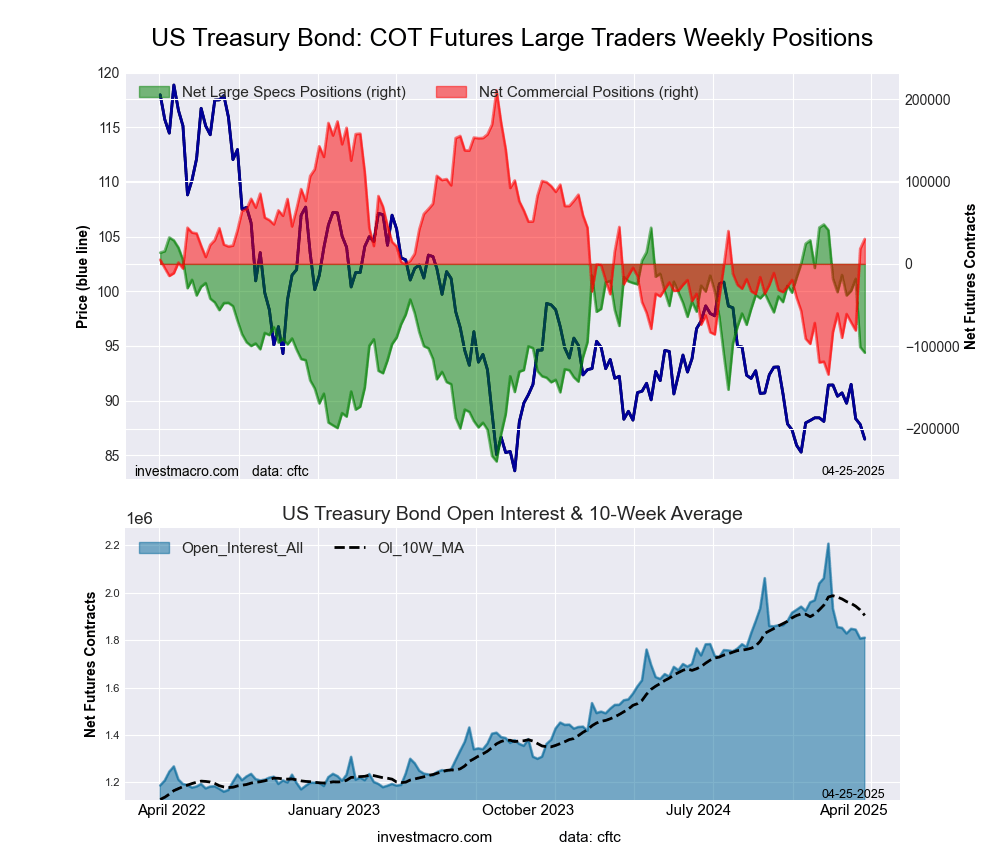 The US Treasury Bonds large speculator standing this week came in at a net position of -107,687 contracts in the data reported through Tuesday. This was a weekly fall of -6,902 contracts from the previous week which had a total of -100,785 net contracts.
This week’s current strength score (the trader positioning range over the past three years, measured from 0 to 100) shows the speculators are currently Bearish with a score of 45.9 percent. The commercials are Bearish with a score of 47.7 percent and the small traders (not shown in chart) are Bullish with a score of 70.7 percent.
Price Trend-Following Model: Weak Uptrend
Our weekly trend-following model classifies the current market price position as: Weak Uptrend.
| US Treasury Bonds Statistics | SPECULATORS | COMMERCIALS | SMALL TRADERS |
| – Percent of Open Interest Longs: | 11.2 | 75.8 | 11.8 |
| – Percent of Open Interest Shorts: | 17.1 | 74.1 | 7.6 |
| – Net Position: | -107,687 | 30,179 | 77,508 |
| – Gross Longs: | 202,519 | 1,371,696 | 214,303 |
| – Gross Shorts: | 310,206 | 1,341,517 | 136,795 |
| – Long to Short Ratio: | 0.7 to 1 | 1.0 to 1 | 1.6 to 1 |
| NET POSITION TREND: | |||
| – Strength Index Score (3 Year Range Pct): | 45.9 | 47.7 | 70.7 |
| – Strength Index Reading (3 Year Range): | Bearish | Bearish | Bullish |
| NET POSITION MOVEMENT INDEX: | |||
| – 6-Week Change in Strength Index: | -25.6 | 26.2 | -12.0 |
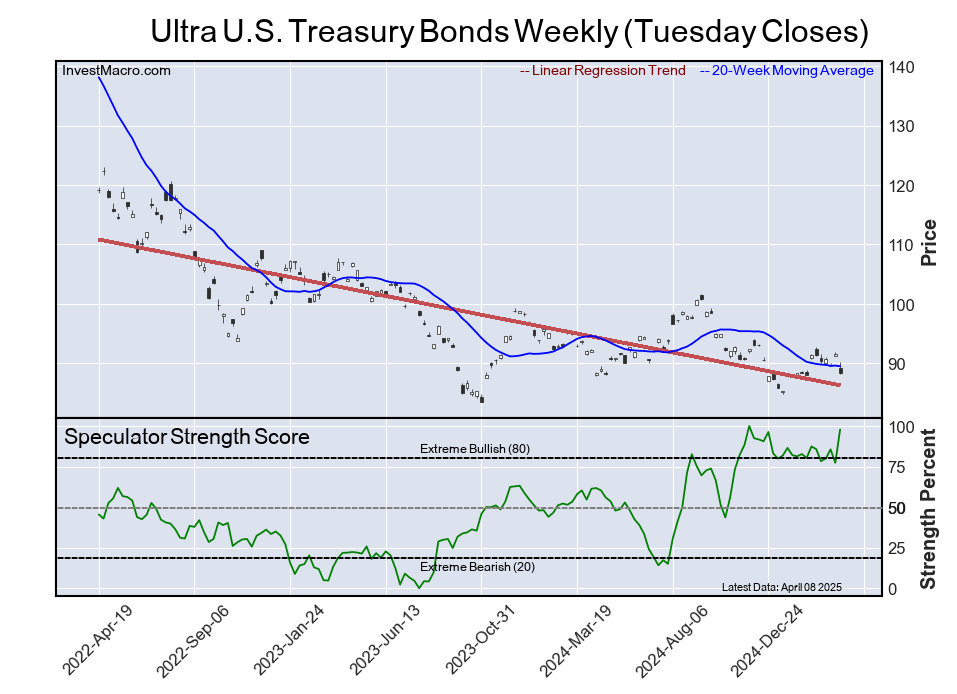
Ultra US Treasury Bonds Futures:
 The Ultra US Treasury Bonds large speculator standing this week came in at a net position of -247,602 contracts in the data reported through Tuesday. This was a weekly fall of -27,545 contracts from the previous week which had a total of -220,057 net contracts.
This week’s current strength score (the trader positioning range over the past three years, measured from 0 to 100) shows the speculators are currently Bullish with a score of 79.8 percent. The commercials are Bearish with a score of 22.5 percent and the small traders (not shown in chart) are Bullish with a score of 52.7 percent.
Price Trend-Following Model: Weak Uptrend
Our weekly trend-following model classifies the current market price position as: Weak Uptrend.
| Ultra US Treasury Bonds Statistics | SPECULATORS | COMMERCIALS | SMALL TRADERS |
| – Percent of Open Interest Longs: | 6.5 | 82.9 | 9.2 |
| – Percent of Open Interest Shorts: | 19.6 | 71.4 | 7.5 |
| – Net Position: | -247,602 | 216,313 | 31,289 |
| – Gross Longs: | 121,329 | 1,557,962 | 173,007 |
| – Gross Shorts: | 368,931 | 1,341,649 | 141,718 |
| – Long to Short Ratio: | 0.3 to 1 | 1.2 to 1 | 1.2 to 1 |
| NET POSITION TREND: | |||
| – Strength Index Score (3 Year Range Pct): | 79.8 | 22.5 | 52.7 |
| – Strength Index Reading (3 Year Range): | Bullish | Bearish | Bullish |
| NET POSITION MOVEMENT INDEX: | |||
| – 6-Week Change in Strength Index: | 1.4 | -0.8 | -2.4 |
Article By InvestMacro – Receive our weekly COT Newsletter
*COT Report: The COT data, released weekly to the public each Friday, is updated through the most recent Tuesday (data is 3 days old) and shows a quick view of how large speculators or non-commercials (for-profit traders) were positioned in the futures markets.
The CFTC categorizes trader positions according to commercial hedgers (traders who use futures contracts for hedging as part of the business), non-commercials (large traders who speculate to realize trading profits) and nonreportable traders (usually small traders/speculators) as well as their open interest (contracts open in the market at time of reporting). See CFTC criteria here.