By InvestMacro
The latest update for the weekly Commitment of Traders (COT) report was released by the Commodity Futures Trading Commission (CFTC) on Friday for data ending on Tuesday May 19th.
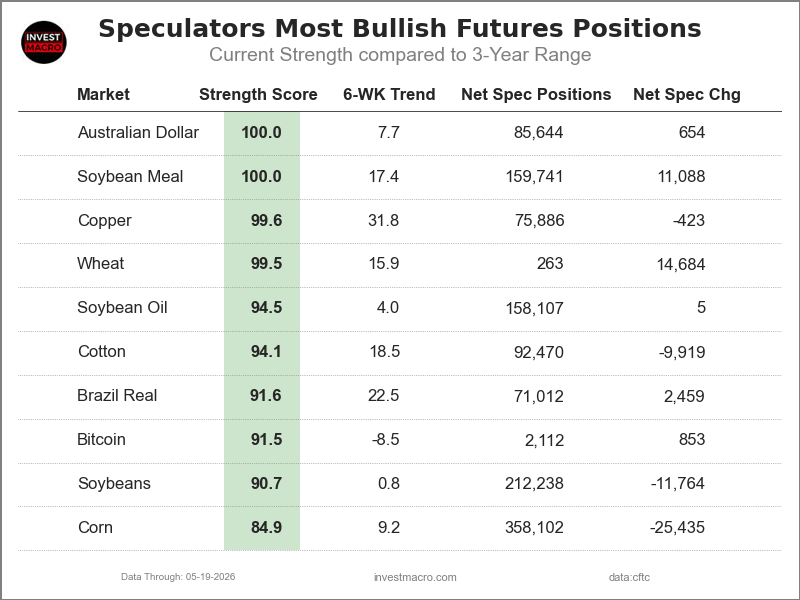
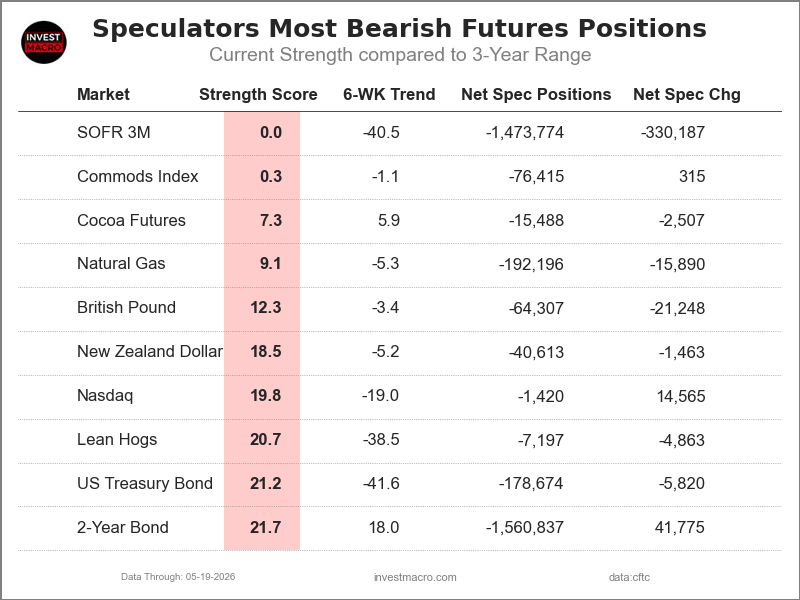
This weekly Extreme Positions report highlights the Most Bullish and Most Bearish Positions for the speculator category and is a current snapshot of how speculators were positioned as of Tuesday. Extreme positioning in these markets can foreshadow strong moves in the underlying market.
To signify an extreme position, we use the Strength Index (also known as the COT Index) of each instrument, a common method of measuring COT data. The Strength Index is simply a comparison of current trader positions against the range of positions over the previous 3 years. We use over 80 percent as extremely bullish and under 20 percent as extremely bearish (Compare Strength Index scores across all markets in the data table or cot leaders table).
The 6-WK Trend score is the change in the Strength Index over the past 6 weeks and signals how strong and which way the Strength Index is going.
Free Reports:
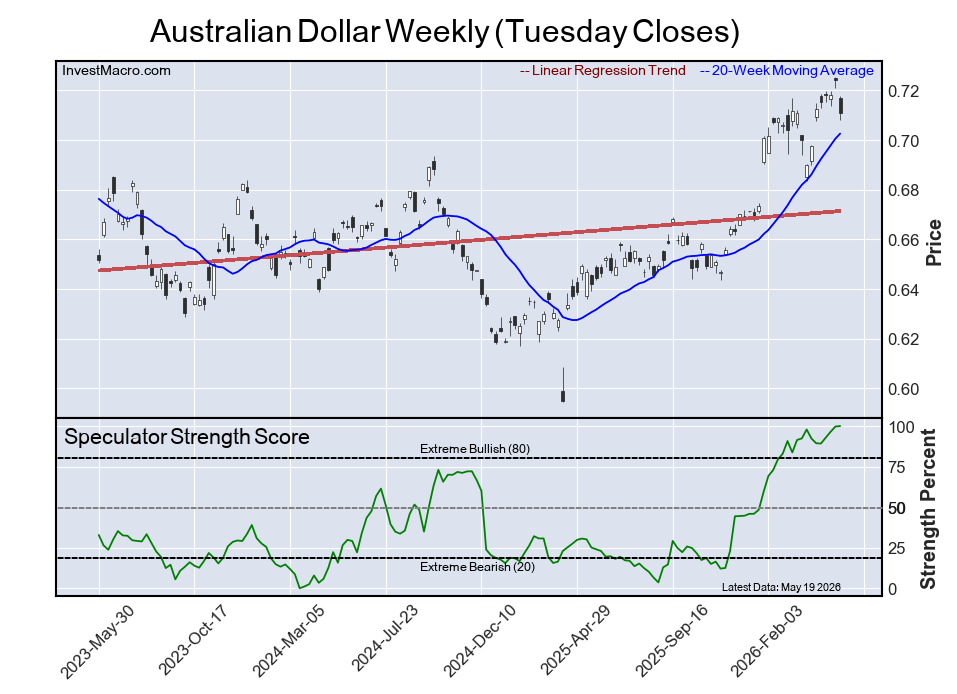
The Australian Dollar speculator position comes in tied at the top of this week’s extreme standings as the AUD speculator level resides at a 100 percent score of its 3-year range.
The six-week trend for the speculator strength score came in at an advance by 8 percentage points this week. The overall speculator position was 85,644 net contracts this week with an increase of 654 contracts in the weekly speculator bets.
Speculators or Non-Commercials Notes:
Speculators, classified as non-commercial traders by the CFTC, are made up of large commodity funds, hedge funds and other significant for-profit participants. The Specs are generally regarded as trend-followers in their behavior towards price action – net speculator bets and prices tend to go in the same directions. These traders often look to buy when prices are rising and sell when prices are falling. To illustrate this point, many times speculator contracts can be found at their most extremes (bullish or bearish) when prices are also close to their highest or lowest levels.
These extreme levels can be dangerous for the large speculators as the trade is most crowded, there is less trading ammunition still sitting on the sidelines to push the trend further and prices have moved a significant distance. When the trend becomes exhausted, some speculators take profits while others look to also exit positions when prices fail to continue in the same direction. This process usually plays out over many months to years and can ultimately create a reverse effect where prices start to fall and speculators start a process of selling when prices are falling.
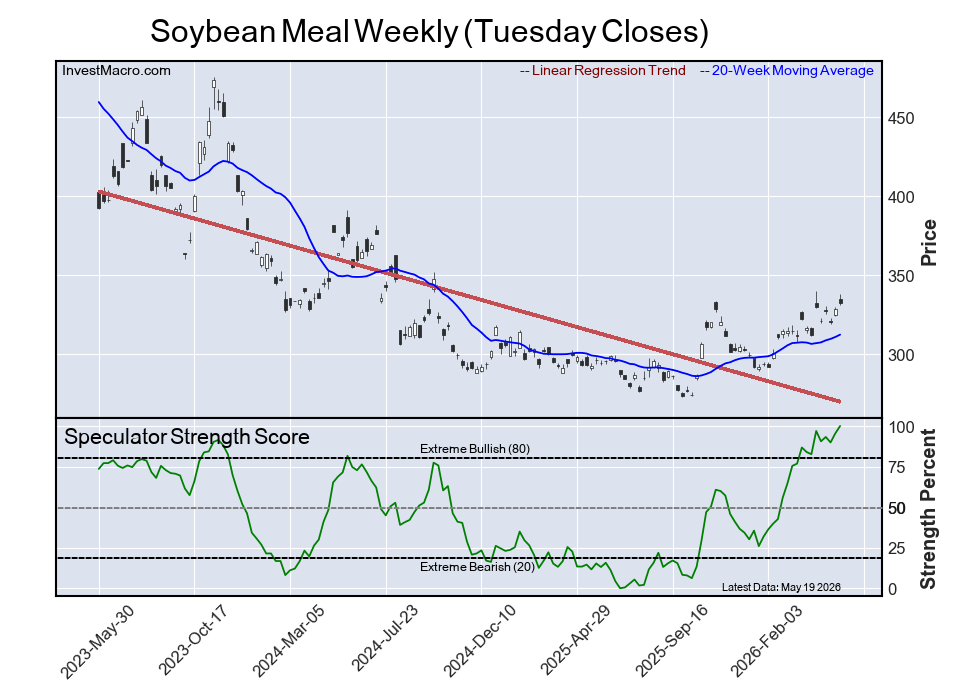
The Soybean Meal speculator position also comes in tied atop the extreme standings this week with the Soybean Meal speculator level at a 100 percent score of its 3-year range.
The six-week trend for the percent strength score was a boost by 17 percentage points this week. The speculator position registered 159,741 net contracts this week with an advance of 11,088 contracts in speculator bets.
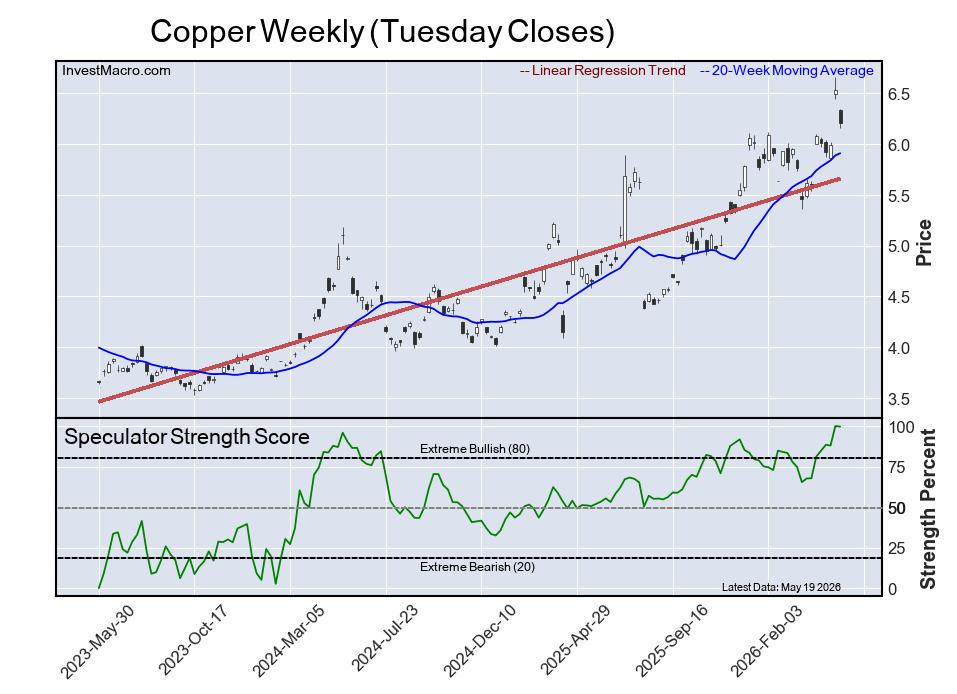
The Copper speculator position comes in as the most bullish extreme standing this week. The Copper speculator level is currently at a 99 percent score of its 3-year range.
The six-week trend for the percent strength score totaled a gain of 32 percentage points this week. The overall net speculator position was a total of 75,886 net contracts this week with a decrease of -423 contract in the weekly speculator bets.
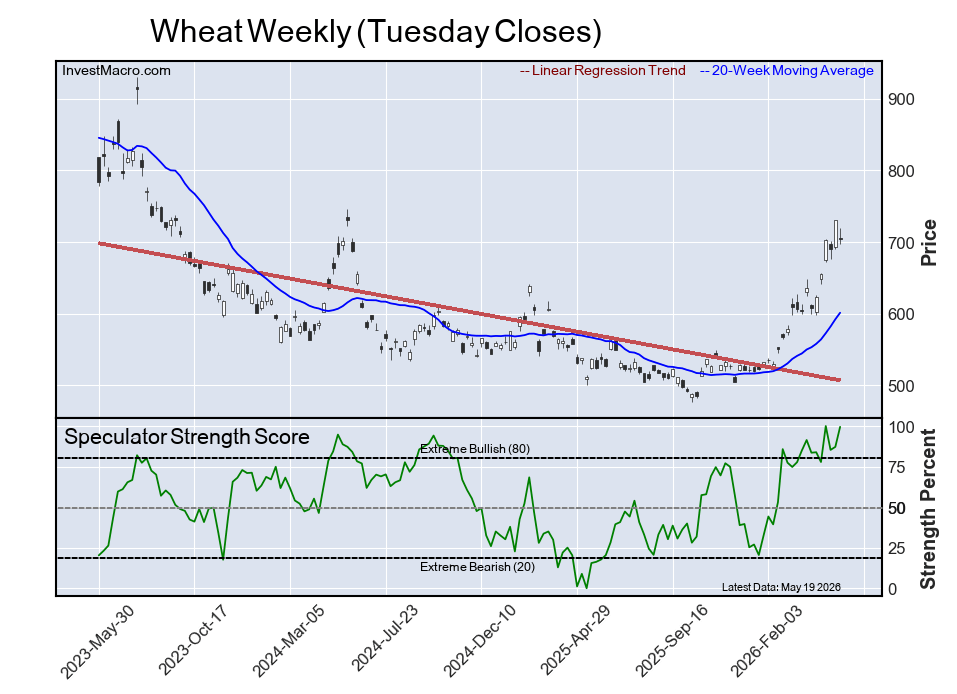
The Wheat speculator position comes up number four in the extreme standings this week with the Wheat speculator level at a 99 percent score of its 3-year range.
The six-week trend for the speculator strength score totaled a lift of 16 percentage points this week and the overall speculator position was 263 net contracts this week with an addition of 14,684 contracts in the speculator bets.
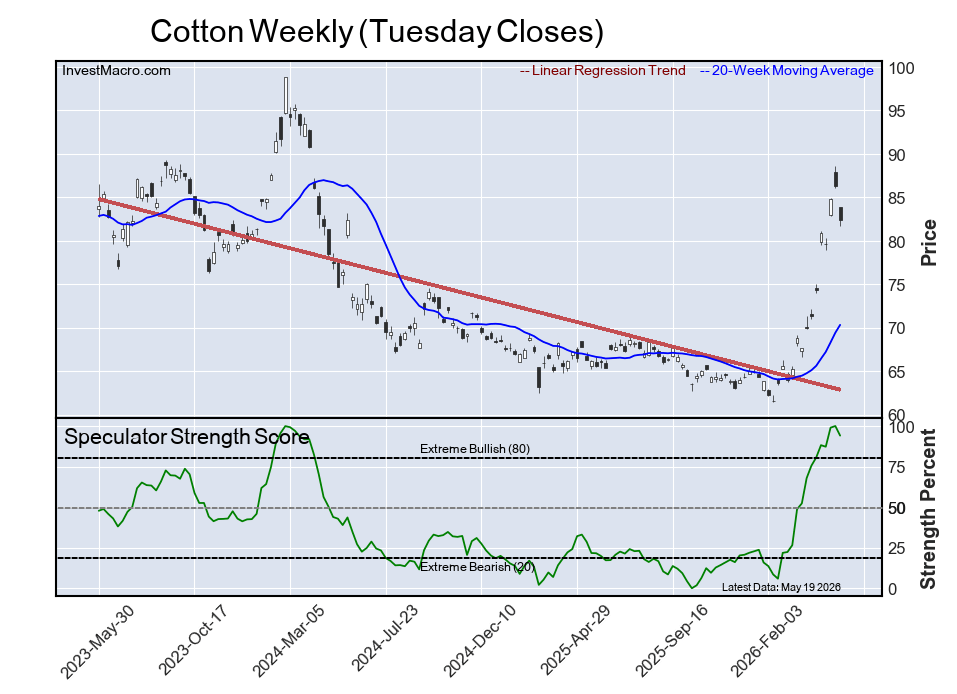
The Cotton speculator position rounds out the top five in this week’s bullish extreme standings. The Cotton speculator level sits at a 94 percent score of its 3-year range and the six-week trend for the speculator strength score was a lift of 19 percentage points this week.
The speculator position was 92,470 net contracts this week with a retreat of -9,919 contracts in the weekly speculator bets.
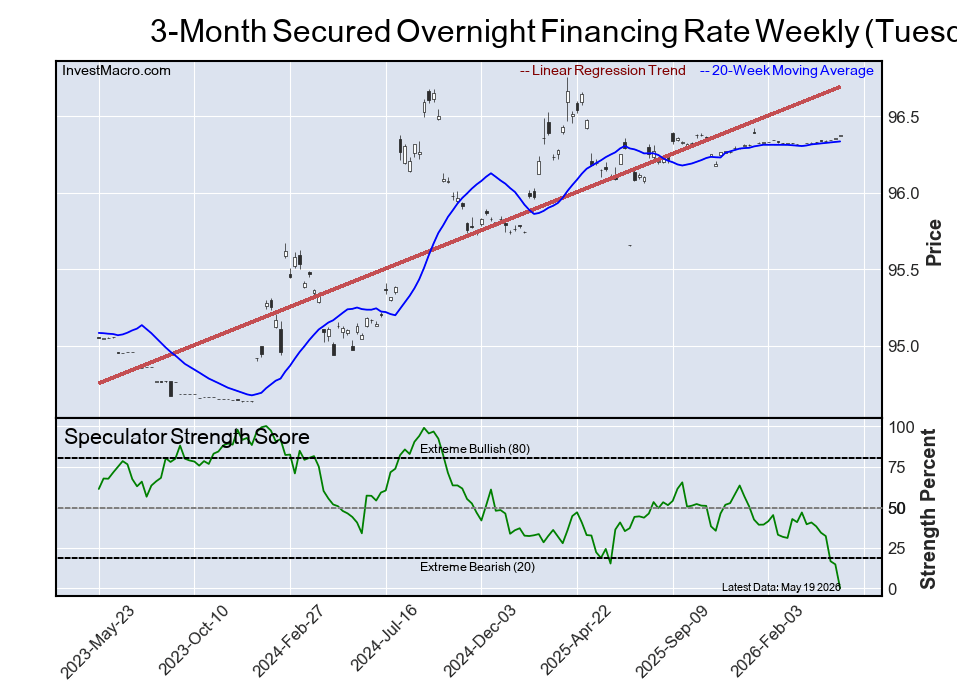
The 3-Month Secured Overnight Financing Rate speculator position comes in as the most bearish extreme standing this week. The SOFR 3-Months speculator level is at a 0 percent score of its 3-year range.
The six-week trend for the speculator strength score was a fall by -41 percentage points this week. The overall speculator position was -1,473,774 net contracts this week with a decline of -330,187 contracts in the speculator bets.
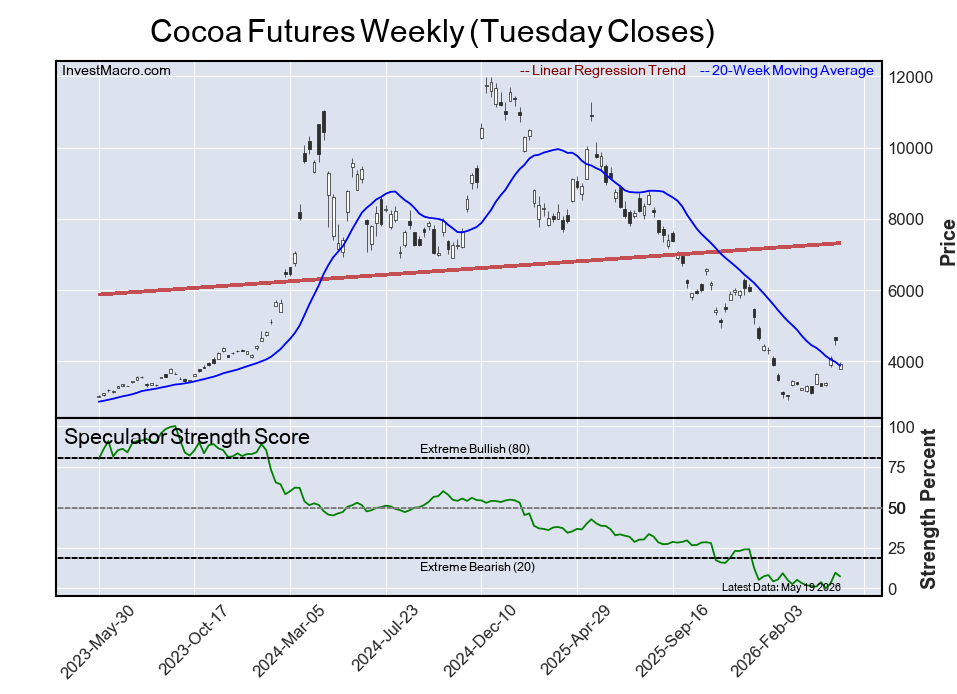
The Cocoa Futures speculator position comes in next for the most bearish extreme standing on the week. The Cocoa speculator level is at a 7 percent score of its 3-year range.
The six-week trend for the speculator strength score was a boost of 6 percentage points this week while the speculator position was -15,488 net contracts this week with a fall of -2,507 contracts in the weekly speculator bets.
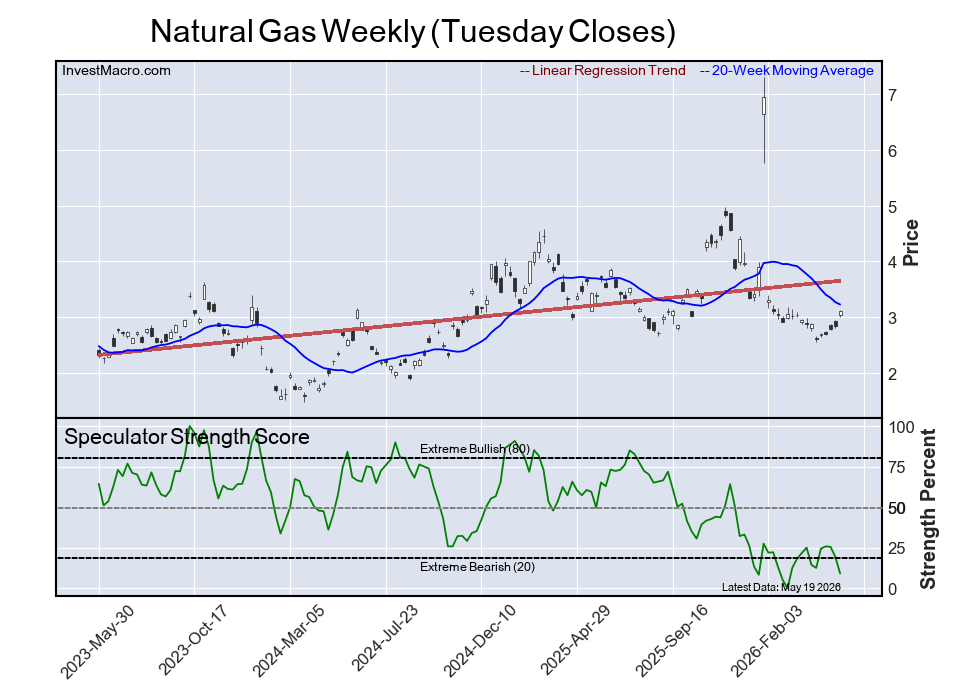
The Natural Gas speculator position comes in as third most bearish extreme standing of the week. The Natural Gas speculator level resides at a 9 percent score of its 3-year range.
The six-week trend for the speculator strength score was a decline by -5 percentage points this week and the overall speculator position was -192,196 net contracts this week with a decrease of -15,890 contracts in the speculator bets.
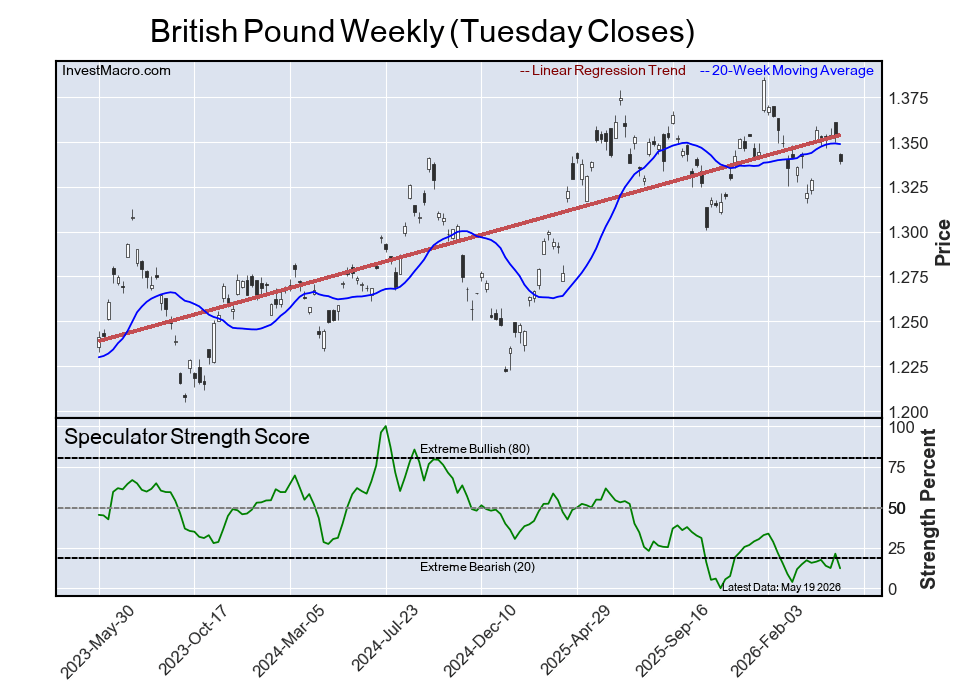
The British Pound speculator position comes in as this week’s fourth most bearish extreme standing. The GBP speculator level is at a 12 percent score of its 3-year range.
The six-week trend for the speculator strength score was a decline of -3 percentage points this week. The speculator position was -64,307 net contracts this week with a reduction of -21,248 contracts in the weekly speculator bets.
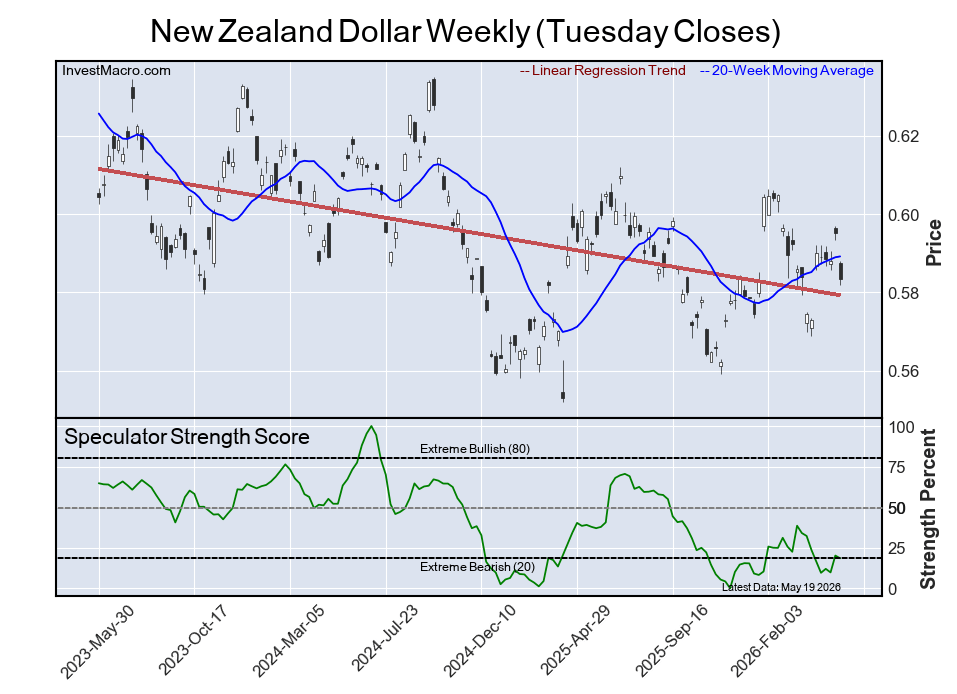
Next, the New Zealand Dollar speculator position comes in as the fifth most bearish extreme standing for this week. The NZD speculator level is at a 18 percent score of its 3-year range.
The six-week trend for the speculator strength score was a decline of -5 percentage points this week. The speculator position was -40,613 net contracts this week with a decrease of -1,463 contracts in the weekly speculator bets.
Article By InvestMacro – Receive our weekly COT Reports by Email
*COT Report: The COT data, released weekly to the public each Friday, is updated through the most recent Tuesday (data is 3 days old) and shows a quick view of how large speculators or non-commercials (for-profit traders) were positioned in the futures markets.
The CFTC categorizes trader positions according to commercial hedgers (traders who use futures contracts for hedging as part of the business), non-commercials (large traders who speculate to realize trading profits) and nonreportable traders (usually small traders/speculators) as well as their open interest (contracts open in the market at time of reporting).See CFTC criteria here.
All information and opinions on this website and contained in this article are for general informational purposes only and do not constitute investment advice.
By Jeffrey Young, Georgia Institute of Technology You’ve probably heard artificial intelligence models described as…
Source: Barry Dawes (7/23/26) Barry Dawes of Martin Place Securities shares his analysis of the…
By JustMarkets The US stock indices ended Thursday’s session with a notable decline amid a…
By Analytical Department RoboForex USD/JPY soared to 163.81 on Friday, marking a new 40-year high.…
By JustMarkets The US equities ended Wednesday’s session lower amid investor caution ahead of the…
By Analytical Department RoboForex EUR/USD rose to 1.1429 on Thursday, with the US dollar continuing…
This website uses cookies.