By InvestMacro | COT | Data Tables | COT Leaders | Downloads | COT Newsletter
Here are the latest charts and statistics for the Commitment of Traders (COT) data published by the Commodities Futures Trading Commission (CFTC).
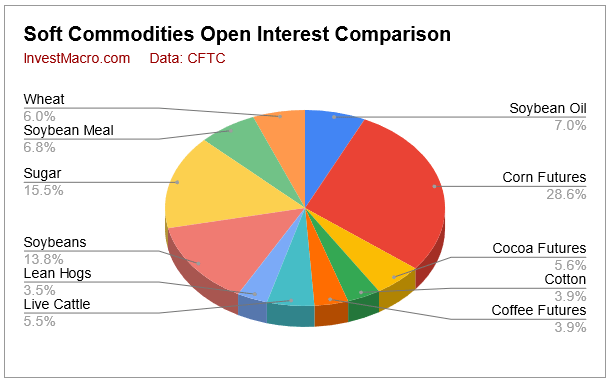
The latest COT data is updated through Tuesday May 31st and shows a quick view of how large traders (for-profit speculators and commercial entities) were positioned in the futures markets.
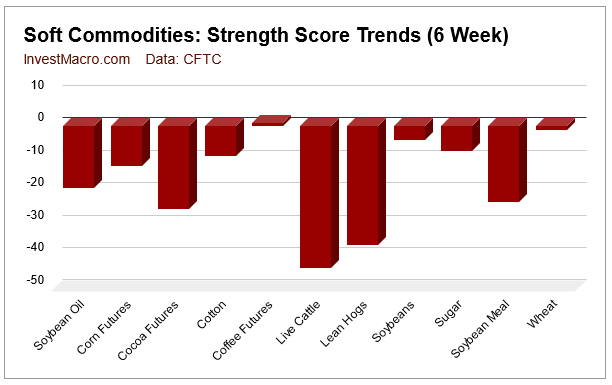
Soft Commodities speculator bets were mostly lower again this week as only three out of the eleven softs markets we cover had higher positioning this week while the other eight markets had lower positions. Leading the gains for the soft commodities was Coffee (5,943 contracts) and Lean Hogs (1,859 contracts) with Cocoa (1,570 contracts) also showing a positive week. Meanwhile, leading the declines in speculator bets this week were Corn (-23,648 contracts) and Sugar (-7,807 contracts) with Soybean Oil (-4,455 contracts), Wheat (-4,035 contracts), Live Cattle (-3,207 contracts), Soybeans (-2,290 contracts), Cotton (-1,836 contracts) and Soybean Meal (-1,153 contracts) also coming in with lower bets on the week.
Free Reports:
| May-31-2022 | OI | OI-Index | Spec-Net | Spec-Index | Com-Net | COM-Index | Smalls-Net | Smalls-Index |
|---|---|---|---|---|---|---|---|---|
| WTI Crude | 1,787,928 | 9 | 332,976 | 10 | -373,761 | 91 | 40,785 | 72 |
| Gold | 513,722 | 18 | 172,589 | 5 | -200,056 | 95 | 27,467 | 32 |
| Silver | 147,301 | 14 | 13,997 | 15 | -23,861 | 99 | 9,864 | 6 |
| Copper | 189,923 | 19 | -18,025 | 29 | 15,425 | 70 | 2,600 | 40 |
| Palladium | 6,538 | 1 | -3,133 | 4 | 3,221 | 95 | -88 | 39 |
| Platinum | 67,964 | 35 | 2,363 | 7 | -6,501 | 96 | 4,138 | 20 |
| Natural Gas | 1,115,815 | 7 | -110,368 | 45 | 59,679 | 50 | 50,689 | 100 |
| Brent | 181,699 | 25 | -40,872 | 43 | 38,941 | 58 | 1,931 | 35 |
| Heating Oil | 349,618 | 31 | 6,455 | 52 | -32,434 | 37 | 25,979 | 88 |
| Soybeans | 753,373 | 34 | 186,078 | 71 | -158,757 | 34 | -27,321 | 25 |
| Corn | 1,564,217 | 32 | 404,200 | 82 | -353,348 | 22 | -50,852 | 14 |
| Coffee | 214,170 | 8 | 43,015 | 76 | -45,757 | 28 | 2,742 | 17 |
| Sugar | 848,463 | 11 | 201,680 | 78 | -240,752 | 23 | 39,072 | 56 |
| Wheat | 331,136 | 11 | 22,309 | 48 | -18,647 | 33 | -3,662 | 91 |
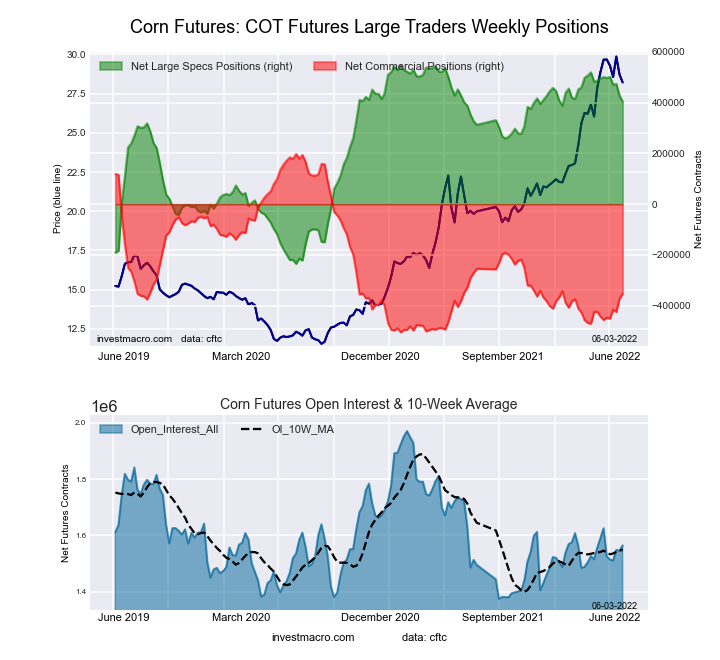
This week’s current strength score (the trader positioning range over the past three years, measured from 0 to 100) shows the speculators are currently Bullish-Extreme with a score of 81.7 percent. The commercials are Bearish with a score of 21.6 percent and the small traders (not shown in chart) are Bearish-Extreme with a score of 13.8 percent.
| CORN Futures Statistics | SPECULATORS | COMMERCIALS | SMALL TRADERS |
| – Percent of Open Interest Longs: | 35.3 | 42.1 | 9.0 |
| – Percent of Open Interest Shorts: | 9.4 | 64.6 | 12.2 |
| – Net Position: | 404,200 | -353,348 | -50,852 |
| – Gross Longs: | 551,849 | 657,849 | 140,307 |
| – Gross Shorts: | 147,649 | 1,011,197 | 191,159 |
| – Long to Short Ratio: | 3.7 to 1 | 0.7 to 1 | 0.7 to 1 |
| NET POSITION TREND: | |||
| – Strength Index Score (3 Year Range Pct): | 81.7 | 21.6 | 13.8 |
| – Strength Index Reading (3 Year Range): | Bullish-Extreme | Bearish | Bearish-Extreme |
| NET POSITION MOVEMENT INDEX: | |||
| – 6-Week Change in Strength Index: | -12.3 | 14.6 | -3.7 |
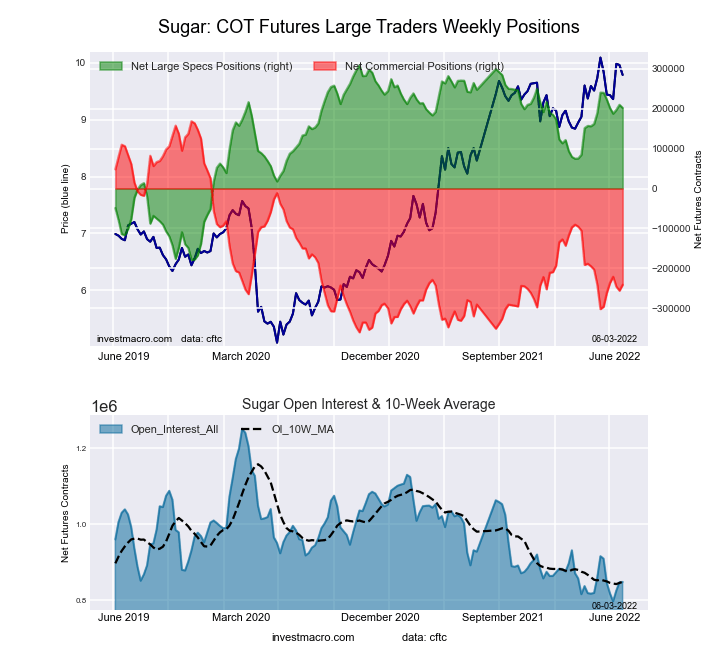
This week’s current strength score (the trader positioning range over the past three years, measured from 0 to 100) shows the speculators are currently Bullish with a score of 78.1 percent. The commercials are Bearish with a score of 22.5 percent and the small traders (not shown in chart) are Bullish with a score of 56.2 percent.
| SUGAR Futures Statistics | SPECULATORS | COMMERCIALS | SMALL TRADERS |
| – Percent of Open Interest Longs: | 30.6 | 45.1 | 10.5 |
| – Percent of Open Interest Shorts: | 6.8 | 73.5 | 5.9 |
| – Net Position: | 201,680 | -240,752 | 39,072 |
| – Gross Longs: | 259,634 | 382,461 | 89,391 |
| – Gross Shorts: | 57,954 | 623,213 | 50,319 |
| – Long to Short Ratio: | 4.5 to 1 | 0.6 to 1 | 1.8 to 1 |
| NET POSITION TREND: | |||
| – Strength Index Score (3 Year Range Pct): | 78.1 | 22.5 | 56.2 |
| – Strength Index Reading (3 Year Range): | Bullish | Bearish | Bullish |
| NET POSITION MOVEMENT INDEX: | |||
| – 6-Week Change in Strength Index: | -7.8 | 10.4 | -20.9 |
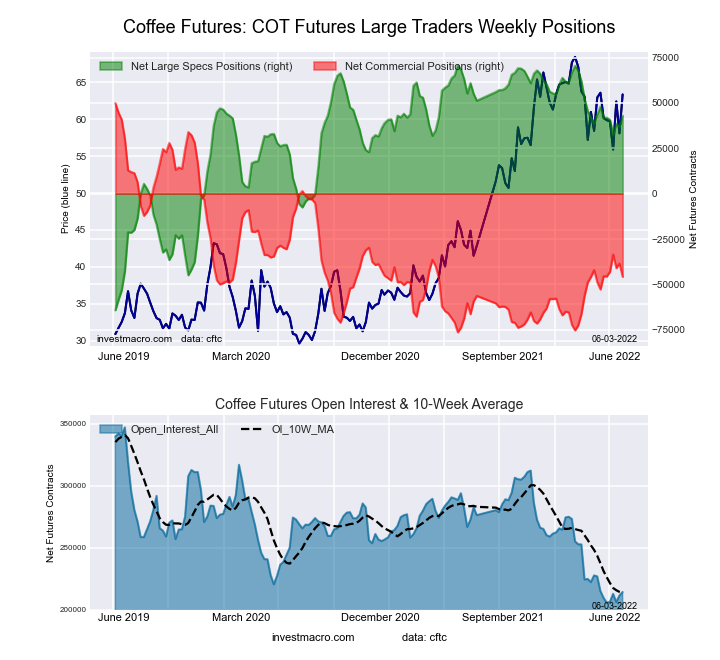
This week’s current strength score (the trader positioning range over the past three years, measured from 0 to 100) shows the speculators are currently Bullish with a score of 76.0 percent. The commercials are Bearish with a score of 27.7 percent and the small traders (not shown in chart) are Bearish-Extreme with a score of 17.4 percent.
| COFFEE Futures Statistics | SPECULATORS | COMMERCIALS | SMALL TRADERS |
| – Percent of Open Interest Longs: | 23.5 | 51.5 | 4.4 |
| – Percent of Open Interest Shorts: | 3.4 | 72.9 | 3.1 |
| – Net Position: | 43,015 | -45,757 | 2,742 |
| – Gross Longs: | 50,242 | 110,322 | 9,389 |
| – Gross Shorts: | 7,227 | 156,079 | 6,647 |
| – Long to Short Ratio: | 7.0 to 1 | 0.7 to 1 | 1.4 to 1 |
| NET POSITION TREND: | |||
| – Strength Index Score (3 Year Range Pct): | 76.0 | 27.7 | 17.4 |
| – Strength Index Reading (3 Year Range): | Bullish | Bearish | Bearish-Extreme |
| NET POSITION MOVEMENT INDEX: | |||
| – 6-Week Change in Strength Index: | 1.0 | -0.3 | -9.0 |
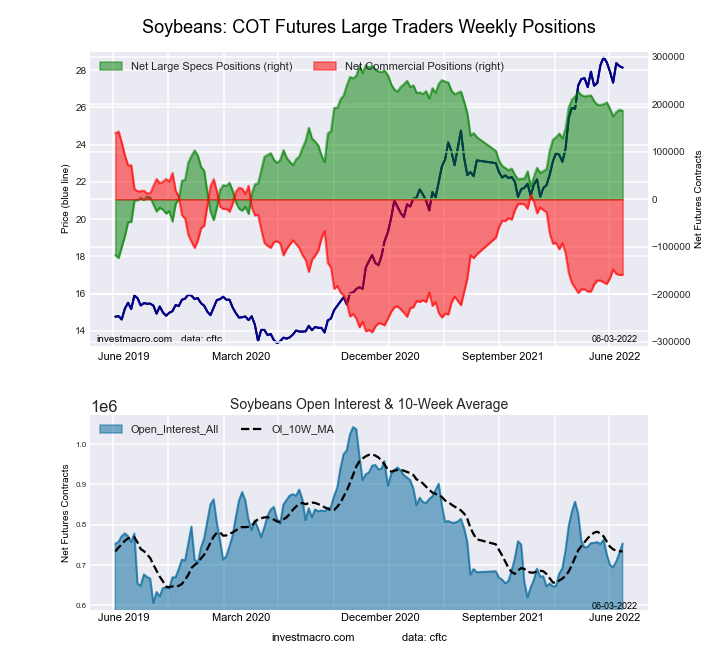
This week’s current strength score (the trader positioning range over the past three years, measured from 0 to 100) shows the speculators are currently Bullish with a score of 70.9 percent. The commercials are Bearish with a score of 34.4 percent and the small traders (not shown in chart) are Bearish with a score of 24.9 percent.
| SOYBEANS Futures Statistics | SPECULATORS | COMMERCIALS | SMALL TRADERS |
| – Percent of Open Interest Longs: | 31.6 | 47.3 | 6.6 |
| – Percent of Open Interest Shorts: | 6.9 | 68.3 | 10.2 |
| – Net Position: | 186,078 | -158,757 | -27,321 |
| – Gross Longs: | 237,836 | 356,115 | 49,891 |
| – Gross Shorts: | 51,758 | 514,872 | 77,212 |
| – Long to Short Ratio: | 4.6 to 1 | 0.7 to 1 | 0.6 to 1 |
| NET POSITION TREND: | |||
| – Strength Index Score (3 Year Range Pct): | 70.9 | 34.4 | 24.9 |
| – Strength Index Reading (3 Year Range): | Bullish | Bearish | Bearish |
| NET POSITION MOVEMENT INDEX: | |||
| – 6-Week Change in Strength Index: | -4.3 | 4.6 | -3.6 |
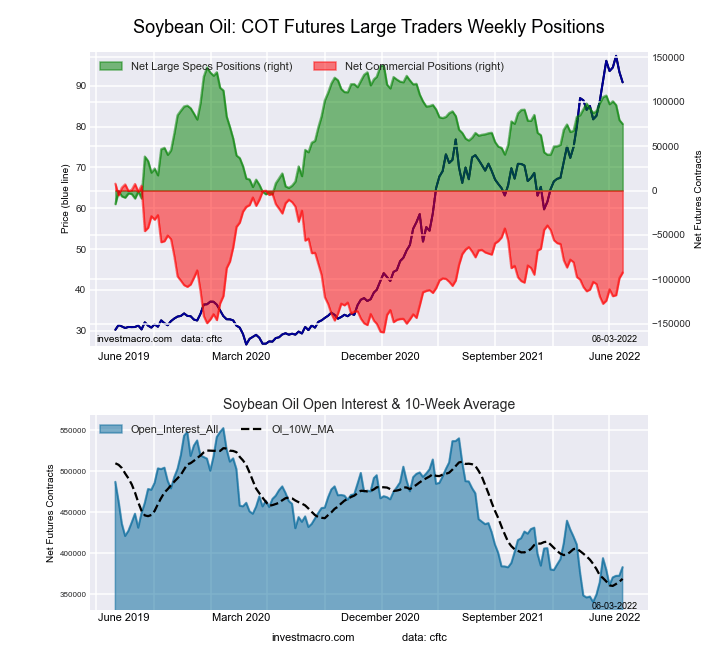
This week’s current strength score (the trader positioning range over the past three years, measured from 0 to 100) shows the speculators are currently Bullish with a score of 57.7 percent. The commercials are Bearish with a score of 40.2 percent and the small traders (not shown in chart) are Bullish with a score of 77.8 percent.
| SOYBEAN OIL Futures Statistics | SPECULATORS | COMMERCIALS | SMALL TRADERS |
| – Percent of Open Interest Longs: | 27.4 | 47.5 | 9.3 |
| – Percent of Open Interest Shorts: | 7.8 | 71.6 | 4.8 |
| – Net Position: | 75,041 | -92,287 | 17,246 |
| – Gross Longs: | 105,091 | 181,857 | 35,597 |
| – Gross Shorts: | 30,050 | 274,144 | 18,351 |
| – Long to Short Ratio: | 3.5 to 1 | 0.7 to 1 | 1.9 to 1 |
| NET POSITION TREND: | |||
| – Strength Index Score (3 Year Range Pct): | 57.7 | 40.2 | 77.8 |
| – Strength Index Reading (3 Year Range): | Bullish | Bearish | Bullish |
| NET POSITION MOVEMENT INDEX: | |||
| – 6-Week Change in Strength Index: | -19.3 | 21.0 | -18.4 |
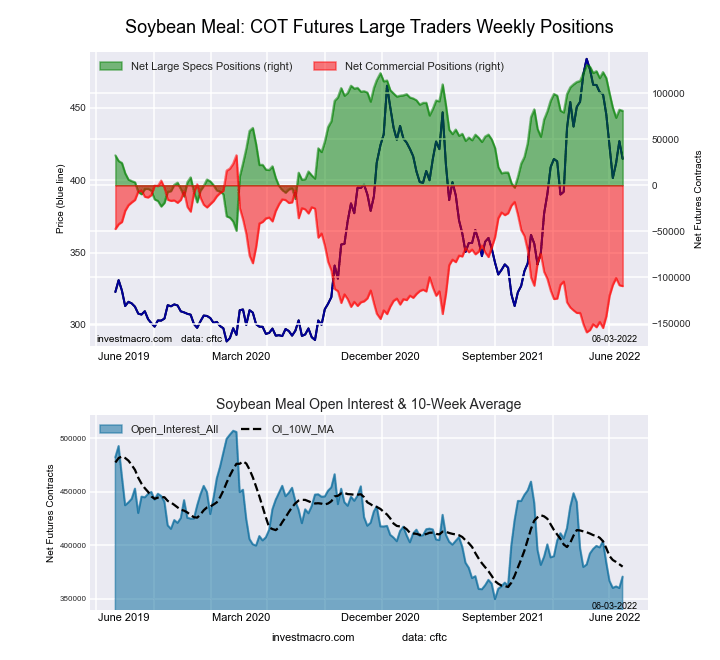
This week’s current strength score (the trader positioning range over the past three years, measured from 0 to 100) shows the speculators are currently Bullish with a score of 72.4 percent. The commercials are Bearish with a score of 26.1 percent and the small traders (not shown in chart) are Bullish-Extreme with a score of 81.4 percent.
| SOYBEAN MEAL Futures Statistics | SPECULATORS | COMMERCIALS | SMALL TRADERS |
| – Percent of Open Interest Longs: | 28.7 | 44.2 | 13.2 |
| – Percent of Open Interest Shorts: | 6.9 | 73.7 | 5.5 |
| – Net Position: | 80,754 | -109,384 | 28,630 |
| – Gross Longs: | 106,453 | 163,966 | 48,928 |
| – Gross Shorts: | 25,699 | 273,350 | 20,298 |
| – Long to Short Ratio: | 4.1 to 1 | 0.6 to 1 | 2.4 to 1 |
| NET POSITION TREND: | |||
| – Strength Index Score (3 Year Range Pct): | 72.4 | 26.1 | 81.4 |
| – Strength Index Reading (3 Year Range): | Bullish | Bearish | Bullish-Extreme |
| NET POSITION MOVEMENT INDEX: | |||
| – 6-Week Change in Strength Index: | -23.4 | 23.7 | -17.4 |
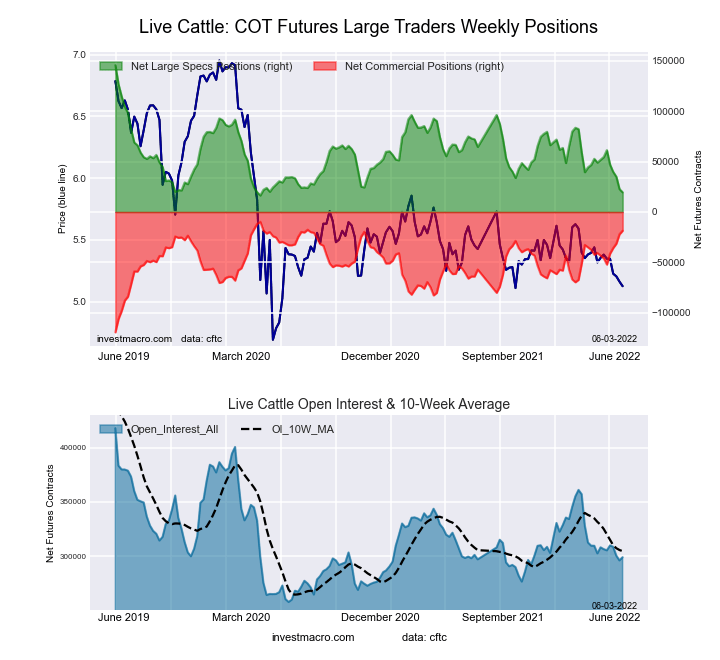
This week’s current strength score (the trader positioning range over the past three years, measured from 0 to 100) shows the speculators are currently Bearish-Extreme with a score of 3.9 percent. The commercials are Bullish-Extreme with a score of 87.9 percent and the small traders (not shown in chart) are Bullish with a score of 78.4 percent.
| LIVE CATTLE Futures Statistics | SPECULATORS | COMMERCIALS | SMALL TRADERS |
| – Percent of Open Interest Longs: | 34.2 | 40.6 | 11.6 |
| – Percent of Open Interest Shorts: | 27.7 | 46.8 | 11.9 |
| – Net Position: | 19,540 | -18,566 | -974 |
| – Gross Longs: | 102,315 | 121,350 | 34,613 |
| – Gross Shorts: | 82,775 | 139,916 | 35,587 |
| – Long to Short Ratio: | 1.2 to 1 | 0.9 to 1 | 1.0 to 1 |
| NET POSITION TREND: | |||
| – Strength Index Score (3 Year Range Pct): | 3.9 | 87.9 | 78.4 |
| – Strength Index Reading (3 Year Range): | Bearish-Extreme | Bullish-Extreme | Bullish |
| NET POSITION MOVEMENT INDEX: | |||
| – 6-Week Change in Strength Index: | -43.9 | 37.4 | 26.6 |
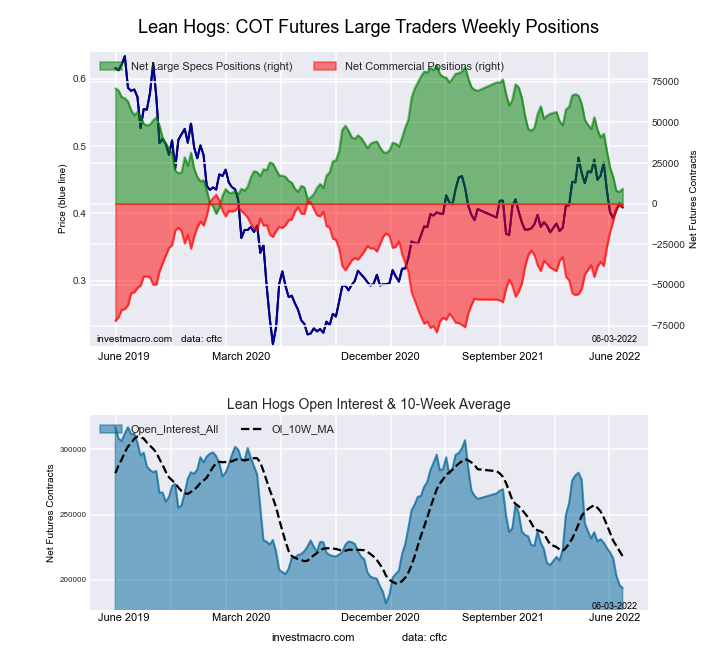
This week’s current strength score (the trader positioning range over the past three years, measured from 0 to 100) shows the speculators are currently Bearish-Extreme with a score of 16.8 percent. The commercials are Bullish-Extreme with a score of 90.9 percent and the small traders (not shown in chart) are Bullish with a score of 60.2 percent.
| LEAN HOGS Futures Statistics | SPECULATORS | COMMERCIALS | SMALL TRADERS |
| – Percent of Open Interest Longs: | 29.6 | 42.0 | 9.7 |
| – Percent of Open Interest Shorts: | 24.8 | 43.2 | 13.3 |
| – Net Position: | 9,217 | -2,209 | -7,008 |
| – Gross Longs: | 57,323 | 81,465 | 18,708 |
| – Gross Shorts: | 48,106 | 83,674 | 25,716 |
| – Long to Short Ratio: | 1.2 to 1 | 1.0 to 1 | 0.7 to 1 |
| NET POSITION TREND: | |||
| – Strength Index Score (3 Year Range Pct): | 16.8 | 90.9 | 60.2 |
| – Strength Index Reading (3 Year Range): | Bearish-Extreme | Bullish-Extreme | Bullish |
| NET POSITION MOVEMENT INDEX: | |||
| – 6-Week Change in Strength Index: | -36.8 | 42.6 | -11.8 |
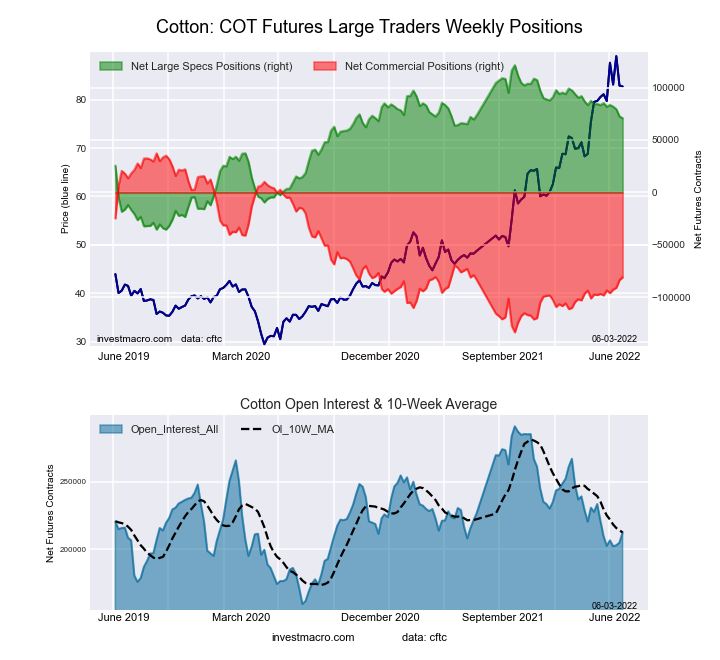
This week’s current strength score (the trader positioning range over the past three years, measured from 0 to 100) shows the speculators are currently Bullish with a score of 67.7 percent. The commercials are Bearish with a score of 30.7 percent and the small traders (not shown in chart) are Bullish with a score of 76.7 percent.
| COTTON Futures Statistics | SPECULATORS | COMMERCIALS | SMALL TRADERS |
| – Percent of Open Interest Longs: | 40.5 | 37.9 | 8.1 |
| – Percent of Open Interest Shorts: | 7.2 | 76.0 | 3.3 |
| – Net Position: | 70,684 | -80,864 | 10,180 |
| – Gross Longs: | 85,974 | 80,446 | 17,230 |
| – Gross Shorts: | 15,290 | 161,310 | 7,050 |
| – Long to Short Ratio: | 5.6 to 1 | 0.5 to 1 | 2.4 to 1 |
| NET POSITION TREND: | |||
| – Strength Index Score (3 Year Range Pct): | 67.7 | 30.7 | 76.7 |
| – Strength Index Reading (3 Year Range): | Bullish | Bearish | Bullish |
| NET POSITION MOVEMENT INDEX: | |||
| – 6-Week Change in Strength Index: | -9.2 | 10.1 | -17.8 |
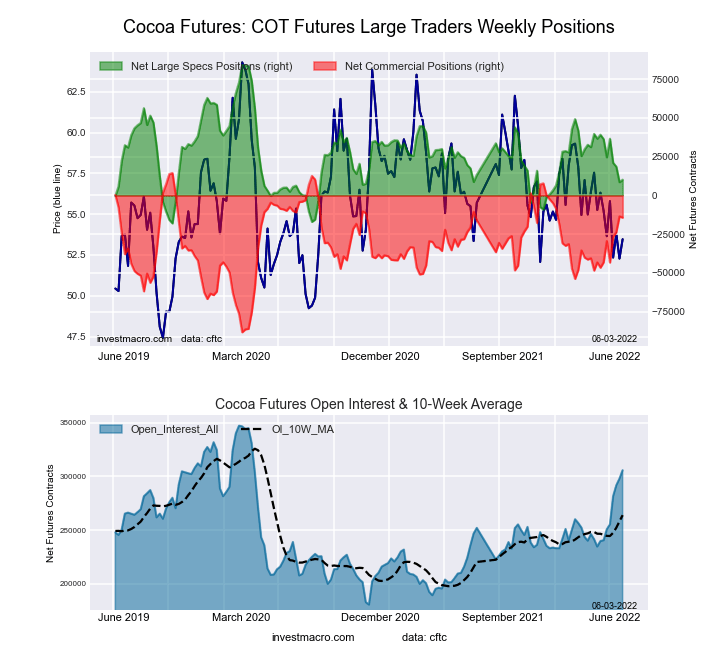
This week’s current strength score (the trader positioning range over the past three years, measured from 0 to 100) shows the speculators are currently Bearish with a score of 27.6 percent. The commercials are Bullish with a score of 72.0 percent and the small traders (not shown in chart) are Bearish with a score of 38.2 percent.
| COCOA Futures Statistics | SPECULATORS | COMMERCIALS | SMALL TRADERS |
| – Percent of Open Interest Longs: | 30.4 | 43.0 | 5.5 |
| – Percent of Open Interest Shorts: | 27.1 | 47.7 | 4.2 |
| – Net Position: | 10,153 | -14,322 | 4,169 |
| – Gross Longs: | 92,946 | 131,539 | 16,931 |
| – Gross Shorts: | 82,793 | 145,861 | 12,762 |
| – Long to Short Ratio: | 1.1 to 1 | 0.9 to 1 | 1.3 to 1 |
| NET POSITION TREND: | |||
| – Strength Index Score (3 Year Range Pct): | 27.6 | 72.0 | 38.2 |
| – Strength Index Reading (3 Year Range): | Bearish | Bullish | Bearish |
| NET POSITION MOVEMENT INDEX: | |||
| – 6-Week Change in Strength Index: | -25.7 | 28.0 | -25.8 |
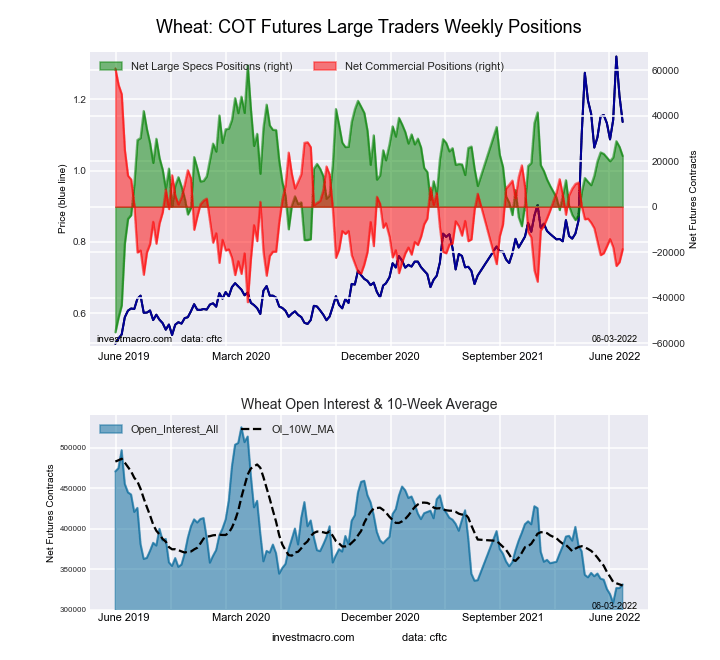
This week’s current strength score (the trader positioning range over the past three years, measured from 0 to 100) shows the speculators are currently Bearish with a score of 48.1 percent. The commercials are Bearish with a score of 33.1 percent and the small traders (not shown in chart) are Bullish-Extreme with a score of 91.4 percent.
| WHEAT Futures Statistics | SPECULATORS | COMMERCIALS | SMALL TRADERS |
| – Percent of Open Interest Longs: | 34.4 | 35.5 | 9.9 |
| – Percent of Open Interest Shorts: | 27.7 | 41.1 | 11.0 |
| – Net Position: | 22,309 | -18,647 | -3,662 |
| – Gross Longs: | 113,964 | 117,565 | 32,778 |
| – Gross Shorts: | 91,655 | 136,212 | 36,440 |
| – Long to Short Ratio: | 1.2 to 1 | 0.9 to 1 | 0.9 to 1 |
| NET POSITION TREND: | |||
| – Strength Index Score (3 Year Range Pct): | 48.1 | 33.1 | 91.4 |
| – Strength Index Reading (3 Year Range): | Bearish | Bearish | Bullish-Extreme |
| NET POSITION MOVEMENT INDEX: | |||
| – 6-Week Change in Strength Index: | -1.2 | 2.5 | -4.4 |
Article By InvestMacro – Receive our weekly COT Reports by Email
*COT Report: The COT data, released weekly to the public each Friday, is updated through the most recent Tuesday (data is 3 days old) and shows a quick view of how large speculators or non-commercials (for-profit traders) were positioned in the futures markets.
The CFTC categorizes trader positions according to commercial hedgers (traders who use futures contracts for hedging as part of the business), non-commercials (large traders who speculate to realize trading profits) and nonreportable traders (usually small traders/speculators) as well as their open interest (contracts open in the market at time of reporting).See CFTC criteria here.
By Analytical Department RoboForex GBP/USD fell to 1.3437 on Tuesday as investors assessed the appointment…
By JustMarkets The US stock indices ended Friday’s session in the red. By the end…
By Analytical Department RoboForex USD/JPY opens the week at 162.36 on Monday. The Japanese yen…
By InvestMacro Here are the latest charts and statistics for the Commitment of Traders (COT)…
By InvestMacro The latest update for the weekly Commitment of Traders (COT) report was released…
By InvestMacro Here are the latest charts and statistics for the Commitment of Traders (COT)…
This website uses cookies.