By InvestMacro | COT | Data Tables | COT Leaders | Downloads | COT Newsletter
Here are the latest charts and statistics for the Commitment of Traders (COT) data published by the Commodities Futures Trading Commission (CFTC).
The latest COT data is updated through Tuesday May 31st and shows a quick view of how large traders (for-profit speculators and commercial entities) were positioned in the futures markets.
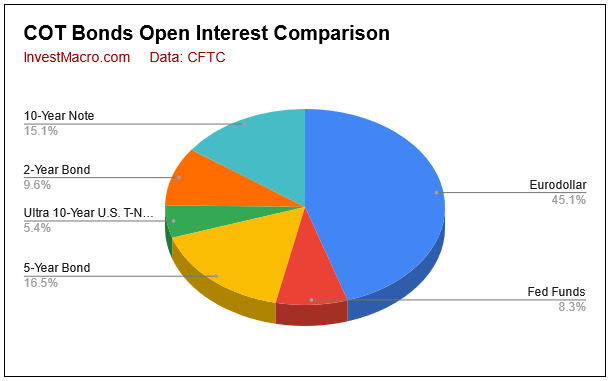
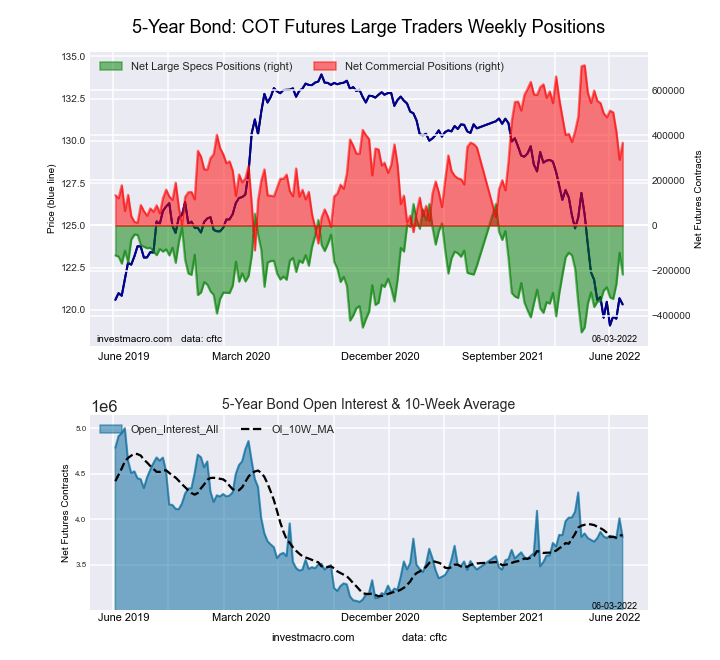
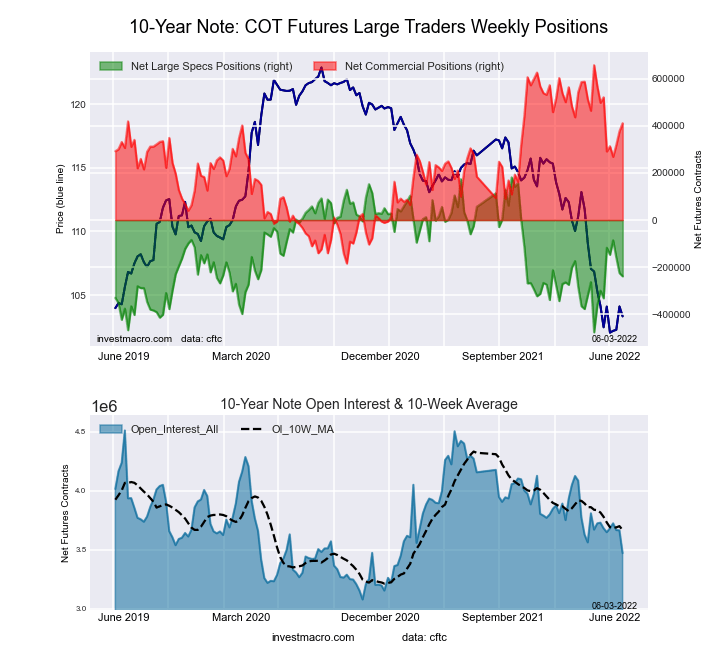
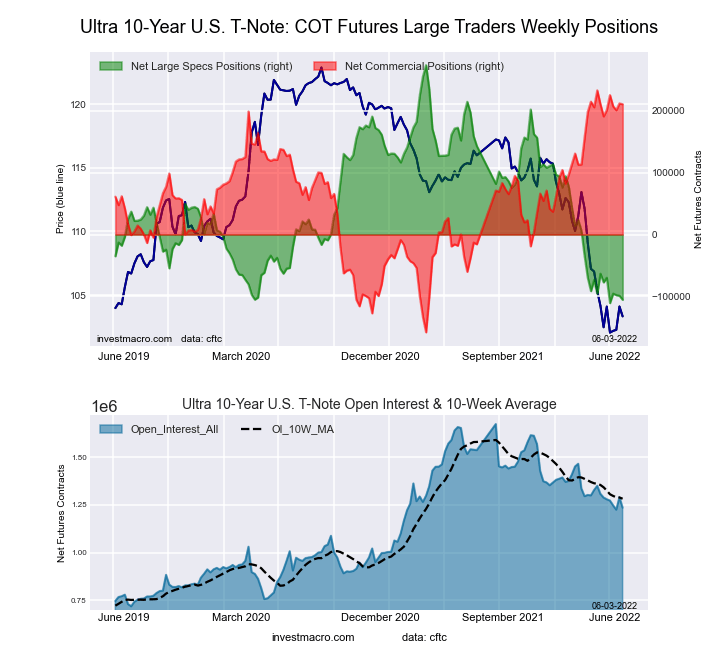
COT bonds market speculator bets were lower this week as all eight bond markets we cover had lower positioning this week. Leading the declines in speculator bets this week were the 5-Year Bond (-97,261 contracts) and the 2-Year Bond (-92,825 contracts) with the Eurodollar (-22,436 contracts), Fed Funds (-17,284 contracts), 10-Year Bond (-13,783 contracts), Long US Bond (-8,741 contracts), Ultra 10-Year (-6,442 contracts) and the Ultra US Bond (-1,383 contracts) also coming in with lower bets on the week.
Free Reports:
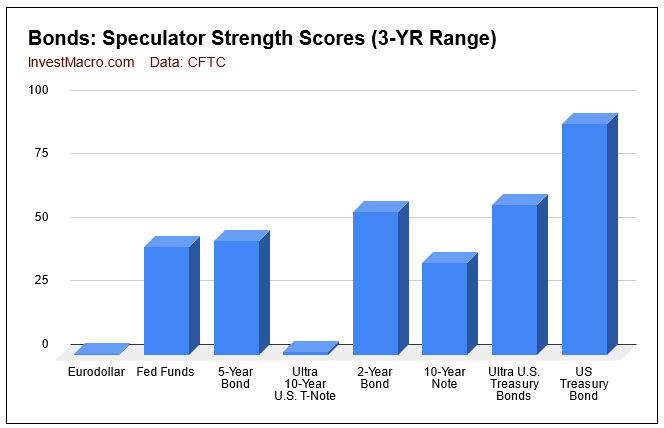
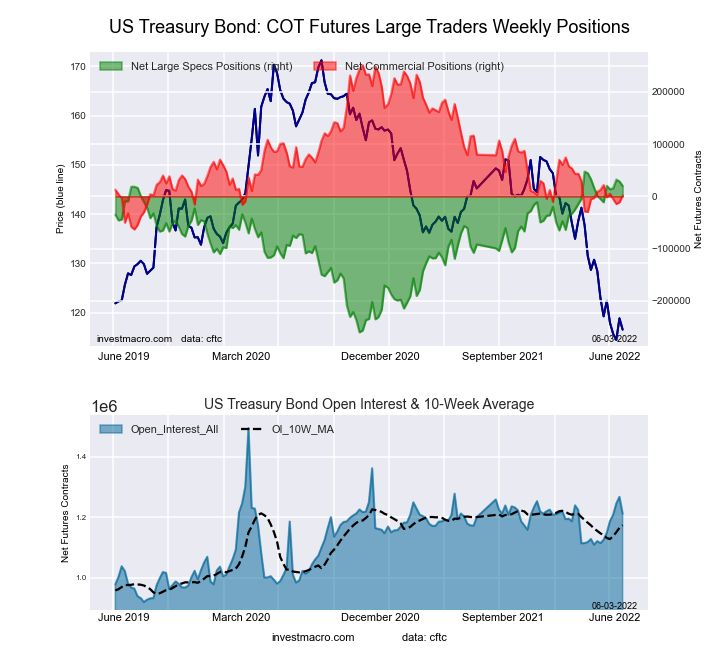
Strength scores (3-Year range of Speculator positions, from 0 to 100 where above 80 is extreme bullish and below 20 is extreme bearish) show that most of the bond markets are below their midpoints (50 percent) for the past 3 years. The US Treasury Bond, 2-Year and the Ultra US Bond have all gone above the midpoint and the US Treasury Bond has now entered extreme bullish levels as compared to its range over the past 3 years.
| May-31-2022 | OI | OI-Index | Spec-Net | Spec-Index | Com-Net | COM-Index | Smalls-Net | Smalls-Index |
|---|---|---|---|---|---|---|---|---|
| Eurodollar | 10,374,105 | 31 | -2,855,216 | 0 | 3,260,722 | 99 | -405,506 | 15 |
| FedFunds | 1,907,235 | 69 | 25,207 | 43 | -17,303 | 58 | -7,904 | 40 |
| 2-Year | 2,219,497 | 19 | -128,118 | 56 | 193,103 | 62 | -64,985 | 21 |
| Long T-Bond | 1,212,023 | 51 | 19,761 | 91 | 1,627 | 21 | -21,388 | 36 |
| 10-Year | 3,470,808 | 28 | -238,907 | 36 | 411,183 | 71 | -172,276 | 39 |
| 5-Year | 3,804,715 | 40 | -217,788 | 45 | 367,355 | 58 | -149,567 | 40 |
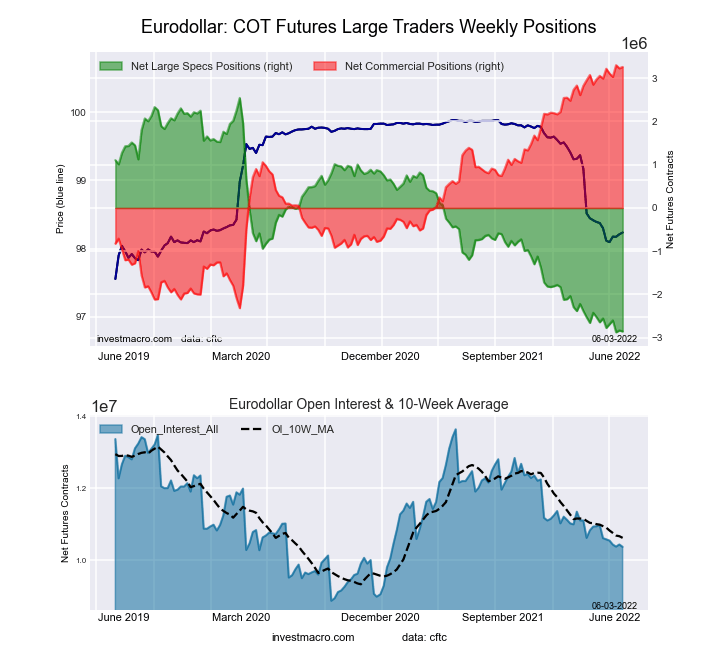
This week’s current strength score (the trader positioning range over the past three years, measured from 0 to 100) shows the speculators are currently Bearish-Extreme with a score of 0.4 percent. The commercials are Bullish-Extreme with a score of 99.3 percent and the small traders (not shown in chart) are Bearish-Extreme with a score of 15.2 percent.
| 3-Month Eurodollars Statistics | SPECULATORS | COMMERCIALS | SMALL TRADERS |
| – Percent of Open Interest Longs: | 3.2 | 75.4 | 3.6 |
| – Percent of Open Interest Shorts: | 30.7 | 44.0 | 7.5 |
| – Net Position: | -2,855,216 | 3,260,722 | -405,506 |
| – Gross Longs: | 332,811 | 7,825,376 | 371,699 |
| – Gross Shorts: | 3,188,027 | 4,564,654 | 777,205 |
| – Long to Short Ratio: | 0.1 to 1 | 1.7 to 1 | 0.5 to 1 |
| NET POSITION TREND: | |||
| – Strength Index Score (3 Year Range Pct): | 0.4 | 99.3 | 15.2 |
| – Strength Index Reading (3 Year Range): | Bearish-Extreme | Bullish-Extreme | Bearish-Extreme |
| NET POSITION MOVEMENT INDEX: | |||
| – 6-Week Change in Strength Index: | -5.5 | 4.8 | 6.9 |
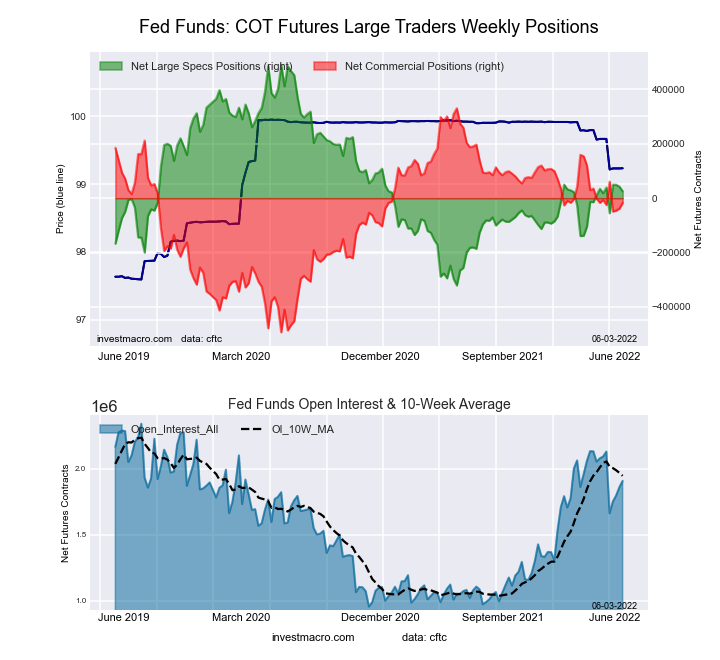
This week’s current strength score (the trader positioning range over the past three years, measured from 0 to 100) shows the speculators are currently Bearish with a score of 42.7 percent. The commercials are Bullish with a score of 57.8 percent and the small traders (not shown in chart) are Bearish with a score of 39.6 percent.
| 30-Day Federal Funds Statistics | SPECULATORS | COMMERCIALS | SMALL TRADERS |
| – Percent of Open Interest Longs: | 6.2 | 75.9 | 1.9 |
| – Percent of Open Interest Shorts: | 4.8 | 76.8 | 2.4 |
| – Net Position: | 25,207 | -17,303 | -7,904 |
| – Gross Longs: | 117,407 | 1,448,066 | 37,077 |
| – Gross Shorts: | 92,200 | 1,465,369 | 44,981 |
| – Long to Short Ratio: | 1.3 to 1 | 1.0 to 1 | 0.8 to 1 |
| NET POSITION TREND: | |||
| – Strength Index Score (3 Year Range Pct): | 42.7 | 57.8 | 39.6 |
| – Strength Index Reading (3 Year Range): | Bearish | Bullish | Bearish |
| NET POSITION MOVEMENT INDEX: | |||
| – 6-Week Change in Strength Index: | 0.8 | -1.4 | 11.0 |
This week’s current strength score (the trader positioning range over the past three years, measured from 0 to 100) shows the speculators are currently Bullish with a score of 56.4 percent. The commercials are Bullish with a score of 62.1 percent and the small traders (not shown in chart) are Bearish with a score of 21.5 percent.
| 2-Year Treasury Note Statistics | SPECULATORS | COMMERCIALS | SMALL TRADERS |
| – Percent of Open Interest Longs: | 11.9 | 77.2 | 6.5 |
| – Percent of Open Interest Shorts: | 17.6 | 68.5 | 9.4 |
| – Net Position: | -128,118 | 193,103 | -64,985 |
| – Gross Longs: | 263,530 | 1,714,483 | 143,470 |
| – Gross Shorts: | 391,648 | 1,521,380 | 208,455 |
| – Long to Short Ratio: | 0.7 to 1 | 1.1 to 1 | 0.7 to 1 |
| NET POSITION TREND: | |||
| – Strength Index Score (3 Year Range Pct): | 56.4 | 62.1 | 21.5 |
| – Strength Index Reading (3 Year Range): | Bullish | Bullish | Bearish |
| NET POSITION MOVEMENT INDEX: | |||
| – 6-Week Change in Strength Index: | -1.2 | -5.1 | 12.2 |
This week’s current strength score (the trader positioning range over the past three years, measured from 0 to 100) shows the speculators are currently Bearish with a score of 45.0 percent. The commercials are Bullish with a score of 58.1 percent and the small traders (not shown in chart) are Bearish with a score of 39.9 percent.
| 5-Year Treasury Note Statistics | SPECULATORS | COMMERCIALS | SMALL TRADERS |
| – Percent of Open Interest Longs: | 9.1 | 81.4 | 7.5 |
| – Percent of Open Interest Shorts: | 14.9 | 71.7 | 11.4 |
| – Net Position: | -217,788 | 367,355 | -149,567 |
| – Gross Longs: | 348,119 | 3,096,723 | 285,676 |
| – Gross Shorts: | 565,907 | 2,729,368 | 435,243 |
| – Long to Short Ratio: | 0.6 to 1 | 1.1 to 1 | 0.7 to 1 |
| NET POSITION TREND: | |||
| – Strength Index Score (3 Year Range Pct): | 45.0 | 58.1 | 39.9 |
| – Strength Index Reading (3 Year Range): | Bearish | Bullish | Bearish |
| NET POSITION MOVEMENT INDEX: | |||
| – 6-Week Change in Strength Index: | 12.5 | -15.9 | 16.3 |
This week’s current strength score (the trader positioning range over the past three years, measured from 0 to 100) shows the speculators are currently Bearish with a score of 36.1 percent. The commercials are Bullish with a score of 70.7 percent and the small traders (not shown in chart) are Bearish with a score of 38.9 percent.
| 10-Year Treasury Note Statistics | SPECULATORS | COMMERCIALS | SMALL TRADERS |
| – Percent of Open Interest Longs: | 7.1 | 79.6 | 9.0 |
| – Percent of Open Interest Shorts: | 14.0 | 67.8 | 14.0 |
| – Net Position: | -238,907 | 411,183 | -172,276 |
| – Gross Longs: | 245,557 | 2,764,399 | 313,090 |
| – Gross Shorts: | 484,464 | 2,353,216 | 485,366 |
| – Long to Short Ratio: | 0.5 to 1 | 1.2 to 1 | 0.6 to 1 |
| NET POSITION TREND: | |||
| – Strength Index Score (3 Year Range Pct): | 36.1 | 70.7 | 38.9 |
| – Strength Index Reading (3 Year Range): | Bearish | Bullish | Bearish |
| NET POSITION MOVEMENT INDEX: | |||
| – 6-Week Change in Strength Index: | 14.2 | -13.1 | 3.9 |
This week’s current strength score (the trader positioning range over the past three years, measured from 0 to 100) shows the speculators are currently Bearish-Extreme with a score of 1.4 percent. The commercials are Bullish-Extreme with a score of 94.3 percent and the small traders (not shown in chart) are Bullish with a score of 52.6 percent.
| Ultra 10-Year Notes Statistics | SPECULATORS | COMMERCIALS | SMALL TRADERS |
| – Percent of Open Interest Longs: | 4.8 | 81.8 | 11.9 |
| – Percent of Open Interest Shorts: | 13.4 | 64.7 | 20.4 |
| – Net Position: | -105,367 | 210,588 | -105,221 |
| – Gross Longs: | 59,643 | 1,010,524 | 147,144 |
| – Gross Shorts: | 165,010 | 799,936 | 252,365 |
| – Long to Short Ratio: | 0.4 to 1 | 1.3 to 1 | 0.6 to 1 |
| NET POSITION TREND: | |||
| – Strength Index Score (3 Year Range Pct): | 1.4 | 94.3 | 52.6 |
| – Strength Index Reading (3 Year Range): | Bearish-Extreme | Bullish-Extreme | Bullish |
| NET POSITION MOVEMENT INDEX: | |||
| – 6-Week Change in Strength Index: | -7.3 | 5.0 | 5.2 |
This week’s current strength score (the trader positioning range over the past three years, measured from 0 to 100) shows the speculators are currently Bullish-Extreme with a score of 91.0 percent. The commercials are Bearish with a score of 20.6 percent and the small traders (not shown in chart) are Bearish with a score of 35.6 percent.
| US Treasury Bonds Statistics | SPECULATORS | COMMERCIALS | SMALL TRADERS |
| – Percent of Open Interest Longs: | 9.9 | 75.9 | 13.0 |
| – Percent of Open Interest Shorts: | 8.3 | 75.8 | 14.7 |
| – Net Position: | 19,761 | 1,627 | -21,388 |
| – Gross Longs: | 120,014 | 920,309 | 157,340 |
| – Gross Shorts: | 100,253 | 918,682 | 178,728 |
| – Long to Short Ratio: | 1.2 to 1 | 1.0 to 1 | 0.9 to 1 |
| NET POSITION TREND: | |||
| – Strength Index Score (3 Year Range Pct): | 91.0 | 20.6 | 35.6 |
| – Strength Index Reading (3 Year Range): | Bullish-Extreme | Bearish | Bearish |
| NET POSITION MOVEMENT INDEX: | |||
| – 6-Week Change in Strength Index: | 10.1 | -6.3 | -8.8 |
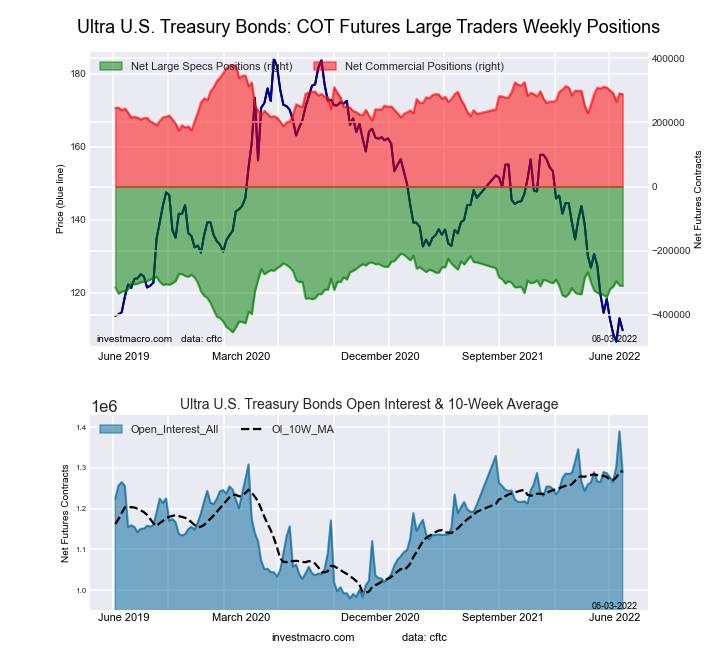
This week’s current strength score (the trader positioning range over the past three years, measured from 0 to 100) shows the speculators are currently Bullish with a score of 59.0 percent. The commercials are Bullish with a score of 55.7 percent and the small traders (not shown in chart) are Bearish with a score of 43.8 percent.
| Ultra US Treasury Bonds Statistics | SPECULATORS | COMMERCIALS | SMALL TRADERS |
| – Percent of Open Interest Longs: | 3.2 | 83.4 | 11.5 |
| – Percent of Open Interest Shorts: | 27.2 | 61.1 | 9.9 |
| – Net Position: | -309,278 | 287,591 | 21,687 |
| – Gross Longs: | 41,190 | 1,074,846 | 148,794 |
| – Gross Shorts: | 350,468 | 787,255 | 127,107 |
| – Long to Short Ratio: | 0.1 to 1 | 1.4 to 1 | 1.2 to 1 |
| NET POSITION TREND: | |||
| – Strength Index Score (3 Year Range Pct): | 59.0 | 55.7 | 43.8 |
| – Strength Index Reading (3 Year Range): | Bullish | Bullish | Bearish |
| NET POSITION MOVEMENT INDEX: | |||
| – 6-Week Change in Strength Index: | 11.5 | -11.4 | -3.5 |
Article By InvestMacro – Receive our weekly COT Reports by Email
*COT Report: The COT data, released weekly to the public each Friday, is updated through the most recent Tuesday (data is 3 days old) and shows a quick view of how large speculators or non-commercials (for-profit traders) were positioned in the futures markets.
The CFTC categorizes trader positions according to commercial hedgers (traders who use futures contracts for hedging as part of the business), non-commercials (large traders who speculate to realize trading profits) and nonreportable traders (usually small traders/speculators) as well as their open interest (contracts open in the market at time of reporting).See CFTC criteria here.
By JustMarkets The US stock indices ended Friday’s session in the red. By the end…
By Analytical Department RoboForex USD/JPY opens the week at 162.36 on Monday. The Japanese yen…
By InvestMacro Here are the latest charts and statistics for the Commitment of Traders (COT)…
By InvestMacro The latest update for the weekly Commitment of Traders (COT) report was released…
By InvestMacro Here are the latest charts and statistics for the Commitment of Traders (COT)…
By InvestMacro Here are the latest charts and statistics for the Commitment of Traders (COT)…
This website uses cookies.