By InvestMacro | COT | Data Tables | COT Leaders | Downloads | COT Newsletter
Here are the latest charts and statistics for the Commitment of Traders (COT) data published by the Commodities Futures Trading Commission (CFTC).
The latest COT data is updated through Tuesday February 15th and shows a quick view of how large traders (for-profit speculators and commercial entities) were positioned in the futures markets.
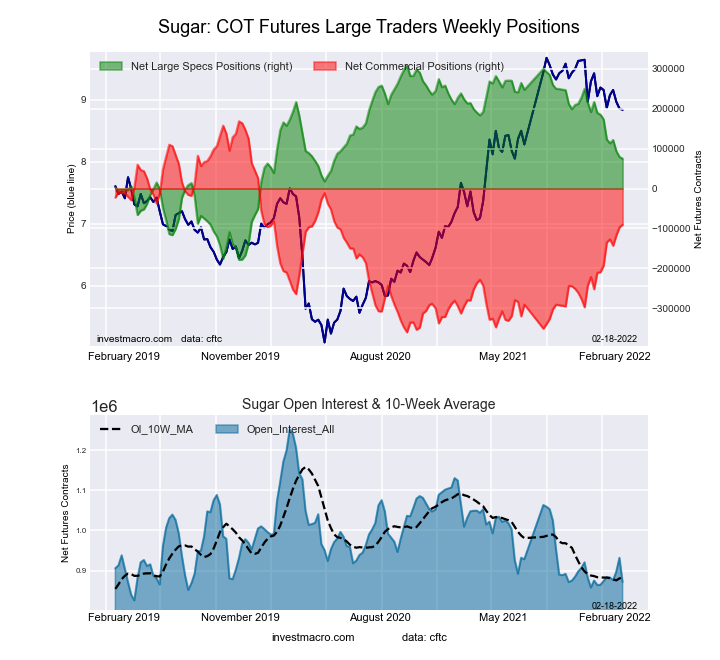
Highlighting the COT soft commodities data is the recent turnaround in speculator sentiment for the Sugar futures bets. The speculative net position in the Sugar futures has fallen for three straight weeks and in ten out of the past twelve weeks. Overall, the net position has now decreased by a total of -170,063 net contracts over the past twelve weeks.
Sugar bullish bets had been on a strong uptrend from 2020 through 2021 with speculator bullish bets reaching a recent high of +302,267 net contracts on August 17th. Since then, contracts and sugar prices have cooled off and have started lower with the trend accelerating over the past few months. The slipping sentiment has pushed the current speculator standing for Sugar to the lowest level of the past ninety-one weeks, dating back to May of 2020.
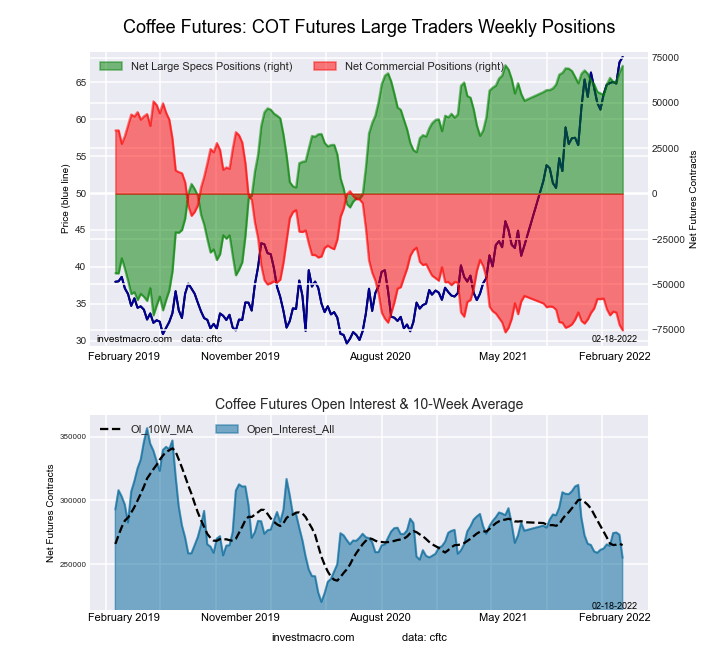
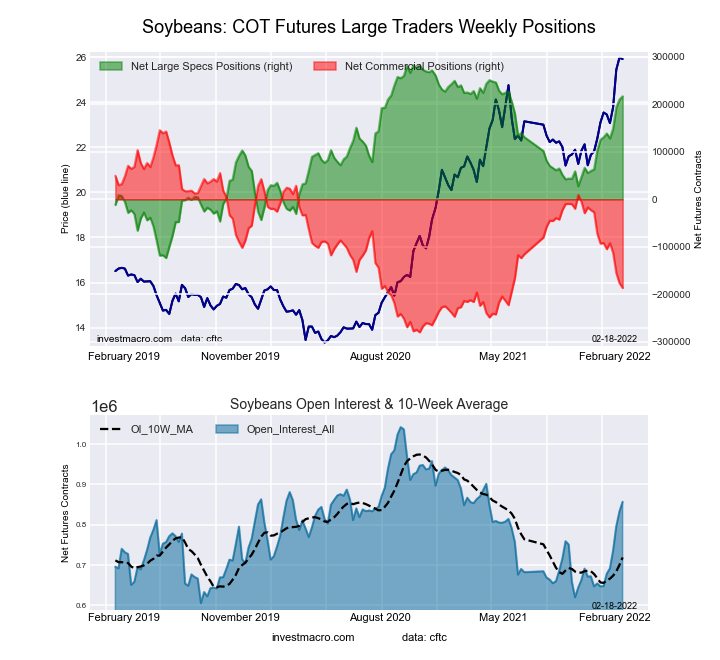
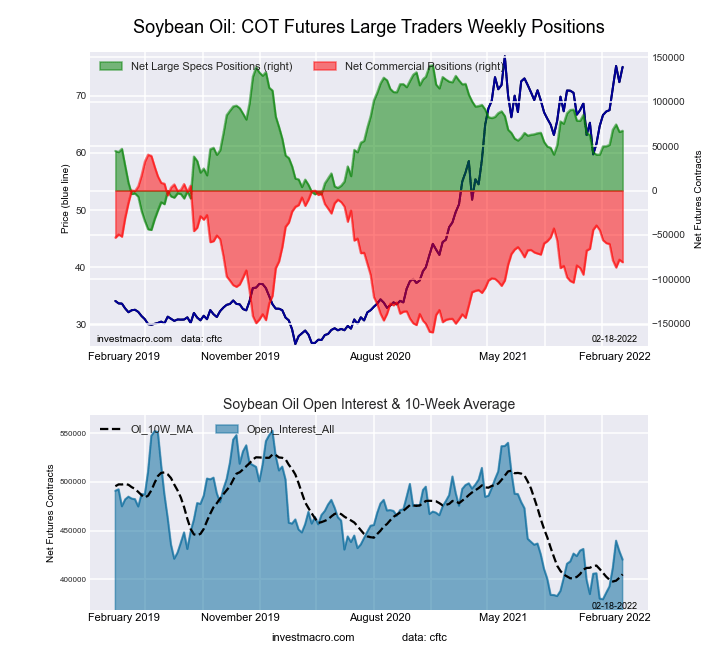
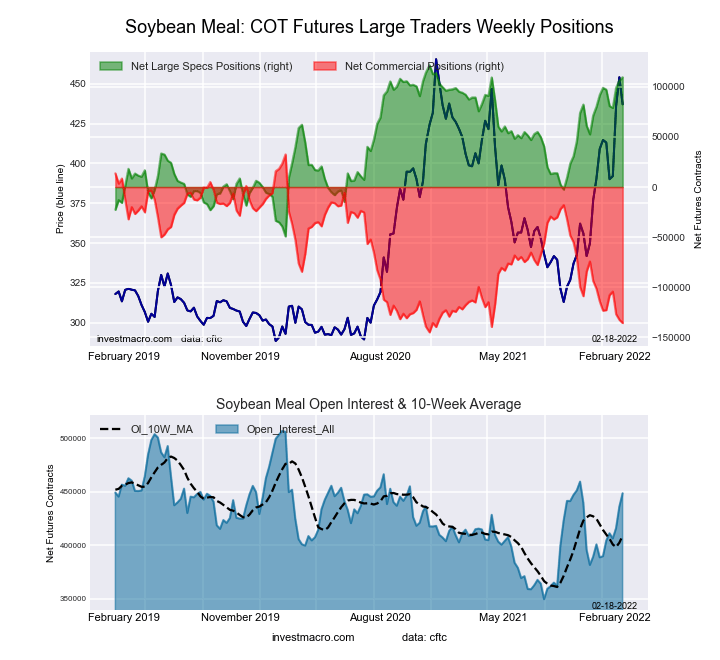
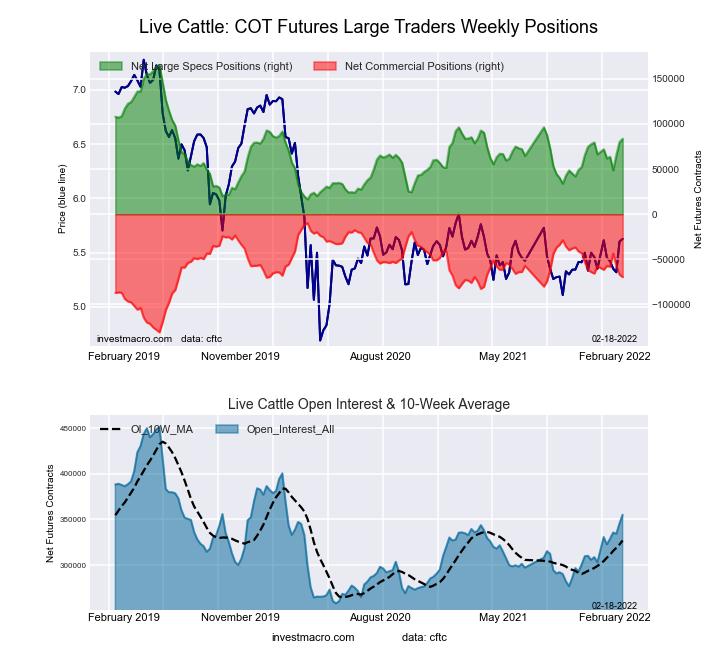
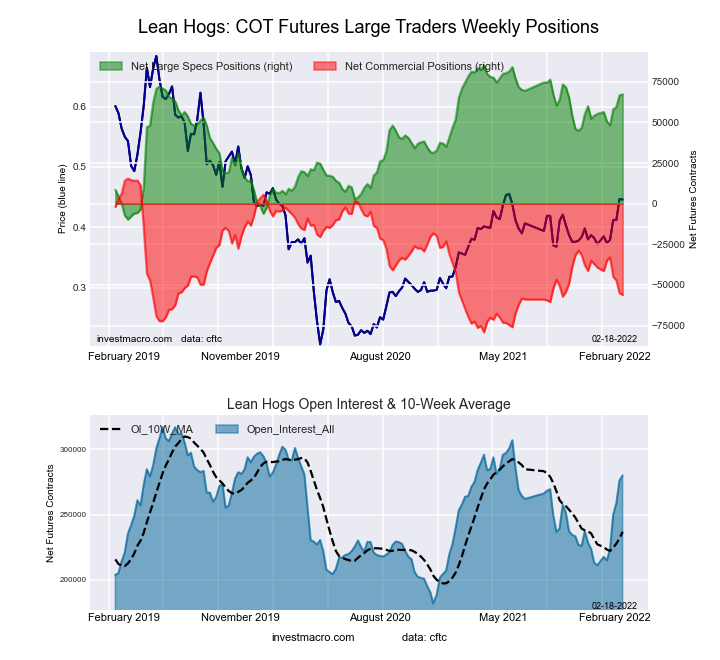
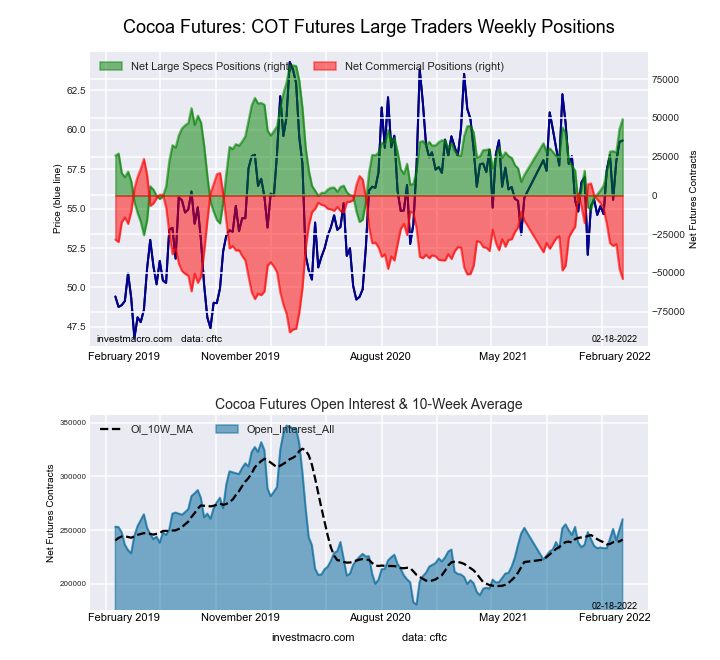
The soft commodities that saw higher bets this week were Coffee (3,558 contracts), Soybeans (7,002 contracts), Soybean Oil (1,285 contracts), Soybean Meal (3,284 contracts), Live Cattle (3,758 contracts), Lean Hogs (690 contracts) and Cocoa (6,361 contracts).
Free Reports:
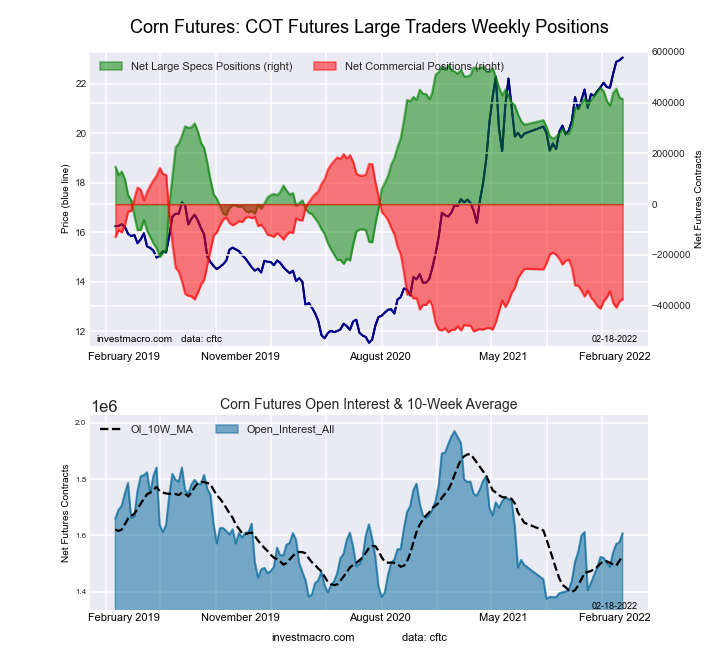
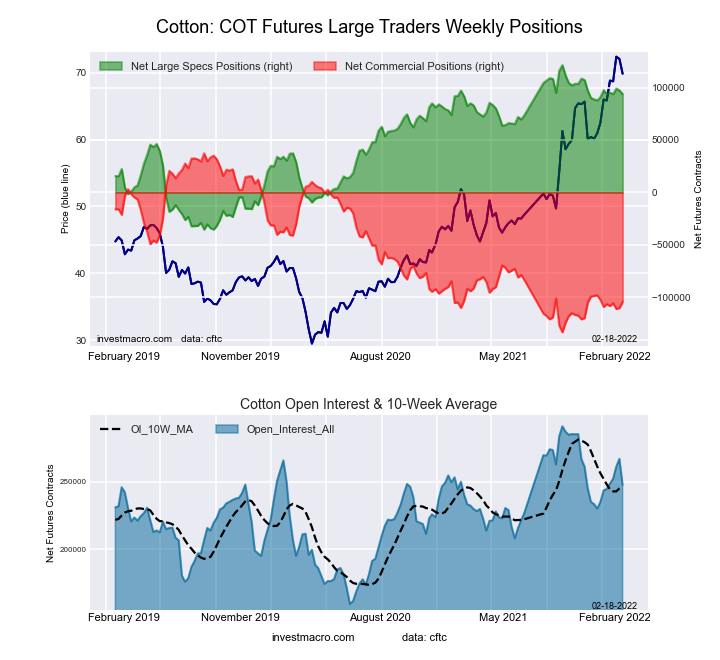
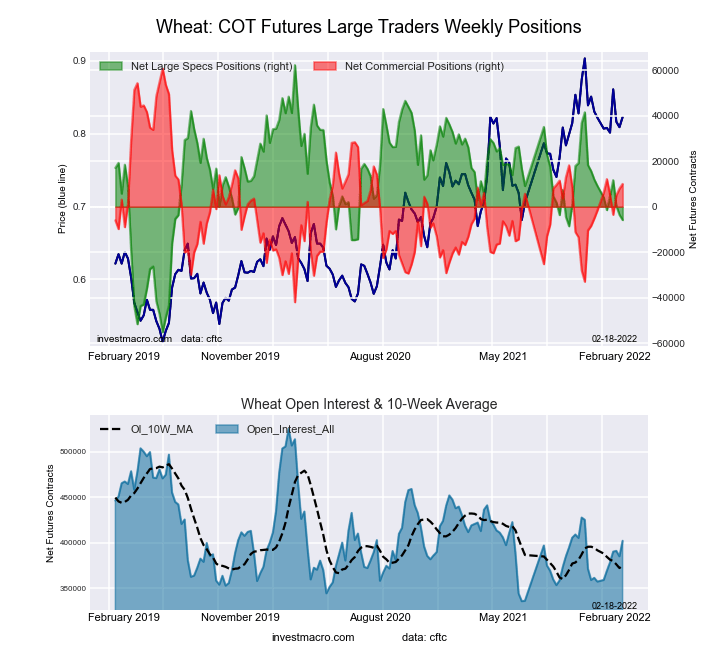
The soft commodities that saw lower bets this week were Corn (-5,110 contracts), Sugar (-4,527 contracts), Cotton (-3,487 contracts) and Wheat (-2,268 contracts).
| Feb-15-2022 | OI | OI-Index | Spec-Net | Spec-Index | Com-Net | COM-Index | Smalls-Net | Smalls-Index |
|---|---|---|---|---|---|---|---|---|
| WTI Crude | 2,122,758 | 39 | 348,093 | 8 | -392,000 | 80 | 43,907 | 77 |
| Gold | 558,645 | 35 | 213,613 | 56 | -238,875 | 45 | 25,262 | 36 |
| Silver | 156,968 | 23 | 23,556 | 46 | -36,348 | 63 | 12,792 | 17 |
| Copper | 210,089 | 34 | 30,692 | 64 | -39,421 | 32 | 8,729 | 76 |
| Palladium | 8,358 | 9 | -1,000 | 15 | 903 | 83 | 97 | 50 |
| Platinum | 59,897 | 22 | 10,132 | 16 | -16,020 | 86 | 5,888 | 44 |
| Natural Gas | 1,098,101 | 0 | -131,424 | 39 | 99,903 | 62 | 31,521 | 59 |
| Brent | 214,404 | 51 | -26,325 | 73 | 22,279 | 27 | 4,046 | 64 |
| Heating Oil | 349,618 | 31 | 6,455 | 52 | -32,434 | 37 | 25,979 | 88 |
| Soybeans | 856,917 | 58 | 216,732 | 84 | -186,438 | 22 | -30,294 | 20 |
| Corn | 1,607,591 | 39 | 414,492 | 83 | -374,969 | 19 | -39,523 | 20 |
| Coffee | 254,992 | 25 | 70,425 | 100 | -75,230 | 1 | 4,805 | 22 |
| Sugar | 871,213 | 11 | 74,563 | 52 | -90,388 | 51 | 15,825 | 27 |
| Wheat | 402,232 | 35 | -5,846 | 42 | 10,013 | 51 | -4,167 | 82 |
This week’s current strength score (the trader positioning range over the past three years, measured from 0 to 100) shows the speculators are currently Bullish-Extreme with a score of 83.0 percent. The commercials are Bearish-Extreme with a score of 18.5 percent and the small traders (not shown in chart) are Bearish with a score of 20.3 percent.
| CORN Futures Statistics | SPECULATORS | COMMERCIALS | SMALL TRADERS |
| – Percent of Open Interest Longs: | 31.8 | 45.0 | 9.1 |
| – Percent of Open Interest Shorts: | 6.0 | 68.3 | 11.6 |
| – Net Position: | 414,492 | -374,969 | -39,523 |
| – Gross Longs: | 510,734 | 723,086 | 146,972 |
| – Gross Shorts: | 96,242 | 1,098,055 | 186,495 |
| – Long to Short Ratio: | 5.3 to 1 | 0.7 to 1 | 0.8 to 1 |
| NET POSITION TREND: | |||
| – Strength Index Score (3 Year Range Pct): | 83.0 | 18.5 | 20.3 |
| – Strength Index Reading (3 Year Range): | Bullish-Extreme | Bearish-Extreme | Bearish |
| NET POSITION MOVEMENT INDEX: | |||
| – 6-Week Change in Strength Index: | -4.0 | 1.1 | 13.3 |
This week’s current strength score (the trader positioning range over the past three years, measured from 0 to 100) shows the speculators are currently Bullish with a score of 51.9 percent. The commercials are Bullish with a score of 51.0 percent and the small traders (not shown in chart) are Bearish with a score of 27.4 percent.
| SUGAR Futures Statistics | SPECULATORS | COMMERCIALS | SMALL TRADERS |
| – Percent of Open Interest Longs: | 21.0 | 56.2 | 9.0 |
| – Percent of Open Interest Shorts: | 12.4 | 66.6 | 7.2 |
| – Net Position: | 74,563 | -90,388 | 15,825 |
| – Gross Longs: | 182,861 | 489,754 | 78,130 |
| – Gross Shorts: | 108,298 | 580,142 | 62,305 |
| – Long to Short Ratio: | 1.7 to 1 | 0.8 to 1 | 1.3 to 1 |
| NET POSITION TREND: | |||
| – Strength Index Score (3 Year Range Pct): | 51.9 | 51.0 | 27.4 |
| – Strength Index Reading (3 Year Range): | Bullish | Bullish | Bearish |
| NET POSITION MOVEMENT INDEX: | |||
| – 6-Week Change in Strength Index: | -20.2 | 19.4 | -4.9 |
This week’s current strength score (the trader positioning range over the past three years, measured from 0 to 100) shows the speculators are currently Bullish-Extreme with a score of 99.7 percent. The commercials are Bearish-Extreme with a score of 0.9 percent and the small traders (not shown in chart) are Bearish with a score of 21.6 percent.
| COFFEE Futures Statistics | SPECULATORS | COMMERCIALS | SMALL TRADERS |
| – Percent of Open Interest Longs: | 31.4 | 41.5 | 4.5 |
| – Percent of Open Interest Shorts: | 3.7 | 71.0 | 2.7 |
| – Net Position: | 70,425 | -75,230 | 4,805 |
| – Gross Longs: | 79,961 | 105,790 | 11,577 |
| – Gross Shorts: | 9,536 | 181,020 | 6,772 |
| – Long to Short Ratio: | 8.4 to 1 | 0.6 to 1 | 1.7 to 1 |
| NET POSITION TREND: | |||
| – Strength Index Score (3 Year Range Pct): | 99.7 | 0.9 | 21.6 |
| – Strength Index Reading (3 Year Range): | Bullish-Extreme | Bearish-Extreme | Bearish |
| NET POSITION MOVEMENT INDEX: | |||
| – 6-Week Change in Strength Index: | 11.5 | -13.7 | 11.2 |
This week’s current strength score (the trader positioning range over the past three years, measured from 0 to 100) shows the speculators are currently Bullish-Extreme with a score of 83.9 percent. The commercials are Bearish with a score of 22.0 percent and the small traders (not shown in chart) are Bearish-Extreme with a score of 19.8 percent.
| SOYBEANS Futures Statistics | SPECULATORS | COMMERCIALS | SMALL TRADERS |
| – Percent of Open Interest Longs: | 30.5 | 43.8 | 6.6 |
| – Percent of Open Interest Shorts: | 5.2 | 65.6 | 10.2 |
| – Net Position: | 216,732 | -186,438 | -30,294 |
| – Gross Longs: | 261,666 | 375,676 | 56,797 |
| – Gross Shorts: | 44,934 | 562,114 | 87,091 |
| – Long to Short Ratio: | 5.8 to 1 | 0.7 to 1 | 0.7 to 1 |
| NET POSITION TREND: | |||
| – Strength Index Score (3 Year Range Pct): | 83.9 | 22.0 | 19.8 |
| – Strength Index Reading (3 Year Range): | Bullish-Extreme | Bearish | Bearish-Extreme |
| NET POSITION MOVEMENT INDEX: | |||
| – 6-Week Change in Strength Index: | 21.3 | -22.2 | 14.2 |
This week’s current strength score (the trader positioning range over the past three years, measured from 0 to 100) shows the speculators are currently Bullish with a score of 60.2 percent. The commercials are Bearish with a score of 39.5 percent and the small traders (not shown in chart) are Bullish with a score of 63.2 percent.
| SOYBEAN OIL Futures Statistics | SPECULATORS | COMMERCIALS | SMALL TRADERS |
| – Percent of Open Interest Longs: | 24.4 | 46.8 | 9.5 |
| – Percent of Open Interest Shorts: | 8.3 | 66.0 | 6.4 |
| – Net Position: | 67,320 | -80,652 | 13,332 |
| – Gross Longs: | 102,372 | 196,884 | 40,131 |
| – Gross Shorts: | 35,052 | 277,536 | 26,799 |
| – Long to Short Ratio: | 2.9 to 1 | 0.7 to 1 | 1.5 to 1 |
| NET POSITION TREND: | |||
| – Strength Index Score (3 Year Range Pct): | 60.2 | 39.5 | 63.2 |
| – Strength Index Reading (3 Year Range): | Bullish | Bearish | Bullish |
| NET POSITION MOVEMENT INDEX: | |||
| – 6-Week Change in Strength Index: | 9.5 | -12.4 | 26.9 |
This week’s current strength score (the trader positioning range over the past three years, measured from 0 to 100) shows the speculators are currently Bullish-Extreme with a score of 92.9 percent. The commercials are Bearish-Extreme with a score of 5.2 percent and the small traders (not shown in chart) are Bullish with a score of 75.7 percent.
| SOYBEAN MEAL Futures Statistics | SPECULATORS | COMMERCIALS | SMALL TRADERS |
| – Percent of Open Interest Longs: | 29.4 | 43.8 | 11.4 |
| – Percent of Open Interest Shorts: | 5.0 | 74.1 | 5.6 |
| – Net Position: | 109,544 | -135,761 | 26,217 |
| – Gross Longs: | 131,883 | 196,526 | 51,263 |
| – Gross Shorts: | 22,339 | 332,287 | 25,046 |
| – Long to Short Ratio: | 5.9 to 1 | 0.6 to 1 | 2.0 to 1 |
| NET POSITION TREND: | |||
| – Strength Index Score (3 Year Range Pct): | 92.9 | 5.2 | 75.7 |
| – Strength Index Reading (3 Year Range): | Bullish-Extreme | Bearish-Extreme | Bullish |
| NET POSITION MOVEMENT INDEX: | |||
| – 6-Week Change in Strength Index: | 6.2 | -7.0 | 7.4 |
This week’s current strength score (the trader positioning range over the past three years, measured from 0 to 100) shows the speculators are currently Bearish with a score of 45.1 percent. The commercials are Bullish with a score of 50.5 percent and the small traders (not shown in chart) are Bullish with a score of 53.2 percent.
| LIVE CATTLE Futures Statistics | SPECULATORS | COMMERCIALS | SMALL TRADERS |
| – Percent of Open Interest Longs: | 37.3 | 36.9 | 9.2 |
| – Percent of Open Interest Shorts: | 13.8 | 56.5 | 13.2 |
| – Net Position: | 83,567 | -69,675 | -13,892 |
| – Gross Longs: | 132,481 | 130,961 | 32,844 |
| – Gross Shorts: | 48,914 | 200,636 | 46,736 |
| – Long to Short Ratio: | 2.7 to 1 | 0.7 to 1 | 0.7 to 1 |
| NET POSITION TREND: | |||
| – Strength Index Score (3 Year Range Pct): | 45.1 | 50.5 | 53.2 |
| – Strength Index Reading (3 Year Range): | Bearish | Bullish | Bullish |
| NET POSITION MOVEMENT INDEX: | |||
| – 6-Week Change in Strength Index: | 7.9 | -6.7 | -8.7 |
This week’s current strength score (the trader positioning range over the past three years, measured from 0 to 100) shows the speculators are currently Bullish-Extreme with a score of 80.1 percent. The commercials are Bearish with a score of 24.6 percent and the small traders (not shown in chart) are Bearish with a score of 31.8 percent.
| LEAN HOGS Futures Statistics | SPECULATORS | COMMERCIALS | SMALL TRADERS |
| – Percent of Open Interest Longs: | 40.7 | 32.3 | 8.0 |
| – Percent of Open Interest Shorts: | 16.6 | 52.3 | 12.0 |
| – Net Position: | 67,332 | -56,167 | -11,165 |
| – Gross Longs: | 113,909 | 90,422 | 22,524 |
| – Gross Shorts: | 46,577 | 146,589 | 33,689 |
| – Long to Short Ratio: | 2.4 to 1 | 0.6 to 1 | 0.7 to 1 |
| NET POSITION TREND: | |||
| – Strength Index Score (3 Year Range Pct): | 80.1 | 24.6 | 31.8 |
| – Strength Index Reading (3 Year Range): | Bullish-Extreme | Bearish | Bearish |
| NET POSITION MOVEMENT INDEX: | |||
| – 6-Week Change in Strength Index: | 11.9 | -15.8 | 16.4 |
This week’s current strength score (the trader positioning range over the past three years, measured from 0 to 100) shows the speculators are currently Bullish-Extreme with a score of 82.4 percent. The commercials are Bearish-Extreme with a score of 17.0 percent and the small traders (not shown in chart) are Bullish with a score of 79.5 percent.
| COTTON Futures Statistics | SPECULATORS | COMMERCIALS | SMALL TRADERS |
| – Percent of Open Interest Longs: | 42.9 | 38.3 | 7.9 |
| – Percent of Open Interest Shorts: | 5.0 | 80.4 | 3.6 |
| – Net Position: | 93,723 | -104,282 | 10,559 |
| – Gross Longs: | 106,081 | 94,792 | 19,508 |
| – Gross Shorts: | 12,358 | 199,074 | 8,949 |
| – Long to Short Ratio: | 8.6 to 1 | 0.5 to 1 | 2.2 to 1 |
| NET POSITION TREND: | |||
| – Strength Index Score (3 Year Range Pct): | 82.4 | 17.0 | 79.5 |
| – Strength Index Reading (3 Year Range): | Bullish-Extreme | Bearish-Extreme | Bullish |
| NET POSITION MOVEMENT INDEX: | |||
| – 6-Week Change in Strength Index: | -2.4 | 2.8 | -6.5 |
This week’s current strength score (the trader positioning range over the past three years, measured from 0 to 100) shows the speculators are currently Bullish with a score of 68.2 percent. The commercials are Bearish with a score of 30.8 percent and the small traders (not shown in chart) are Bullish with a score of 60.9 percent.
| COCOA Futures Statistics | SPECULATORS | COMMERCIALS | SMALL TRADERS |
| – Percent of Open Interest Longs: | 33.1 | 41.7 | 5.0 |
| – Percent of Open Interest Shorts: | 14.2 | 62.4 | 3.2 |
| – Net Position: | 49,216 | -53,823 | 4,607 |
| – Gross Longs: | 86,191 | 108,555 | 12,975 |
| – Gross Shorts: | 36,975 | 162,378 | 8,368 |
| – Long to Short Ratio: | 2.3 to 1 | 0.7 to 1 | 1.6 to 1 |
| NET POSITION TREND: | |||
| – Strength Index Score (3 Year Range Pct): | 68.2 | 30.8 | 60.9 |
| – Strength Index Reading (3 Year Range): | Bullish | Bearish | Bullish |
| NET POSITION MOVEMENT INDEX: | |||
| – 6-Week Change in Strength Index: | 39.0 | -40.4 | 28.2 |
This week’s current strength score (the trader positioning range over the past three years, measured from 0 to 100) shows the speculators are currently Bearish with a score of 42.0 percent. The commercials are Bullish with a score of 50.6 percent and the small traders (not shown in chart) are Bullish-Extreme with a score of 81.7 percent.
| WHEAT Futures Statistics | SPECULATORS | COMMERCIALS | SMALL TRADERS |
| – Percent of Open Interest Longs: | 26.5 | 39.0 | 8.6 |
| – Percent of Open Interest Shorts: | 28.0 | 36.5 | 9.6 |
| – Net Position: | -5,846 | 10,013 | -4,167 |
| – Gross Longs: | 106,622 | 156,858 | 34,592 |
| – Gross Shorts: | 112,468 | 146,845 | 38,759 |
| – Long to Short Ratio: | 0.9 to 1 | 1.1 to 1 | 0.9 to 1 |
| NET POSITION TREND: | |||
| – Strength Index Score (3 Year Range Pct): | 42.0 | 50.6 | 81.7 |
| – Strength Index Reading (3 Year Range): | Bearish | Bullish | Bullish-Extreme |
| NET POSITION MOVEMENT INDEX: | |||
| – 6-Week Change in Strength Index: | -8.5 | 3.7 | 29.4 |
Article By InvestMacro – Receive our weekly COT Reports by Email
*COT Report: The COT data, released weekly to the public each Friday, is updated through the most recent Tuesday (data is 3 days old) and shows a quick view of how large speculators or non-commercials (for-profit traders) were positioned in the futures markets.
The CFTC categorizes trader positions according to commercial hedgers (traders who use futures contracts for hedging as part of the business), non-commercials (large traders who speculate to realize trading profits) and nonreportable traders (usually small traders/speculators) as well as their open interest (contracts open in the market at time of reporting).See CFTC criteria here.
By Jeffrey Young, Georgia Institute of Technology You’ve probably heard artificial intelligence models described as…
Source: Barry Dawes (7/23/26) Barry Dawes of Martin Place Securities shares his analysis of the…
By JustMarkets The US stock indices ended Thursday’s session with a notable decline amid a…
By Analytical Department RoboForex USD/JPY soared to 163.81 on Friday, marking a new 40-year high.…
By JustMarkets The US equities ended Wednesday’s session lower amid investor caution ahead of the…
By Analytical Department RoboForex EUR/USD rose to 1.1429 on Thursday, with the US dollar continuing…
This website uses cookies.