
By RoboForex Analytical Department
The US stock market has surged to new heights, with the S&P 500 index reaching a record high of 5,325 points and the DJIA index touching 40,000 points. Investors are experiencing euphoria, spurred by the unexpectedly low US inflation figures released earlier.
Inflation has recently been a critical driver of market volatility, thus its stabilisation is a cause for significant optimism. The April CPI increase, lower than expected at just 0.3% month-on-month, suggests a potential return to a downward inflation trajectory. Year-on-year, the CPI climbed by 3.4% in April, a slight dip from 3.5% in March. Inflation peaked in June 2022 at 9.1%, and while there was progress, the current deceleration is encouraging for investors.
The April inflation report marked the first decline in year-on-year inflation since January 2024. The CPI rose slower, raising market hopes that the Federal Reserve might soon ease monetary conditions.
Technical analysis of S&P 500
Free Reports:
 Download Our Metatrader 4 Indicators – Put Our Free MetaTrader 4 Custom Indicators on your charts when you join our Weekly Newsletter
 Get our Weekly Commitment of Traders Reports - See where the biggest traders (Hedge Funds and Commercial Hedgers) are positioned in the futures markets on a weekly basis.
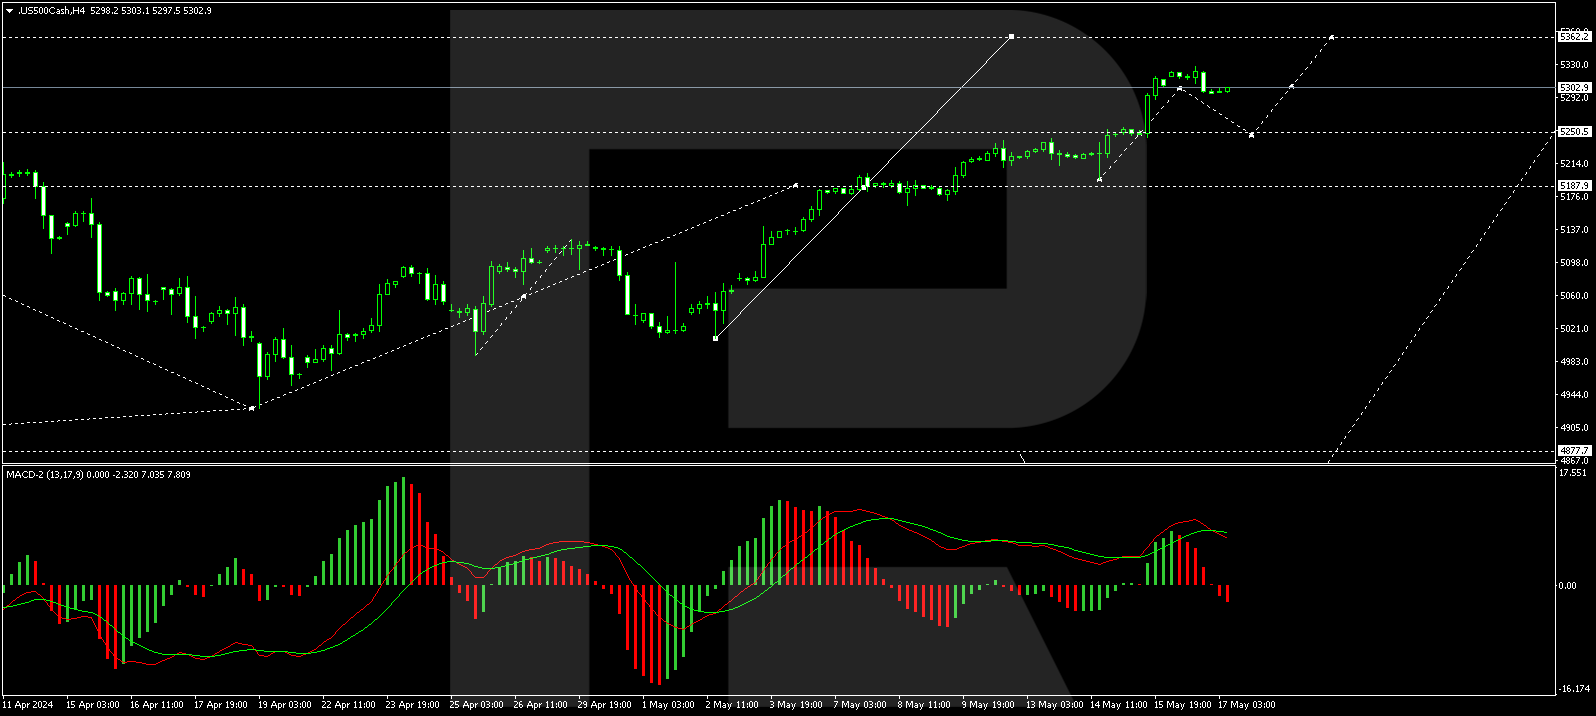
On the H4 chart of the S&P 500 index, a consolidation range has formed around the 5188.0 level. With an upward breakout, extending the fifth wave to 5363.0 is possible. The growth link to 5315.0 has been executed, and we now expect a consolidation range to form around this level. A downward breakout could lead to a range expansion to 5250.5, while an upward breakout could extend to 5363.0. The market is developing the fifth wave of growth without any significant correction, and a sharp decline along the trend to 4735.0 could begin at any moment. This scenario is technically supported by the MACD indicator, with its signal line at the maximums and pointing strictly downwards.
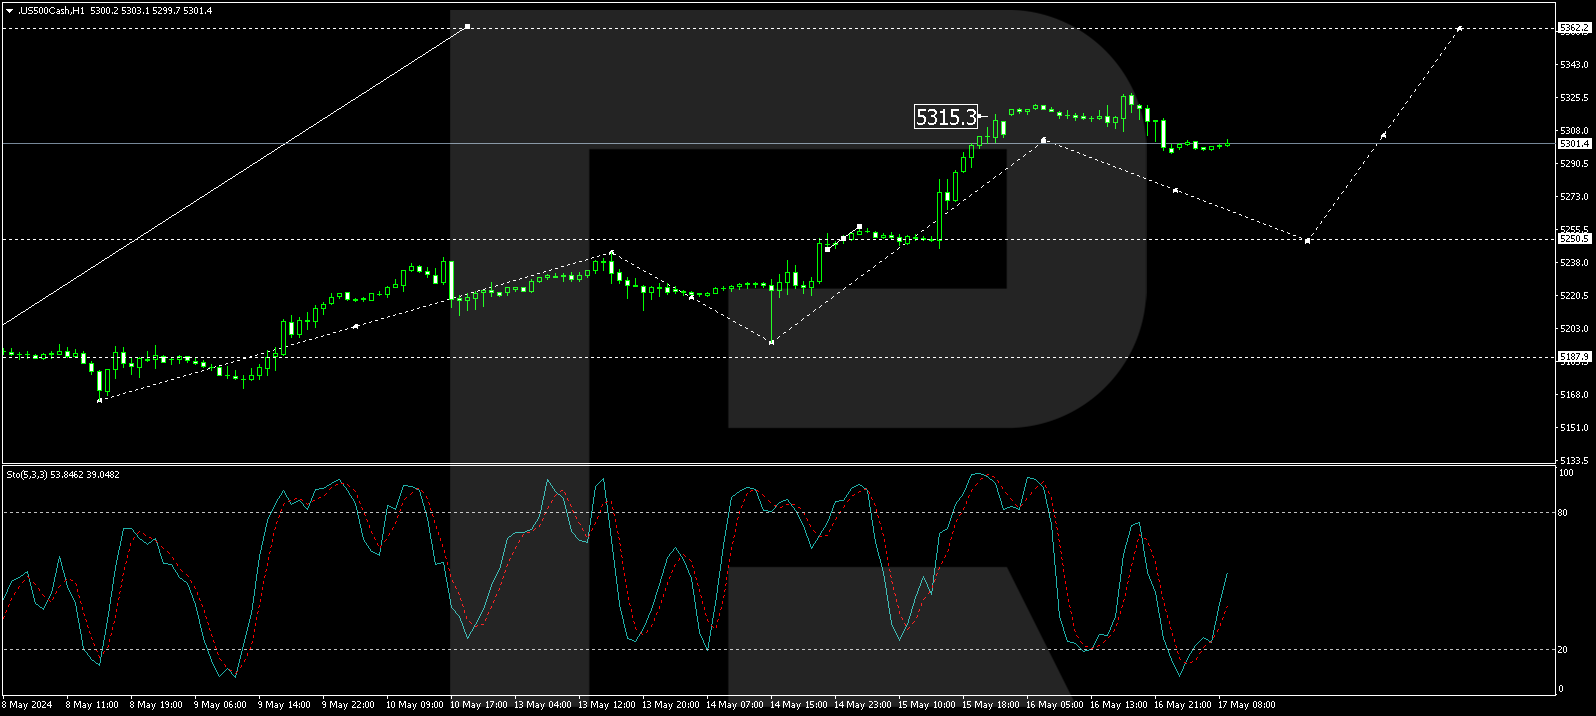
On the H1 chart, the upward move to 5315.5 has been completed. A consolidation range is forming around this level, and a downward impulse to 5296.0 has been fulfilled. We expect a growth link to 5315.5 (testing from below) today. A downward breakout from the range could lead to a continuation of the decrease wave to 5250.5. The Stochastic oscillator technically confirms this scenario, with its signal line above 20 and expected to rise to 80, indicating a potential for continued growth.
Disclaimer
Any forecasts contained herein are based on the author’s particular opinion. This analysis may not be treated as trading advice. RoboForex bears no responsibility for trading results based on trading recommendations and reviews contained herein.

- COT Metals Charts: Weekly Speculator Bets see small gains for Silver & Gold Jul 12, 2026
- COT Bonds Charts: Speculator Bets led by SOFR 3-Months & 2-Year Bonds Jul 12, 2026
- COT Energy Charts: Weekly Speculator Changes led by Brent Oil Jul 12, 2026
- COT Soft Commodities Charts: Weekly Speculator Changes led by Sugar, Corn & Soybeans Jul 12, 2026
- The US and European stock indices are rising again amid renewed investor interest in the AI industry. Jul 10, 2026
- USD/JPY Falls as Yen Recovers Weekly Losses Jul 10, 2026
- Crude oil prices surged sharply by 7% in reaction to the rapid escalation of the conflict in the Middle East Jul 9, 2026
- Middle East Tensions Weigh on Gold Jul 9, 2026
- Pound Awaits Tighter Policy from Bank of England Jul 8, 2026
- The United States carried out airstrikes on Iran after Iran’s attacked tankers in the Strait of Hormuz. The RBNZ raised the interest rate to 2.5% Jul 8, 2026