By InvestMacro | COT | Data Tables | COT Leaders | Downloads | COT Newsletter
Here are the latest charts and statistics for the Commitment of Traders (COT) data published by the Commodities Futures Trading Commission (CFTC).
The latest COT data is updated through Tuesday January 18th 2022 and shows a quick view of how large traders (for-profit speculators and commercial entities) were positioned in the futures markets.
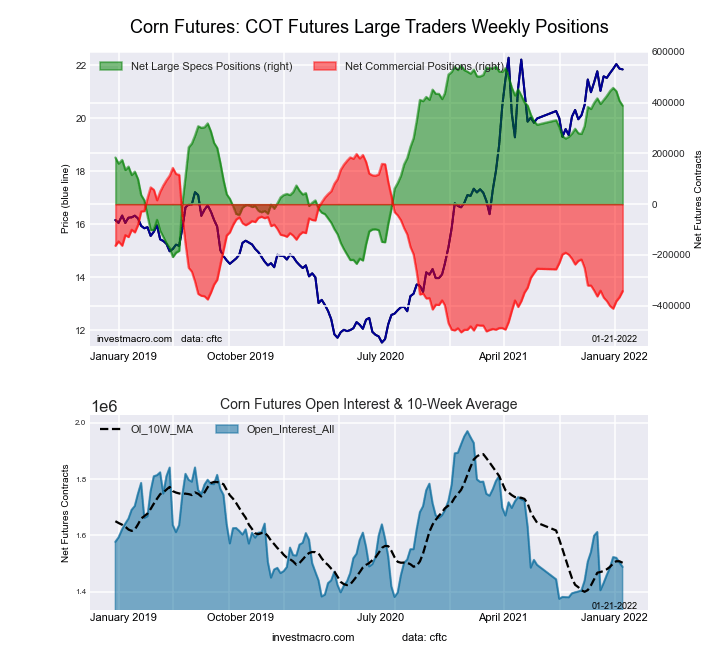
Highlighting the COT soft commodities data is the recent declines in Corn futures bets. The speculative net position in the Corn futures has fallen for three straight weeks with a total drop by -70,038 contracts over that time-frame. This has brought the current net standing to the lowest level of the past ten weeks and under the +400,000 net contract level for the first time since November 30th. The Corn strength score (current speculator standing compared to past three years where above 80 is bullish extreme & below 20 is bearish extreme) also dipped and fell below the extreme bullish line of 80 percent this week (also first time in 10 weeks) to sit currently at 79.6 percent.
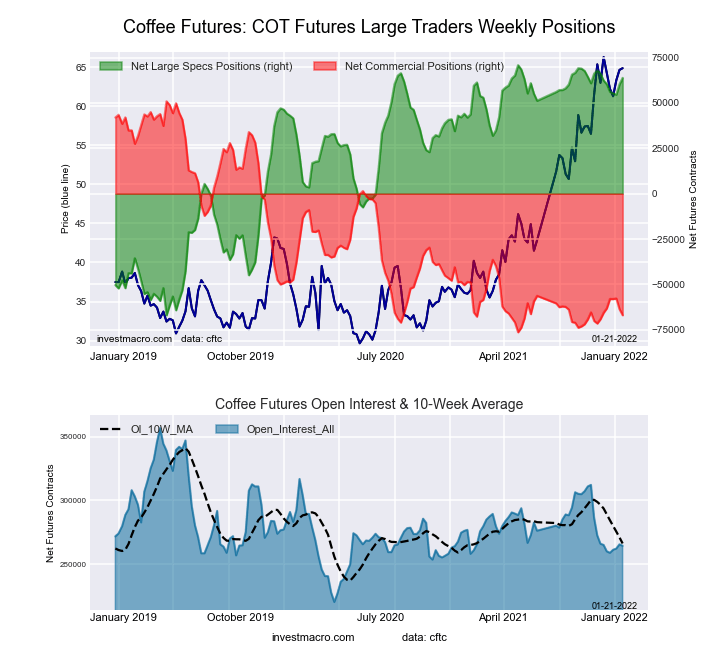
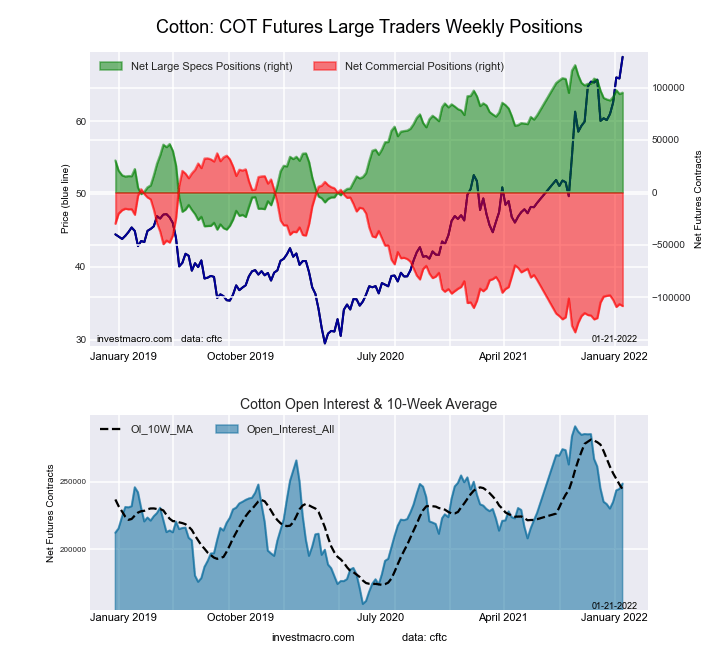
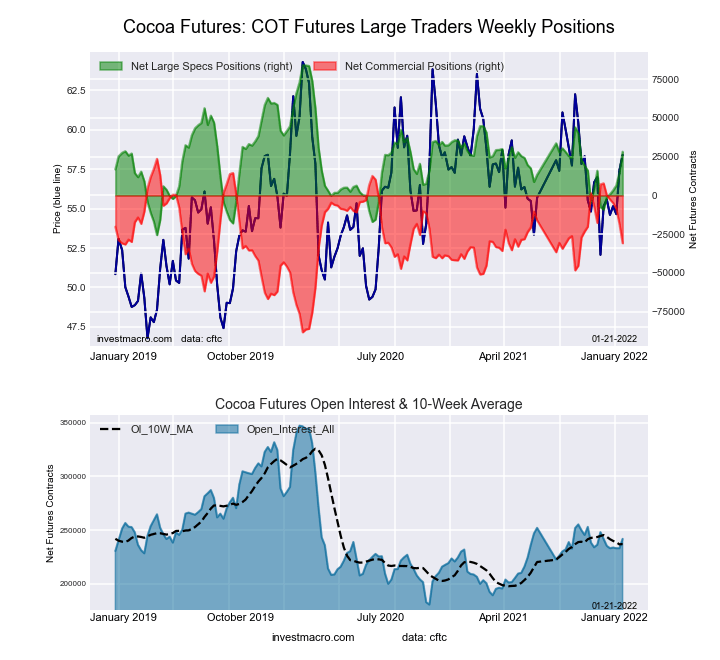
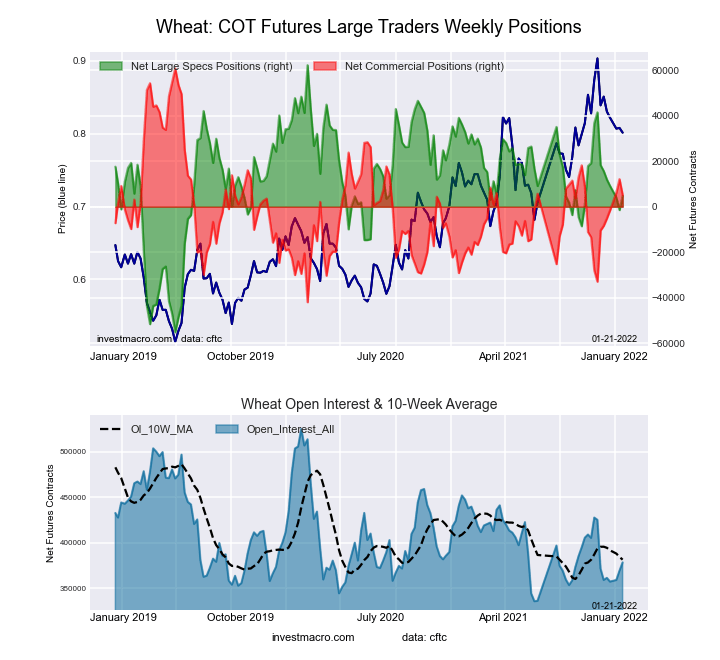
The soft commodities that saw higher speculator bets this week were Coffee (3,616 contracts), Soybean Oil (1,586 contracts), Live Cattle (1,742 contracts), Cotton (1,304 contracts), Cocoa (13,281 contracts), and Wheat (6,306 contracts).
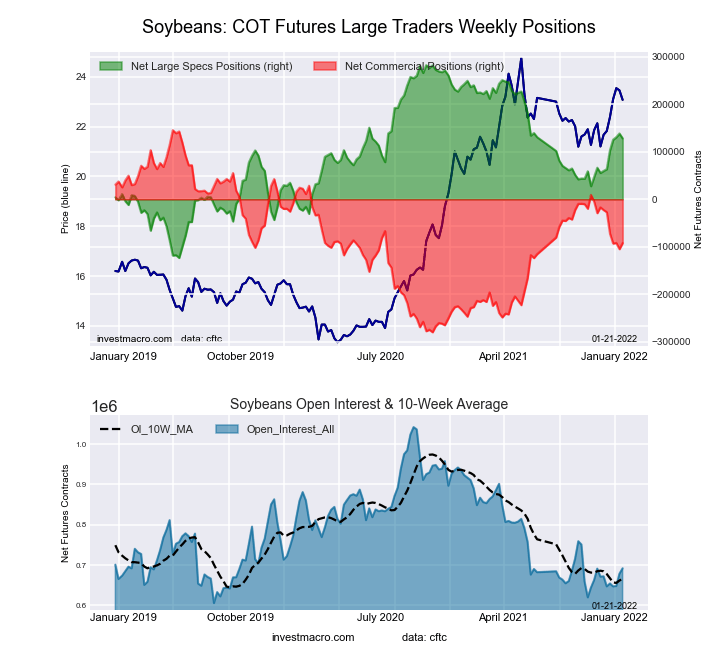
Markets with lower speculator bets this week were Corn (-19,354 contracts), Sugar (-9,757 contracts), Lean Hogs (-2,349 contracts), Soybean Meal (-16,281 contracts) and Soybeans (-10,257 contracts).
Free Reports:
| Jan-18-2022 | OI | OI-Index | Spec-Net | Spec-Index | Com-Net | COM-Index | Smalls-Net | Smalls-Index |
|---|---|---|---|---|---|---|---|---|
| WTI Crude | 2,059,564 | 29 | 385,781 | 32 | -427,052 | 59 | 41,271 | 73 |
| Gold | 539,204 | 30 | 194,207 | 50 | -221,068 | 50 | 26,861 | 40 |
| Silver | 148,737 | 15 | 29,700 | 52 | -41,540 | 58 | 11,840 | 12 |
| Copper | 203,198 | 29 | 22,310 | 58 | -30,538 | 38 | 8,228 | 73 |
| Palladium | 9,372 | 13 | -3,309 | 3 | 3,409 | 96 | -100 | 39 |
| Platinum | 57,321 | 17 | 7,229 | 13 | -12,911 | 91 | 5,682 | 41 |
| Natural Gas | 1,169,188 | 14 | -118,047 | 43 | 86,174 | 58 | 31,873 | 60 |
| Brent | 227,413 | 61 | -20,206 | 84 | 17,211 | 18 | 2,995 | 50 |
| Heating Oil | 367,686 | 42 | 14,827 | 64 | -39,935 | 29 | 25,108 | 85 |
| Soybeans | 692,022 | 20 | 128,015 | 62 | -92,198 | 44 | -35,817 | 12 |
| Corn | 1,487,858 | 19 | 388,138 | 80 | -342,687 | 23 | -45,451 | 17 |
| Coffee | 264,394 | 32 | 63,784 | 95 | -66,937 | 7 | 3,153 | 10 |
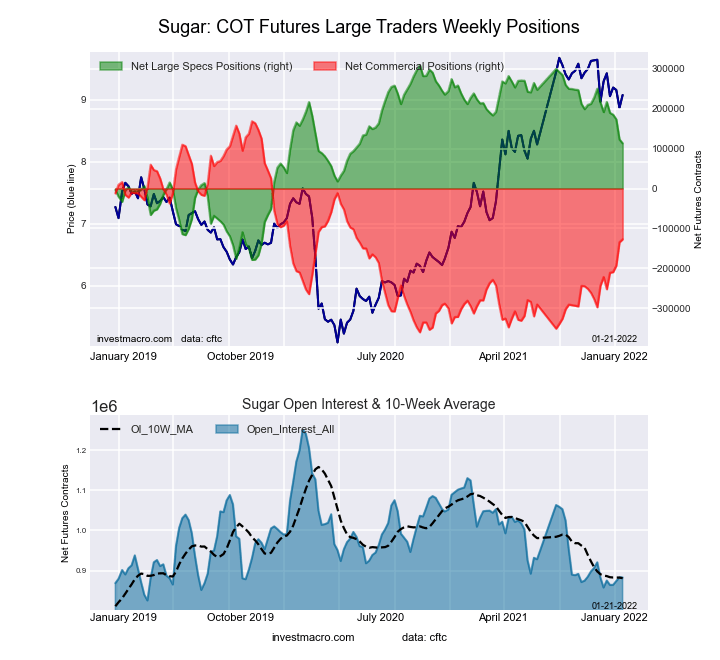
| Sugar | 882,598 | 13 | 113,168 | 60 | -127,053 | 44 | 13,885 | 25 |
| Wheat | 378,456 | 23 | 4,840 | 51 | 5,160 | 46 | -10,000 | 54 |
This week’s current strength score (the trader positioning range over the past three years, measured from 0 to 100) shows the speculators are currently Bullish with a score of 79.6 percent. The commercials are Bearish with a score of 23.1 percent and the small traders (not shown in chart) are Bearish-Extreme with a score of 16.9 percent.
| CORN Futures Statistics | SPECULATORS | COMMERCIALS | SMALL TRADERS |
| – Percent of Open Interest Longs: | 32.0 | 46.3 | 9.3 |
| – Percent of Open Interest Shorts: | 5.9 | 69.3 | 12.4 |
| – Net Position: | 388,138 | -342,687 | -45,451 |
| – Gross Longs: | 476,449 | 688,600 | 138,491 |
| – Gross Shorts: | 88,311 | 1,031,287 | 183,942 |
| – Long to Short Ratio: | 5.4 to 1 | 0.7 to 1 | 0.8 to 1 |
| NET POSITION TREND: | |||
| – Strength Index Score (3 Year Range Pct): | 79.6 | 23.1 | 16.9 |
| – Strength Index Reading (3 Year Range): | Bullish | Bearish | Bearish-Extreme |
| NET POSITION MOVEMENT INDEX: | |||
| – 6-Week Change in Strength Index: | -2.9 | 3.6 | -1.4 |
This week’s current strength score (the trader positioning range over the past three years, measured from 0 to 100) shows the speculators are currently Bullish with a score of 59.9 percent. The commercials are Bearish with a score of 44.1 percent and the small traders (not shown in chart) are Bearish with a score of 25.0 percent.
| SUGAR Futures Statistics | SPECULATORS | COMMERCIALS | SMALL TRADERS |
| – Percent of Open Interest Longs: | 21.8 | 54.4 | 8.5 |
| – Percent of Open Interest Shorts: | 9.0 | 68.8 | 6.9 |
| – Net Position: | 113,168 | -127,053 | 13,885 |
| – Gross Longs: | 192,577 | 480,302 | 74,979 |
| – Gross Shorts: | 79,409 | 607,355 | 61,094 |
| – Long to Short Ratio: | 2.4 to 1 | 0.8 to 1 | 1.2 to 1 |
| NET POSITION TREND: | |||
| – Strength Index Score (3 Year Range Pct): | 59.9 | 44.1 | 25.0 |
| – Strength Index Reading (3 Year Range): | Bullish | Bearish | Bearish |
| NET POSITION MOVEMENT INDEX: | |||
| – 6-Week Change in Strength Index: | -16.0 | 17.9 | -20.0 |
This week’s current strength score (the trader positioning range over the past three years, measured from 0 to 100) shows the speculators are currently Bullish-Extreme with a score of 94.9 percent. The commercials are Bearish-Extreme with a score of 7.4 percent and the small traders (not shown in chart) are Bearish-Extreme with a score of 10.1 percent.
| COFFEE Futures Statistics | SPECULATORS | COMMERCIALS | SMALL TRADERS |
| – Percent of Open Interest Longs: | 28.7 | 42.6 | 3.9 |
| – Percent of Open Interest Shorts: | 4.6 | 68.0 | 2.8 |
| – Net Position: | 63,784 | -66,937 | 3,153 |
| – Gross Longs: | 75,931 | 112,761 | 10,428 |
| – Gross Shorts: | 12,147 | 179,698 | 7,275 |
| – Long to Short Ratio: | 6.3 to 1 | 0.6 to 1 | 1.4 to 1 |
| NET POSITION TREND: | |||
| – Strength Index Score (3 Year Range Pct): | 94.9 | 7.4 | 10.1 |
| – Strength Index Reading (3 Year Range): | Bullish-Extreme | Bearish-Extreme | Bearish-Extreme |
| NET POSITION MOVEMENT INDEX: | |||
| – 6-Week Change in Strength Index: | 1.0 | -1.1 | -0.7 |
This week’s current strength score (the trader positioning range over the past three years, measured from 0 to 100) shows the speculators are currently Bullish with a score of 62.0 percent. The commercials are Bearish with a score of 44.1 percent and the small traders (not shown in chart) are Bearish-Extreme with a score of 12.2 percent.
| SOYBEANS Futures Statistics | SPECULATORS | COMMERCIALS | SMALL TRADERS |
| – Percent of Open Interest Longs: | 26.0 | 52.5 | 6.8 |
| – Percent of Open Interest Shorts: | 7.5 | 65.9 | 11.9 |
| – Net Position: | 128,015 | -92,198 | -35,817 |
| – Gross Longs: | 179,661 | 363,536 | 46,718 |
| – Gross Shorts: | 51,646 | 455,734 | 82,535 |
| – Long to Short Ratio: | 3.5 to 1 | 0.8 to 1 | 0.6 to 1 |
| NET POSITION TREND: | |||
| – Strength Index Score (3 Year Range Pct): | 62.0 | 44.1 | 12.2 |
| – Strength Index Reading (3 Year Range): | Bullish | Bearish | Bearish-Extreme |
| NET POSITION MOVEMENT INDEX: | |||
| – 6-Week Change in Strength Index: | 16.9 | -16.3 | 1.8 |
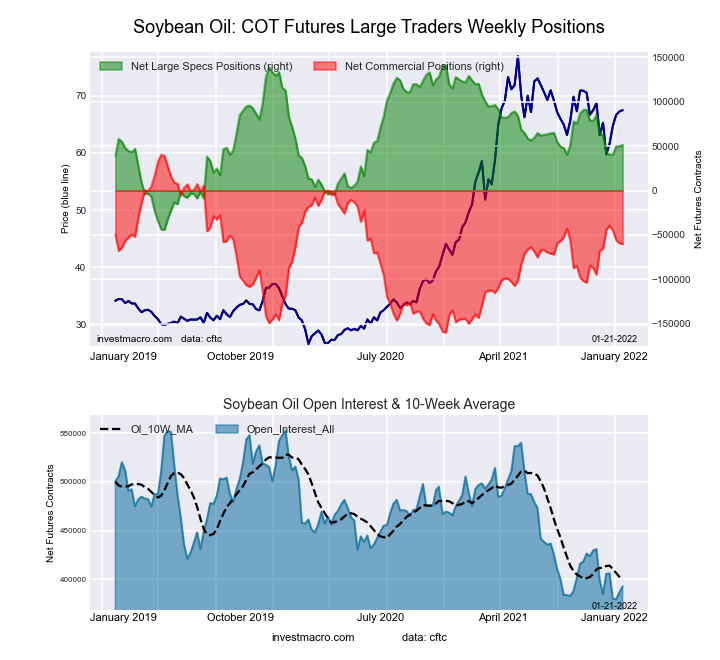
This week’s current strength score (the trader positioning range over the past three years, measured from 0 to 100) shows the speculators are currently Bullish with a score of 51.6 percent. The commercials are Bearish with a score of 49.7 percent and the small traders (not shown in chart) are Bearish with a score of 45.5 percent.
| SOYBEAN OIL Futures Statistics | SPECULATORS | COMMERCIALS | SMALL TRADERS |
| – Percent of Open Interest Longs: | 24.5 | 50.7 | 8.3 |
| – Percent of Open Interest Shorts: | 11.4 | 66.0 | 6.1 |
| – Net Position: | 51,503 | -60,100 | 8,597 |
| – Gross Longs: | 96,428 | 199,019 | 32,509 |
| – Gross Shorts: | 44,925 | 259,119 | 23,912 |
| – Long to Short Ratio: | 2.1 to 1 | 0.8 to 1 | 1.4 to 1 |
| NET POSITION TREND: | |||
| – Strength Index Score (3 Year Range Pct): | 51.6 | 49.7 | 45.5 |
| – Strength Index Reading (3 Year Range): | Bullish | Bearish | Bearish |
| NET POSITION MOVEMENT INDEX: | |||
| – 6-Week Change in Strength Index: | -5.9 | 2.7 | 20.7 |
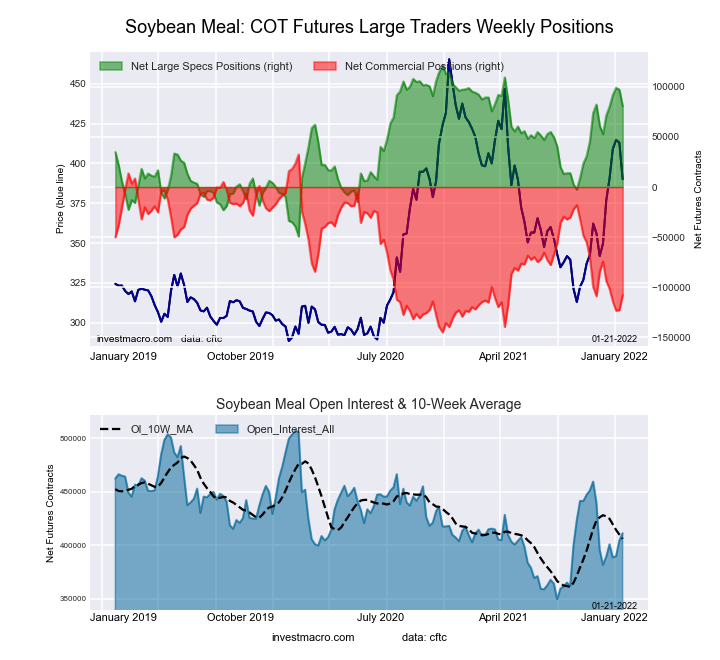
This week’s current strength score (the trader positioning range over the past three years, measured from 0 to 100) shows the speculators are currently Bullish with a score of 76.2 percent. The commercials are Bearish with a score of 20.9 percent and the small traders (not shown in chart) are Bullish with a score of 79.2 percent.
| SOYBEAN MEAL Futures Statistics | SPECULATORS | COMMERCIALS | SMALL TRADERS |
| – Percent of Open Interest Longs: | 26.6 | 46.7 | 12.5 |
| – Percent of Open Interest Shorts: | 6.9 | 72.9 | 6.0 |
| – Net Position: | 80,893 | -107,973 | 27,080 |
| – Gross Longs: | 109,188 | 191,878 | 51,582 |
| – Gross Shorts: | 28,295 | 299,851 | 24,502 |
| – Long to Short Ratio: | 3.9 to 1 | 0.6 to 1 | 2.1 to 1 |
| NET POSITION TREND: | |||
| – Strength Index Score (3 Year Range Pct): | 76.2 | 20.9 | 79.2 |
| – Strength Index Reading (3 Year Range): | Bullish | Bearish | Bullish |
| NET POSITION MOVEMENT INDEX: | |||
| – 6-Week Change in Strength Index: | 16.5 | -18.9 | 21.6 |
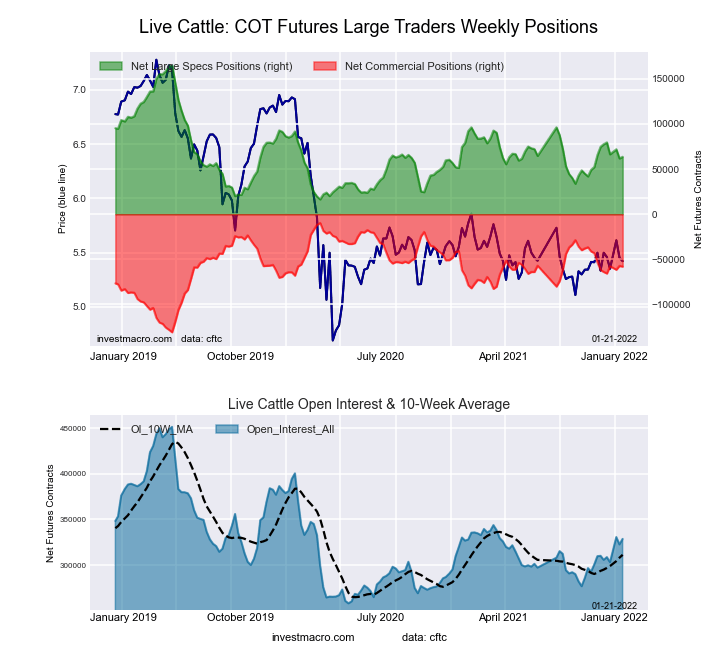
This week’s current strength score (the trader positioning range over the past three years, measured from 0 to 100) shows the speculators are currently Bearish with a score of 31.7 percent. The commercials are Bullish with a score of 60.1 percent and the small traders (not shown in chart) are Bullish with a score of 73.8 percent.
| LIVE CATTLE Futures Statistics | SPECULATORS | COMMERCIALS | SMALL TRADERS |
| – Percent of Open Interest Longs: | 33.9 | 38.5 | 10.8 |
| – Percent of Open Interest Shorts: | 14.6 | 56.2 | 12.4 |
| – Net Position: | 63,562 | -58,078 | -5,484 |
| – Gross Longs: | 111,509 | 126,608 | 35,421 |
| – Gross Shorts: | 47,947 | 184,686 | 40,905 |
| – Long to Short Ratio: | 2.3 to 1 | 0.7 to 1 | 0.9 to 1 |
| NET POSITION TREND: | |||
| – Strength Index Score (3 Year Range Pct): | 31.7 | 60.1 | 73.8 |
| – Strength Index Reading (3 Year Range): | Bearish | Bullish | Bullish |
| NET POSITION MOVEMENT INDEX: | |||
| – 6-Week Change in Strength Index: | -9.4 | 4.9 | 19.6 |
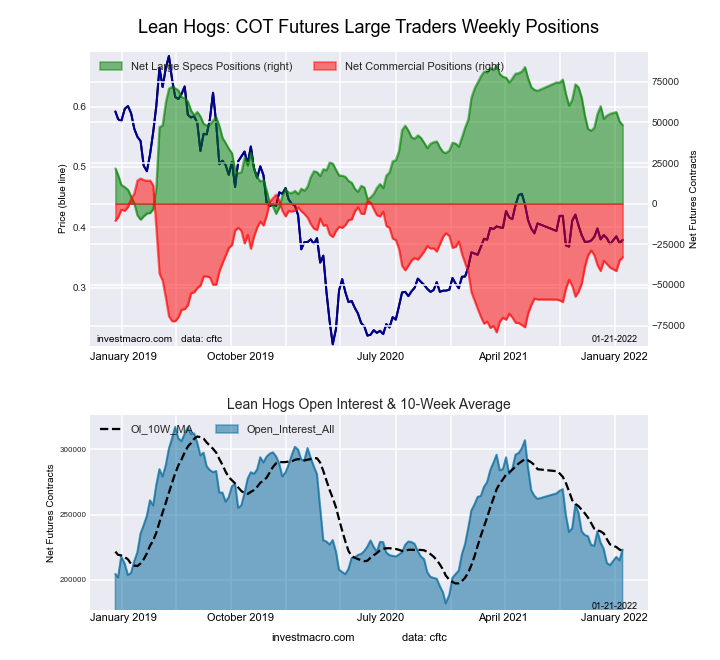
This week’s current strength score (the trader positioning range over the past three years, measured from 0 to 100) shows the speculators are currently Bullish with a score of 60.9 percent. The commercials are Bearish with a score of 48.9 percent and the small traders (not shown in chart) are Bearish-Extreme with a score of 13.6 percent.
| LEAN HOGS Futures Statistics | SPECULATORS | COMMERCIALS | SMALL TRADERS |
| – Percent of Open Interest Longs: | 36.3 | 37.6 | 7.6 |
| – Percent of Open Interest Shorts: | 14.7 | 52.3 | 14.5 |
| – Net Position: | 48,305 | -32,883 | -15,422 |
| – Gross Longs: | 81,054 | 83,993 | 16,970 |
| – Gross Shorts: | 32,749 | 116,876 | 32,392 |
| – Long to Short Ratio: | 2.5 to 1 | 0.7 to 1 | 0.5 to 1 |
| NET POSITION TREND: | |||
| – Strength Index Score (3 Year Range Pct): | 60.9 | 48.9 | 13.6 |
| – Strength Index Reading (3 Year Range): | Bullish | Bearish | Bearish-Extreme |
| NET POSITION MOVEMENT INDEX: | |||
| – 6-Week Change in Strength Index: | -4.2 | 2.3 | 7.6 |
This week’s current strength score (the trader positioning range over the past three years, measured from 0 to 100) shows the speculators are currently Bullish-Extreme with a score of 83.3 percent. The commercials are Bearish-Extreme with a score of 14.7 percent and the small traders (not shown in chart) are Bullish-Extreme with a score of 95.5 percent.
| COTTON Futures Statistics | SPECULATORS | COMMERCIALS | SMALL TRADERS |
| – Percent of Open Interest Longs: | 43.7 | 34.0 | 8.5 |
| – Percent of Open Interest Shorts: | 5.4 | 77.6 | 3.2 |
| – Net Position: | 95,126 | -108,260 | 13,134 |
| – Gross Longs: | 108,446 | 84,470 | 21,002 |
| – Gross Shorts: | 13,320 | 192,730 | 7,868 |
| – Long to Short Ratio: | 8.1 to 1 | 0.4 to 1 | 2.7 to 1 |
| NET POSITION TREND: | |||
| – Strength Index Score (3 Year Range Pct): | 83.3 | 14.7 | 95.5 |
| – Strength Index Reading (3 Year Range): | Bullish-Extreme | Bearish-Extreme | Bullish-Extreme |
| NET POSITION MOVEMENT INDEX: | |||
| – 6-Week Change in Strength Index: | 3.3 | -5.3 | 24.0 |
This week’s current strength score (the trader positioning range over the past three years, measured from 0 to 100) shows the speculators are currently Bearish with a score of 49.1 percent. The commercials are Bullish with a score of 51.4 percent and the small traders (not shown in chart) are Bearish with a score of 38.1 percent.
| COCOA Futures Statistics | SPECULATORS | COMMERCIALS | SMALL TRADERS |
| – Percent of Open Interest Longs: | 26.3 | 48.1 | 5.0 |
| – Percent of Open Interest Shorts: | 14.6 | 60.9 | 3.9 |
| – Net Position: | 28,214 | -30,821 | 2,607 |
| – Gross Longs: | 63,470 | 116,402 | 12,024 |
| – Gross Shorts: | 35,256 | 147,223 | 9,417 |
| – Long to Short Ratio: | 1.8 to 1 | 0.8 to 1 | 1.3 to 1 |
| NET POSITION TREND: | |||
| – Strength Index Score (3 Year Range Pct): | 49.1 | 51.4 | 38.1 |
| – Strength Index Reading (3 Year Range): | Bearish | Bullish | Bearish |
| NET POSITION MOVEMENT INDEX: | |||
| – 6-Week Change in Strength Index: | 34.0 | -34.5 | 14.9 |
This week’s current strength score (the trader positioning range over the past three years, measured from 0 to 100) shows the speculators are currently Bullish with a score of 51.1 percent. The commercials are Bearish with a score of 45.9 percent and the small traders (not shown in chart) are Bullish with a score of 53.8 percent.
| WHEAT Futures Statistics | SPECULATORS | COMMERCIALS | SMALL TRADERS |
| – Percent of Open Interest Longs: | 28.2 | 41.0 | 8.0 |
| – Percent of Open Interest Shorts: | 26.9 | 39.6 | 10.7 |
| – Net Position: | 4,840 | 5,160 | -10,000 |
| – Gross Longs: | 106,763 | 155,144 | 30,339 |
| – Gross Shorts: | 101,923 | 149,984 | 40,339 |
| – Long to Short Ratio: | 1.0 to 1 | 1.0 to 1 | 0.8 to 1 |
| NET POSITION TREND: | |||
| – Strength Index Score (3 Year Range Pct): | 51.1 | 45.9 | 53.8 |
| – Strength Index Reading (3 Year Range): | Bullish | Bearish | Bullish |
| NET POSITION MOVEMENT INDEX: | |||
| – 6-Week Change in Strength Index: | -9.2 | 13.2 | -13.0 |
Article By InvestMacro – Receive our weekly COT Reports by Email
*COT Report: The COT data, released weekly to the public each Friday, is updated through the most recent Tuesday (data is 3 days old) and shows a quick view of how large speculators or non-commercials (for-profit traders) were positioned in the futures markets.
The CFTC categorizes trader positions according to commercial hedgers (traders who use futures contracts for hedging as part of the business), non-commercials (large traders who speculate to realize trading profits) and nonreportable traders (usually small traders/speculators) as well as their open interest (contracts open in the market at time of reporting).See CFTC criteria here.
By JustMarkets The US stock indices ended Friday’s session in the red. By the end…
By Analytical Department RoboForex USD/JPY opens the week at 162.36 on Monday. The Japanese yen…
By InvestMacro Here are the latest charts and statistics for the Commitment of Traders (COT)…
By InvestMacro The latest update for the weekly Commitment of Traders (COT) report was released…
By InvestMacro Here are the latest charts and statistics for the Commitment of Traders (COT)…
By InvestMacro Here are the latest charts and statistics for the Commitment of Traders (COT)…
This website uses cookies.