By InvestMacro | COT | Data Tables | COT Leaders | Downloads | COT Newsletter
Here are the latest charts and statistics for the Commitment of Traders (COT) data published by the Commodities Futures Trading Commission (CFTC).
The latest COT data is updated through Tuesday January 18th and shows a quick view of how large traders (for-profit speculators and commercial entities) were positioned in the futures markets.
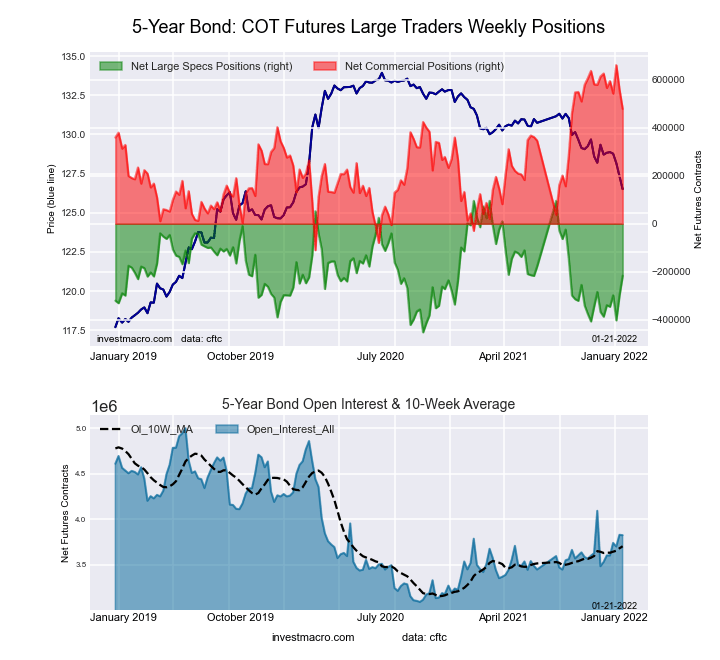
Highlighting the COT bonds data is the retreat in the 5-Year Bond bearish bets over the past couple of weeks. Speculators have reduced their bearish bets for the 5-Year Bond sharply for two straight weeks and by a total of 185,701 contracts over that two-week time-frame. This has brought the total net speculator standing from -402,875 contracts on January 4th to -217,174 contracts on January 18th. The drop in bearish bets brings the overall speculator standing to the least bearish level since September 21st when positions totaled -147,423 contracts. Speculative positions have been trending more and more bearish since early September as sentiment for bonds in general has eroded.
Joining the 5-Year (82,483 contracts) in gaining this week were the 10-Year (72,397 contracts), Long US Bond (17,542 contracts) and the FedFunds (55,280 contracts) while decreasing bets for the week were seen in Eurodollar (-46,964 contracts), 2-Year Bond (-13,181 contracts), Ultra 10-Year (-18,214 contracts) and the Ultra US Bond (-28,819 contracts).
| Jan-18-2022 | OI | OI-Index | Spec-Net | Spec-Index | Com-Net | COM-Index | Smalls-Net | Smalls-Index |
|---|---|---|---|---|---|---|---|---|
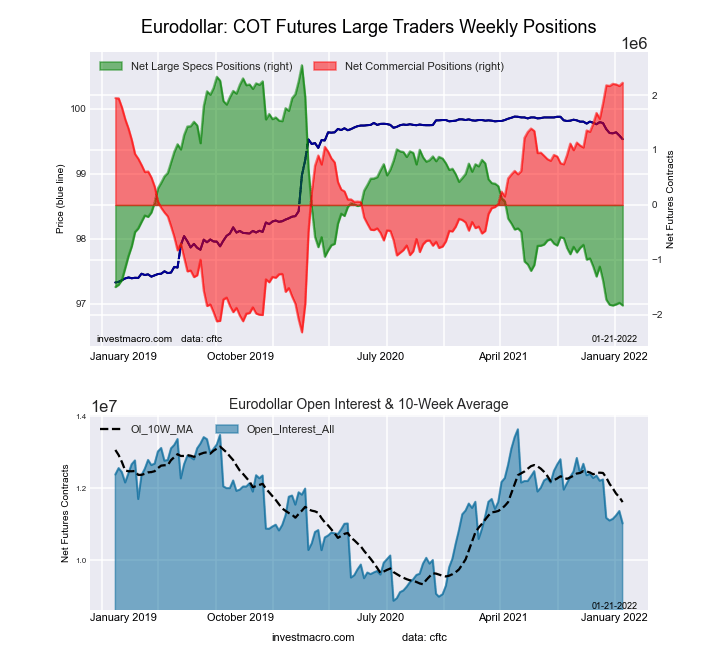
| Eurodollar | 11,026,173 | 45 | -1,827,293 | 0 | 2,222,703 | 100 | -395,410 | 20 |
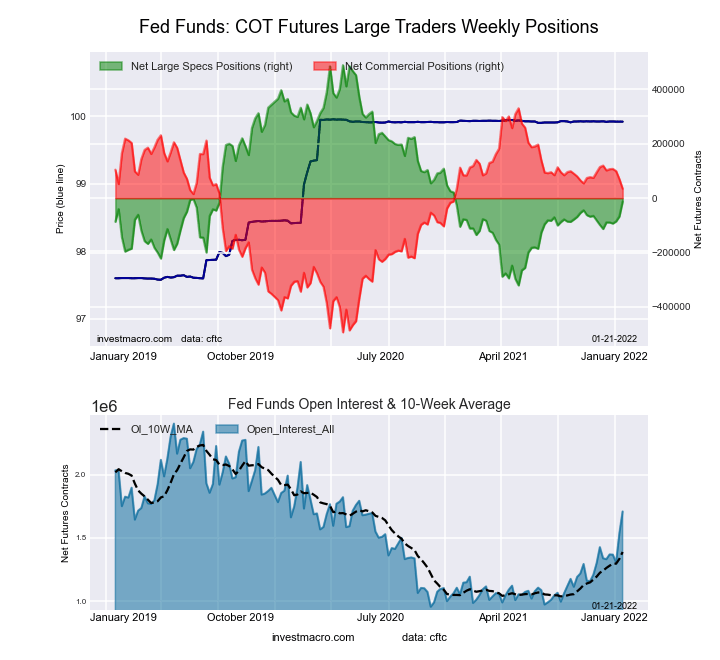
| FedFunds | 1,708,635 | 52 | -12,274 | 38 | 34,660 | 64 | -22,386 | 6 |
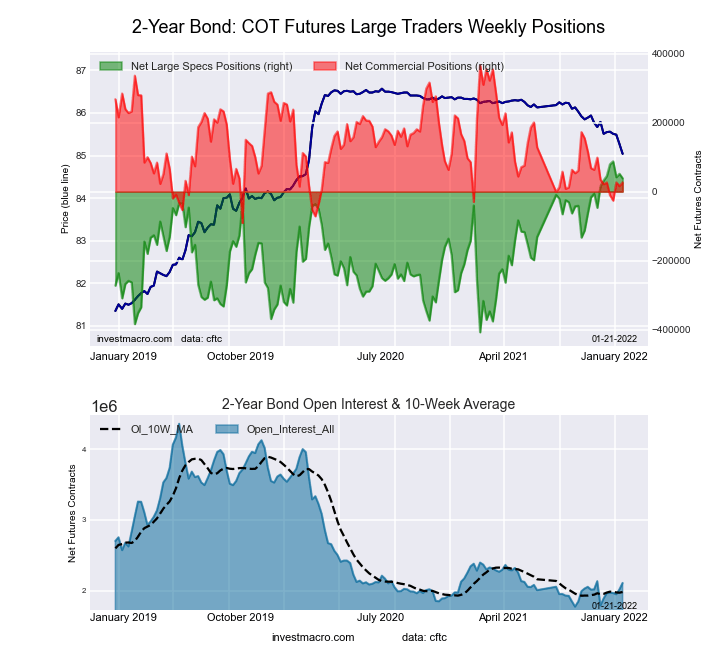
| 2-Year | 2,107,849 | 13 | 38,636 | 90 | 26,788 | 26 | -65,424 | 3 |
| Long T-Bond | 1,219,356 | 52 | -47,496 | 76 | 60,037 | 39 | -12,541 | 43 |
| 10-Year | 3,890,037 | 57 | -271,442 | 30 | 538,664 | 89 | -267,222 | 16 |
| 5-Year | 3,826,115 | 38 | -217,174 | 43 | 479,188 | 76 | -262,014 | 9 |
Free Reports:
This week’s current strength score (the trader positioning range over the past three years, measured from 0 to 100) shows the speculators are currently Bearish-Extreme with a score of 0.0 percent. The commercials are Bullish-Extreme with a score of 100.0 percent and the small traders (not shown in chart) are Bearish-Extreme with a score of 19.8 percent.
| 3-Month Eurodollars Statistics | SPECULATORS | COMMERCIALS | SMALL TRADERS |
| – Percent of Open Interest Longs: | 7.0 | 72.1 | 4.0 |
| – Percent of Open Interest Shorts: | 23.6 | 51.9 | 7.6 |
| – Net Position: | -1,827,293 | 2,222,703 | -395,410 |
| – Gross Longs: | 773,690 | 7,949,491 | 440,653 |
| – Gross Shorts: | 2,600,983 | 5,726,788 | 836,063 |
| – Long to Short Ratio: | 0.3 to 1 | 1.4 to 1 | 0.5 to 1 |
| NET POSITION TREND: | |||
| – Strength Index Score (3 Year Range Pct): | 0.0 | 100.0 | 19.8 |
| – Strength Index Reading (3 Year Range): | Bearish-Extreme | Bullish-Extreme | Bearish-Extreme |
| NET POSITION MOVEMENT INDEX: | |||
| – 6-Week Change in Strength Index: | -10.4 | 8.2 | 16.9 |
This week’s current strength score (the trader positioning range over the past three years, measured from 0 to 100) shows the speculators are currently Bearish with a score of 38.1 percent. The commercials are Bullish with a score of 64.1 percent and the small traders (not shown in chart) are Bearish-Extreme with a score of 6.4 percent.
| 30-Day Federal Funds Statistics | SPECULATORS | COMMERCIALS | SMALL TRADERS |
| – Percent of Open Interest Longs: | 5.7 | 76.1 | 1.4 |
| – Percent of Open Interest Shorts: | 6.4 | 74.1 | 2.7 |
| – Net Position: | -12,274 | 34,660 | -22,386 |
| – Gross Longs: | 97,755 | 1,300,612 | 24,099 |
| – Gross Shorts: | 110,029 | 1,265,952 | 46,485 |
| – Long to Short Ratio: | 0.9 to 1 | 1.0 to 1 | 0.5 to 1 |
| NET POSITION TREND: | |||
| – Strength Index Score (3 Year Range Pct): | 38.1 | 64.1 | 6.4 |
| – Strength Index Reading (3 Year Range): | Bearish | Bullish | Bearish-Extreme |
| NET POSITION MOVEMENT INDEX: | |||
| – 6-Week Change in Strength Index: | 12.5 | -10.3 | -39.1 |
This week’s current strength score (the trader positioning range over the past three years, measured from 0 to 100) shows the speculators are currently Bullish-Extreme with a score of 90.1 percent. The commercials are Bearish with a score of 25.7 percent and the small traders (not shown in chart) are Bearish-Extreme with a score of 3.3 percent.
| 2-Year Treasury Note Statistics | SPECULATORS | COMMERCIALS | SMALL TRADERS |
| – Percent of Open Interest Longs: | 19.1 | 71.5 | 5.9 |
| – Percent of Open Interest Shorts: | 17.3 | 70.2 | 9.0 |
| – Net Position: | 38,636 | 26,788 | -65,424 |
| – Gross Longs: | 402,602 | 1,506,177 | 123,871 |
| – Gross Shorts: | 363,966 | 1,479,389 | 189,295 |
| – Long to Short Ratio: | 1.1 to 1 | 1.0 to 1 | 0.7 to 1 |
| NET POSITION TREND: | |||
| – Strength Index Score (3 Year Range Pct): | 90.1 | 25.7 | 3.3 |
| – Strength Index Reading (3 Year Range): | Bullish-Extreme | Bearish | Bearish-Extreme |
| NET POSITION MOVEMENT INDEX: | |||
| – 6-Week Change in Strength Index: | 1.2 | 1.1 | -5.7 |
This week’s current strength score (the trader positioning range over the past three years, measured from 0 to 100) shows the speculators are currently Bearish with a score of 43.0 percent. The commercials are Bullish with a score of 76.4 percent and the small traders (not shown in chart) are Bearish-Extreme with a score of 9.1 percent.
| 5-Year Treasury Note Statistics | SPECULATORS | COMMERCIALS | SMALL TRADERS |
| – Percent of Open Interest Longs: | 9.2 | 81.2 | 6.8 |
| – Percent of Open Interest Shorts: | 14.9 | 68.7 | 13.6 |
| – Net Position: | -217,174 | 479,188 | -262,014 |
| – Gross Longs: | 352,444 | 3,107,310 | 258,755 |
| – Gross Shorts: | 569,618 | 2,628,122 | 520,769 |
| – Long to Short Ratio: | 0.6 to 1 | 1.2 to 1 | 0.5 to 1 |
| NET POSITION TREND: | |||
| – Strength Index Score (3 Year Range Pct): | 43.0 | 76.4 | 9.1 |
| – Strength Index Reading (3 Year Range): | Bearish | Bullish | Bearish-Extreme |
| NET POSITION MOVEMENT INDEX: | |||
| – 6-Week Change in Strength Index: | 31.1 | -19.1 | -6.2 |
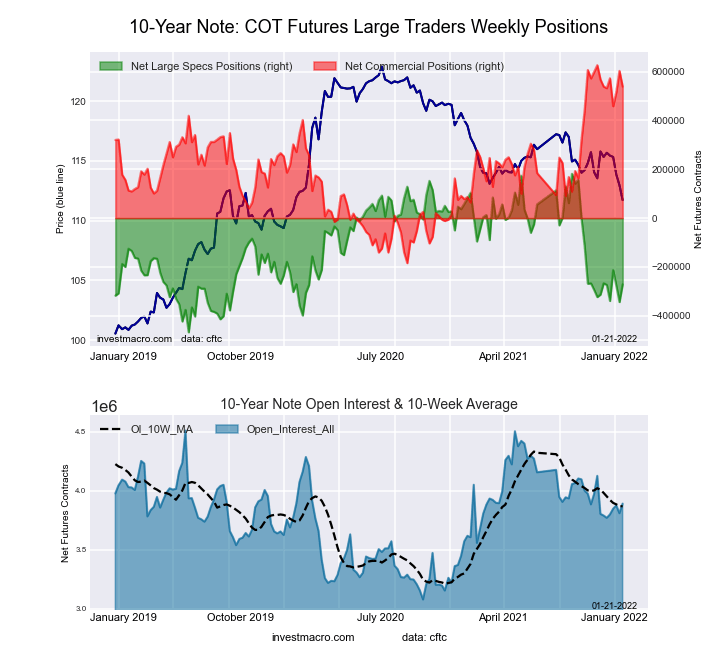
This week’s current strength score (the trader positioning range over the past three years, measured from 0 to 100) shows the speculators are currently Bearish with a score of 30.2 percent. The commercials are Bullish-Extreme with a score of 89.2 percent and the small traders (not shown in chart) are Bearish-Extreme with a score of 16.4 percent.
| 10-Year Treasury Note Statistics | SPECULATORS | COMMERCIALS | SMALL TRADERS |
| – Percent of Open Interest Longs: | 11.9 | 77.3 | 7.9 |
| – Percent of Open Interest Shorts: | 18.8 | 63.5 | 14.8 |
| – Net Position: | -271,442 | 538,664 | -267,222 |
| – Gross Longs: | 461,290 | 3,008,535 | 307,390 |
| – Gross Shorts: | 732,732 | 2,469,871 | 574,612 |
| – Long to Short Ratio: | 0.6 to 1 | 1.2 to 1 | 0.5 to 1 |
| NET POSITION TREND: | |||
| – Strength Index Score (3 Year Range Pct): | 30.2 | 89.2 | 16.4 |
| – Strength Index Reading (3 Year Range): | Bearish | Bullish-Extreme | Bearish-Extreme |
| NET POSITION MOVEMENT INDEX: | |||
| – 6-Week Change in Strength Index: | -0.7 | -0.0 | 1.1 |
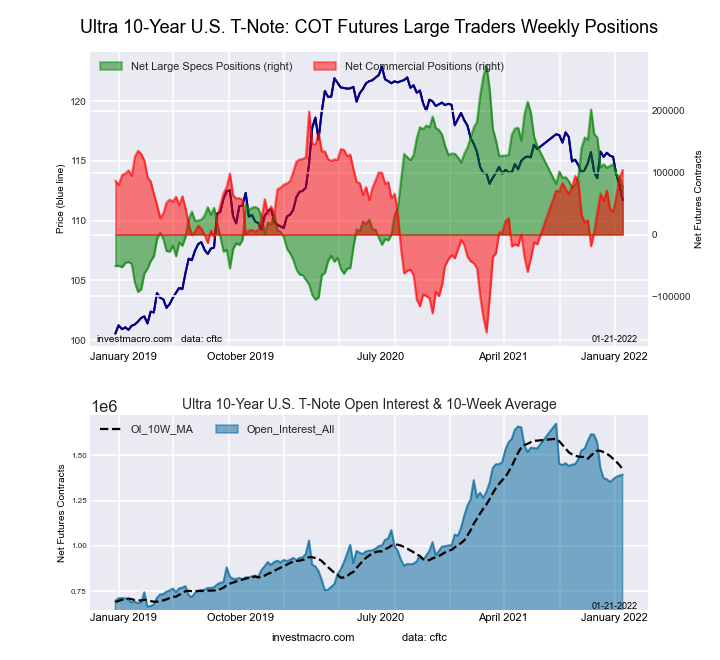
This week’s current strength score (the trader positioning range over the past three years, measured from 0 to 100) shows the speculators are currently Bearish with a score of 47.8 percent. The commercials are Bullish with a score of 73.5 percent and the small traders (not shown in chart) are Bearish-Extreme with a score of 7.0 percent.
| Ultra 10-Year Notes Statistics | SPECULATORS | COMMERCIALS | SMALL TRADERS |
| – Percent of Open Interest Longs: | 19.1 | 72.0 | 8.0 |
| – Percent of Open Interest Shorts: | 13.6 | 64.5 | 21.0 |
| – Net Position: | 76,030 | 104,304 | -180,334 |
| – Gross Longs: | 265,790 | 1,003,270 | 111,865 |
| – Gross Shorts: | 189,760 | 898,966 | 292,199 |
| – Long to Short Ratio: | 1.4 to 1 | 1.1 to 1 | 0.4 to 1 |
| NET POSITION TREND: | |||
| – Strength Index Score (3 Year Range Pct): | 47.8 | 73.5 | 7.0 |
| – Strength Index Reading (3 Year Range): | Bearish | Bullish | Bearish-Extreme |
| NET POSITION MOVEMENT INDEX: | |||
| – 6-Week Change in Strength Index: | -9.9 | 14.0 | -7.4 |
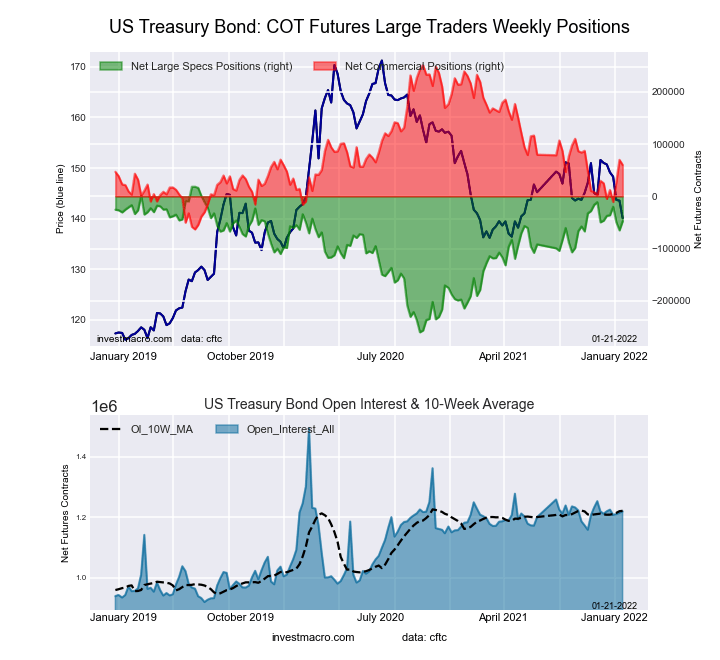
This week’s current strength score (the trader positioning range over the past three years, measured from 0 to 100) shows the speculators are currently Bullish with a score of 76.4 percent. The commercials are Bearish with a score of 39.3 percent and the small traders (not shown in chart) are Bearish with a score of 42.6 percent.
| US Treasury Bonds Statistics | SPECULATORS | COMMERCIALS | SMALL TRADERS |
| – Percent of Open Interest Longs: | 11.0 | 73.1 | 13.9 |
| – Percent of Open Interest Shorts: | 14.9 | 68.2 | 14.9 |
| – Net Position: | -47,496 | 60,037 | -12,541 |
| – Gross Longs: | 133,654 | 891,364 | 169,177 |
| – Gross Shorts: | 181,150 | 831,327 | 181,718 |
| – Long to Short Ratio: | 0.7 to 1 | 1.1 to 1 | 0.9 to 1 |
| NET POSITION TREND: | |||
| – Strength Index Score (3 Year Range Pct): | 76.4 | 39.3 | 42.6 |
| – Strength Index Reading (3 Year Range): | Bullish | Bearish | Bearish |
| NET POSITION MOVEMENT INDEX: | |||
| – 6-Week Change in Strength Index: | -0.4 | 11.2 | -27.0 |
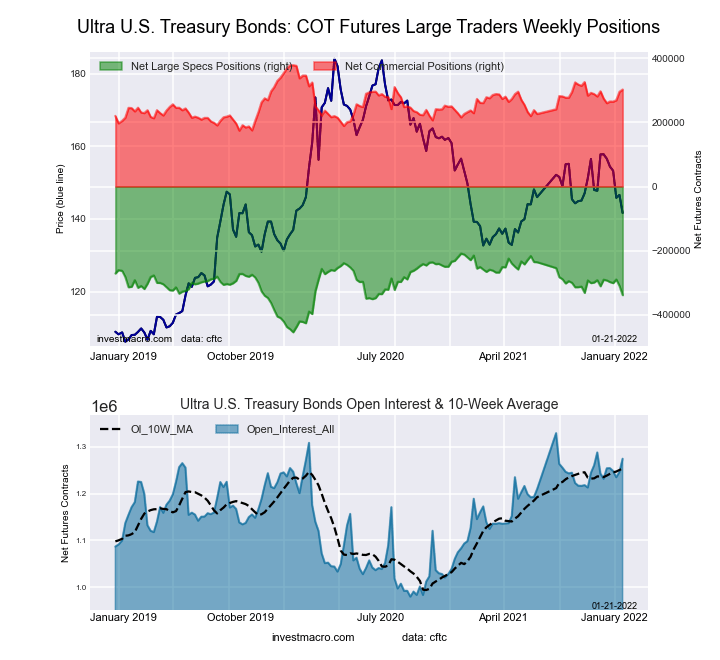
This week’s current strength score (the trader positioning range over the past three years, measured from 0 to 100) shows the speculators are currently Bearish with a score of 47.2 percent. The commercials are Bullish with a score of 62.8 percent and the small traders (not shown in chart) are Bullish with a score of 54.3 percent.
| Ultra US Treasury Bonds Statistics | SPECULATORS | COMMERCIALS | SMALL TRADERS |
| – Percent of Open Interest Longs: | 5.2 | 81.4 | 12.3 |
| – Percent of Open Interest Shorts: | 31.7 | 57.7 | 9.5 |
| – Net Position: | -338,350 | 302,042 | 36,308 |
| – Gross Longs: | 66,240 | 1,037,064 | 157,285 |
| – Gross Shorts: | 404,590 | 735,022 | 120,977 |
| – Long to Short Ratio: | 0.2 to 1 | 1.4 to 1 | 1.3 to 1 |
| NET POSITION TREND: | |||
| – Strength Index Score (3 Year Range Pct): | 47.2 | 62.8 | 54.3 |
| – Strength Index Reading (3 Year Range): | Bearish | Bullish | Bullish |
| NET POSITION MOVEMENT INDEX: | |||
| – 6-Week Change in Strength Index: | -19.6 | 13.7 | 14.4 |
Article By InvestMacro – Receive our weekly COT Reports by Email
*COT Report: The COT data, released weekly to the public each Friday, is updated through the most recent Tuesday (data is 3 days old) and shows a quick view of how large speculators or non-commercials (for-profit traders) were positioned in the futures markets.
The CFTC categorizes trader positions according to commercial hedgers (traders who use futures contracts for hedging as part of the business), non-commercials (large traders who speculate to realize trading profits) and nonreportable traders (usually small traders/speculators) as well as their open interest (contracts open in the market at time of reporting).See CFTC criteria here.
By JustMarkets The US stock indices ended Friday’s session in the red. By the end…
By Analytical Department RoboForex USD/JPY opens the week at 162.36 on Monday. The Japanese yen…
By InvestMacro Here are the latest charts and statistics for the Commitment of Traders (COT)…
By InvestMacro The latest update for the weekly Commitment of Traders (COT) report was released…
By InvestMacro Here are the latest charts and statistics for the Commitment of Traders (COT)…
By InvestMacro Here are the latest charts and statistics for the Commitment of Traders (COT)…
This website uses cookies.