COT Metals Speculators renewing Copper bullish bets after previous retreat

By InvestMacro | COT | Data Tables | COT Leaders | Downloads | COT Newsletter

Here are the latest charts and statistics for the Commitment of Traders (COT) data published by the Commodities Futures Trading Commission (CFTC).

The latest COT data is updated through Tuesday January 18th and shows a quick view of how large traders (for-profit speculators and commercial entities) were positioned in the futures markets.

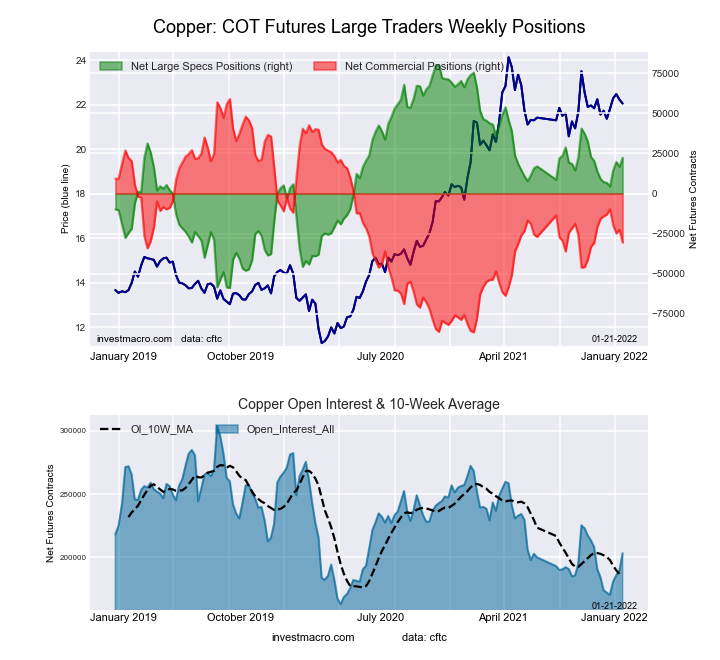
Highlighting the COT metals data is the recent turnaround in the Copper futures bets. Speculative positions in Copper rose this week for the third time in the past four weeks directly following a previous streak of nine weekly decreases in spec contracts. Those declines from October 26th to December 21st brought the Copper contracts to the lowest level in eighty-one weeks, dating back to June of 2020. Since December 21st, the Copper speculator positions have had a turnaround and risen by a total of 17,873 contracts. The overall Copper spec standing is currently back above the +20,000 contract level for the first time since November and sits at the highest net standing since November 9th.

Joining Copper (5,604 contracts) in falling this week were Silver (2,152 contracts) and Platinum (1,940 contracts) while the markets with lower speculator bets were Gold (-5,530 contracts) and Palladium (-331 contracts).


Data Snapshot of Commodity Market Traders | Columns Legend
Jan-18-2022OIOI-IndexSpec-NetSpec-IndexCom-NetCOM-IndexSmalls-NetSmalls-Index
WTI Crude2,059,56429385,78132-427,0525941,27173
Gold539,20430194,20750-221,0685026,86140
Silver148,7371529,70052-41,5405811,84012
Copper203,1982922,31058-30,538388,22873
Palladium9,37213-3,30933,40996-10039
Platinum57,321177,22913-12,911915,68241
Natural Gas1,169,18814-118,0474386,1745831,87360
Brent227,41361-20,2068417,211182,99550
Heating Oil367,6864214,82764-39,9352925,10885
Soybeans692,02220128,01562-92,19844-35,81712
Corn1,487,85819388,13880-342,68723-45,45117
Coffee264,3943263,78495-66,93773,15310
Sugar882,59813113,16860-127,0534413,88525
Wheat378,456234,840515,16046-10,00054


Gold Comex Futures:

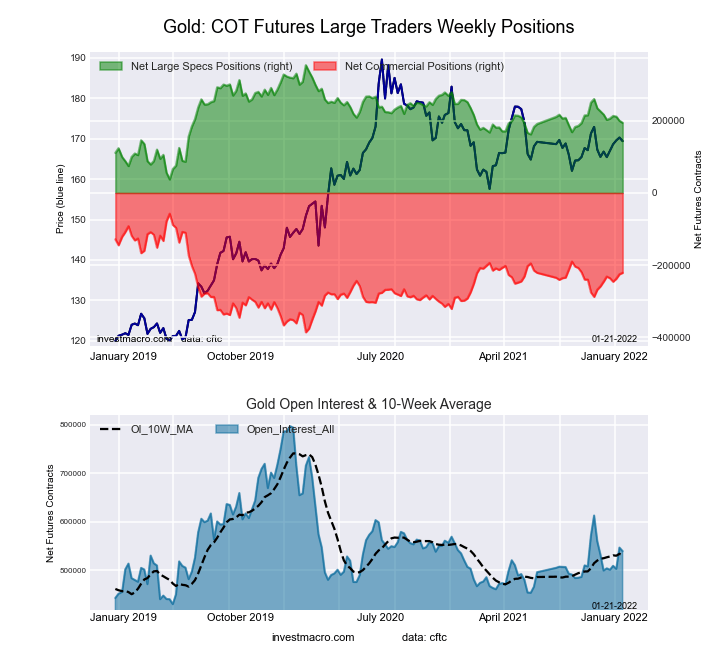
Gold Futures COT ChartThe Gold Comex Futures large speculator standing this week totaled a net position of 194,207 contracts in the data reported through Tuesday. This was a weekly reduction of -5,530 contracts from the previous week which had a total of 199,737 net contracts.

This week’s current strength score (the trader positioning range over the past three years, measured from 0 to 100) shows the speculators are currently Bearish with a score of 49.6 percent. The commercials are Bullish with a score of 50.1 percent and the small traders (not shown in chart) are Bearish with a score of 40.4 percent.

Gold Futures StatisticsSPECULATORSCOMMERCIALSSMALL TRADERS
– Percent of Open Interest Longs:53.924.68.7
– Percent of Open Interest Shorts:17.965.63.7
– Net Position:194,207-221,06826,861
– Gross Longs:290,528132,76446,978
– Gross Shorts:96,321353,83220,117
– Long to Short Ratio:3.0 to 10.4 to 12.3 to 1
NET POSITION TREND:
– Strength Index Score (3 Year Range Pct):49.650.140.4
– Strength Index Reading (3 Year Range):BearishBullishBearish
NET POSITION MOVEMENT INDEX:
– 6-Week Change in Strength Index:-7.37.5-4.5


Silver Comex Futures:

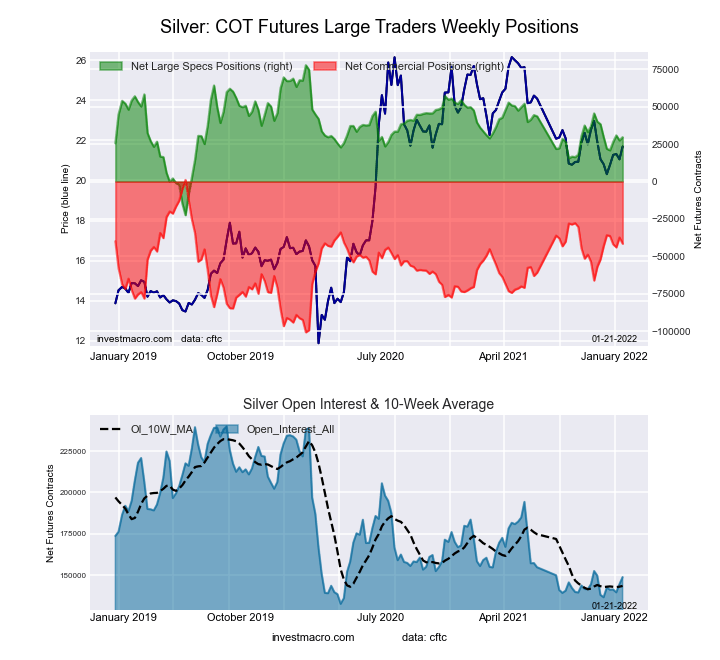
Silver Futures COT ChartThe Silver Comex Futures large speculator standing this week totaled a net position of 29,700 contracts in the data reported through Tuesday. This was a weekly gain of 2,152 contracts from the previous week which had a total of 27,548 net contracts.

This week’s current strength score (the trader positioning range over the past three years, measured from 0 to 100) shows the speculators are currently Bullish with a score of 52.0 percent. The commercials are Bullish with a score of 58.1 percent and the small traders (not shown in chart) are Bearish-Extreme with a score of 11.8 percent.

Silver Futures StatisticsSPECULATORSCOMMERCIALSSMALL TRADERS
– Percent of Open Interest Longs:44.433.816.6
– Percent of Open Interest Shorts:24.461.88.7
– Net Position:29,700-41,54011,840
– Gross Longs:65,98550,33124,763
– Gross Shorts:36,28591,87112,923
– Long to Short Ratio:1.8 to 10.5 to 11.9 to 1
NET POSITION TREND:
– Strength Index Score (3 Year Range Pct):52.058.111.8
– Strength Index Reading (3 Year Range):BullishBullishBearish-Extreme
NET POSITION MOVEMENT INDEX:
– 6-Week Change in Strength Index:-0.11.6-8.6


Copper Grade #1 Futures:

Copper Futures COT ChartThe Copper Grade #1 Futures large speculator standing this week totaled a net position of 22,310 contracts in the data reported through Tuesday. This was a weekly advance of 5,604 contracts from the previous week which had a total of 16,706 net contracts.

This week’s current strength score (the trader positioning range over the past three years, measured from 0 to 100) shows the speculators are currently Bullish with a score of 58.4 percent. The commercials are Bearish with a score of 38.5 percent and the small traders (not shown in chart) are Bullish with a score of 72.9 percent.

Copper Futures StatisticsSPECULATORSCOMMERCIALSSMALL TRADERS
– Percent of Open Interest Longs:38.239.19.3
– Percent of Open Interest Shorts:27.254.15.3
– Net Position:22,310-30,5388,228
– Gross Longs:77,67379,45518,943
– Gross Shorts:55,363109,99310,715
– Long to Short Ratio:1.4 to 10.7 to 11.8 to 1
NET POSITION TREND:
– Strength Index Score (3 Year Range Pct):58.438.572.9
– Strength Index Reading (3 Year Range):BullishBearishBullish
NET POSITION MOVEMENT INDEX:
– 6-Week Change in Strength Index:10.9-11.27.0


Platinum Futures:

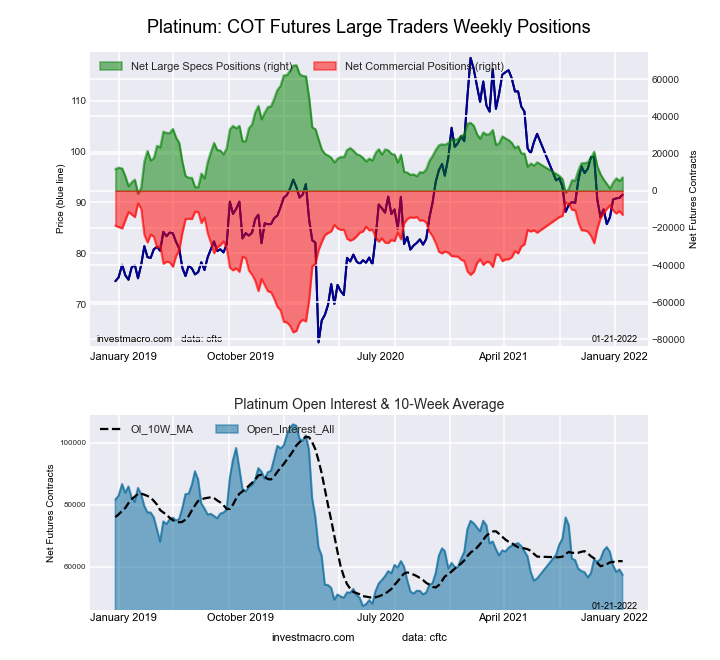
Platinum Futures COT ChartThe Platinum Futures large speculator standing this week totaled a net position of 7,229 contracts in the data reported through Tuesday. This was a weekly increase of 1,940 contracts from the previous week which had a total of 5,289 net contracts.

This week’s current strength score (the trader positioning range over the past three years, measured from 0 to 100) shows the speculators are currently Bearish-Extreme with a score of 12.8 percent. The commercials are Bullish-Extreme with a score of 90.6 percent and the small traders (not shown in chart) are Bearish with a score of 41.3 percent.

Platinum Futures StatisticsSPECULATORSCOMMERCIALSSMALL TRADERS
– Percent of Open Interest Longs:47.633.215.6
– Percent of Open Interest Shorts:35.055.75.7
– Net Position:7,229-12,9115,682
– Gross Longs:27,30419,0078,945
– Gross Shorts:20,07531,9183,263
– Long to Short Ratio:1.4 to 10.6 to 12.7 to 1
NET POSITION TREND:
– Strength Index Score (3 Year Range Pct):12.890.641.3
– Strength Index Reading (3 Year Range):Bearish-ExtremeBullish-ExtremeBearish
NET POSITION MOVEMENT INDEX:
– 6-Week Change in Strength Index:1.7-1.1-5.5


Palladium Futures:

Palladium Futures COT ChartThe Palladium Futures large speculator standing this week totaled a net position of -3,309 contracts in the data reported through Tuesday. This was a weekly decrease of -331 contracts from the previous week which had a total of -2,978 net contracts.

This week’s current strength score (the trader positioning range over the past three years, measured from 0 to 100) shows the speculators are currently Bearish-Extreme with a score of 2.5 percent. The commercials are Bullish-Extreme with a score of 96.2 percent and the small traders (not shown in chart) are Bearish with a score of 38.8 percent.

Palladium Futures StatisticsSPECULATORSCOMMERCIALSSMALL TRADERS
– Percent of Open Interest Longs:28.656.813.6
– Percent of Open Interest Shorts:63.920.414.7
– Net Position:-3,3093,409-100
– Gross Longs:2,6825,3231,275
– Gross Shorts:5,9911,9141,375
– Long to Short Ratio:0.4 to 12.8 to 10.9 to 1
NET POSITION TREND:
– Strength Index Score (3 Year Range Pct):2.596.238.8
– Strength Index Reading (3 Year Range):Bearish-ExtremeBullish-ExtremeBearish
NET POSITION MOVEMENT INDEX:
– 6-Week Change in Strength Index:-3.22.012.1


Article By InvestMacroReceive our weekly COT Reports by Email

*COT Report: The COT data, released weekly to the public each Friday, is updated through the most recent Tuesday (data is 3 days old) and shows a quick view of how large speculators or non-commercials (for-profit traders) were positioned in the futures markets.

The CFTC categorizes trader positions according to commercial hedgers (traders who use futures contracts for hedging as part of the business), non-commercials (large traders who speculate to realize trading profits) and nonreportable traders (usually small traders/speculators) as well as their open interest (contracts open in the market at time of reporting).See CFTC criteria here.

COT Energy Speculators boost WTI Crude Oil bullish bets for 2nd week as Oil price gains

By InvestMacro | COT | Data Tables | COT Leaders | Downloads | COT Newsletter

Here are the latest charts and statistics for the Commitment of Traders (COT) data published by the Commodities Futures Trading Commission (CFTC).

The latest COT data is updated through Tuesday January 18th and shows a quick view of how large traders (for-profit speculators and commercial entities) were positioned in the futures markets.

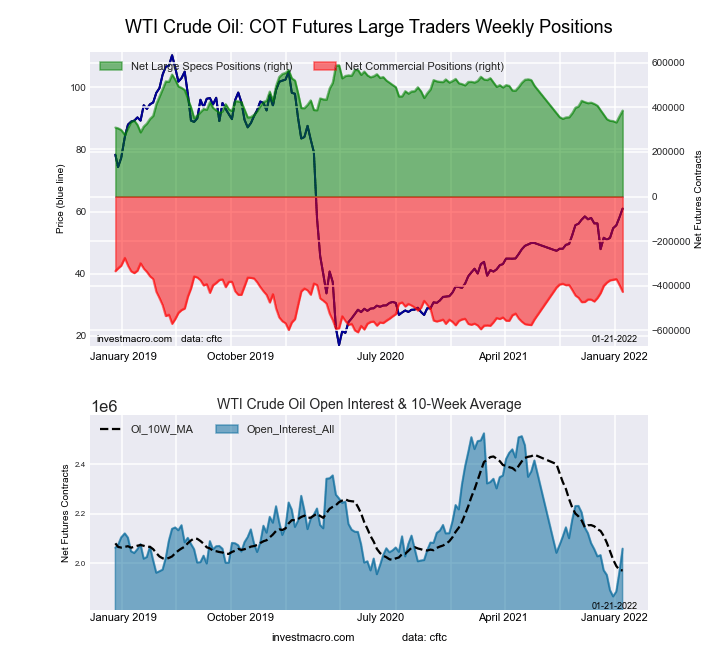
Highlighting the COT energy data is the renewed bullishness in the WTI Crude Oil futures bets over the past two weeks. The speculative net position in the WTI Crude Oil futures has jumped by over +25,000 contracts in each of the past two weeks (two-week total gain of +52,956 contracts) following eight straight weeks of declining speculator bets previously. This renewed push higher has brought the overall speculator bullish standing to its best level of the past seven weeks. The jump in WTI bets has coincided with a rise in the WTI Crude Oil prices that have reached their best levels since 2014 around the $87 per barrel threshold.

Joining WTI Crude Oil (25,276 contracts) in rising this week were Natural Gas (4,517 contracts), Gasoline (1,287 contracts) and the Bloomberg Commodity Index (5,328 contracts).

The energy markets with lower speculator bets this week were Brent Crude Oil (-3,515 contracts) and Heating Oil (-1,048 contracts).


Data Snapshot of Commodity Market Traders | Columns Legend
Jan-18-2022OIOI-IndexSpec-NetSpec-IndexCom-NetCOM-IndexSmalls-NetSmalls-Index
WTI Crude2,059,56429385,78132-427,0525941,27173
Gold539,20430194,20750-221,0685026,86140
Silver148,7371529,70052-41,5405811,84012
Copper203,1982922,31058-30,538388,22873
Palladium9,37213-3,30933,40996-10039
Platinum57,321177,22913-12,911915,68241
Natural Gas1,169,18814-118,0474386,1745831,87360
Brent227,41361-20,2068417,211182,99550
Heating Oil367,6864214,82764-39,9352925,10885
Soybeans692,02220128,01562-92,19844-35,81712
Corn1,487,85819388,13880-342,68723-45,45117
Coffee264,3943263,78495-66,93773,15310
Sugar882,59813113,16860-127,0534413,88525
Wheat378,456234,840515,16046-10,00054


WTI Crude Oil Futures:

WTI Crude Oil Futures COT ChartThe WTI Crude Oil Futures large speculator standing this week equaled a net position of 385,781 contracts in the data reported through Tuesday. This was a weekly advance of 25,276 contracts from the previous week which had a total of 360,505 net contracts.

This week’s current strength score (the trader positioning range over the past three years, measured from 0 to 100) shows the speculators are currently Bearish with a score of 32.4 percent. The commercials are Bullish with a score of 58.6 percent and the small traders (not shown in chart) are Bullish with a score of 73.2 percent.

WTI Crude Oil Futures StatisticsSPECULATORSCOMMERCIALSSMALL TRADERS
– Percent of Open Interest Longs:24.436.95.0
– Percent of Open Interest Shorts:5.757.63.0
– Net Position:385,781-427,05241,271
– Gross Longs:503,178759,825102,689
– Gross Shorts:117,3971,186,87761,418
– Long to Short Ratio:4.3 to 10.6 to 11.7 to 1
NET POSITION TREND:
– Strength Index Score (3 Year Range Pct):32.458.673.2
– Strength Index Reading (3 Year Range):BearishBullishBullish
NET POSITION MOVEMENT INDEX:
– 6-Week Change in Strength Index:6.2-8.611.4


Brent Crude Oil Futures:

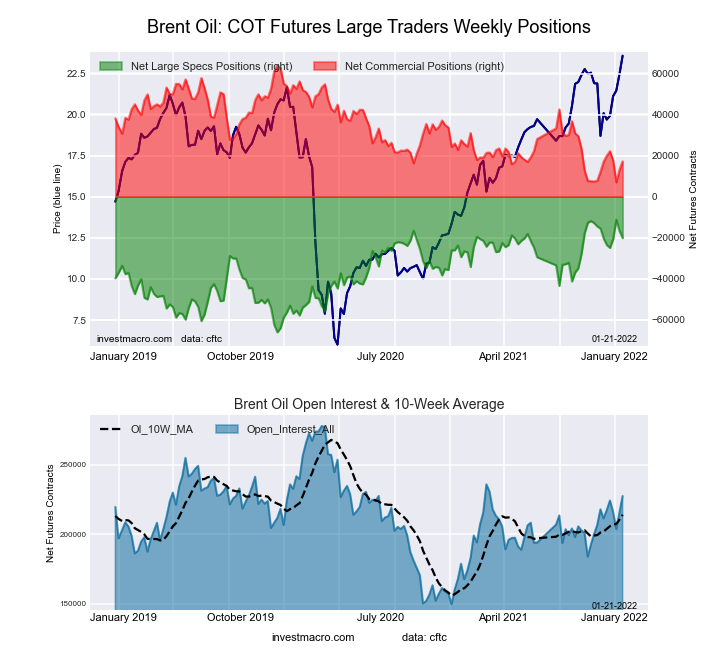
Brent Last Day Crude Oil Futures COT ChartThe Brent Crude Oil Futures large speculator standing this week equaled a net position of -20,206 contracts in the data reported through Tuesday. This was a weekly reduction of -3,515 contracts from the previous week which had a total of -16,691 net contracts.

This week’s current strength score (the trader positioning range over the past three years, measured from 0 to 100) shows the speculators are currently Bullish-Extreme with a score of 83.7 percent. The commercials are Bearish-Extreme with a score of 17.9 percent and the small traders (not shown in chart) are Bearish with a score of 49.7 percent.

Brent Crude Oil Futures StatisticsSPECULATORSCOMMERCIALSSMALL TRADERS
– Percent of Open Interest Longs:18.642.73.6
– Percent of Open Interest Shorts:27.535.22.3
– Net Position:-20,20617,2112,995
– Gross Longs:42,37997,2048,286
– Gross Shorts:62,58579,9935,291
– Long to Short Ratio:0.7 to 11.2 to 11.6 to 1
NET POSITION TREND:
– Strength Index Score (3 Year Range Pct):83.717.949.7
– Strength Index Reading (3 Year Range):Bullish-ExtremeBearish-ExtremeBearish
NET POSITION MOVEMENT INDEX:
– 6-Week Change in Strength Index:0.40.2-4.7


Natural Gas Futures:

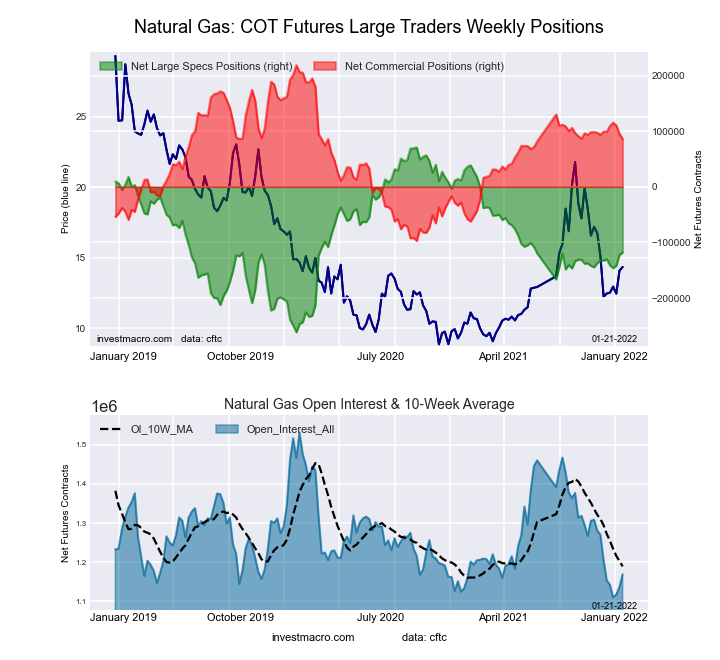
Natural Gas Futures COT ChartThe Natural Gas Futures large speculator standing this week equaled a net position of -118,047 contracts in the data reported through Tuesday. This was a weekly lift of 4,517 contracts from the previous week which had a total of -122,564 net contracts.

This week’s current strength score (the trader positioning range over the past three years, measured from 0 to 100) shows the speculators are currently Bearish with a score of 43.2 percent. The commercials are Bullish with a score of 58.0 percent and the small traders (not shown in chart) are Bullish with a score of 59.7 percent.

Natural Gas Futures StatisticsSPECULATORSCOMMERCIALSSMALL TRADERS
– Percent of Open Interest Longs:20.341.54.8
– Percent of Open Interest Shorts:30.434.22.1
– Net Position:-118,04786,17431,873
– Gross Longs:237,851485,72956,405
– Gross Shorts:355,898399,55524,532
– Long to Short Ratio:0.7 to 11.2 to 12.3 to 1
NET POSITION TREND:
– Strength Index Score (3 Year Range Pct):43.258.059.7
– Strength Index Reading (3 Year Range):BearishBullishBullish
NET POSITION MOVEMENT INDEX:
– 6-Week Change in Strength Index:4.3-4.2-3.0


Gasoline Blendstock Futures:

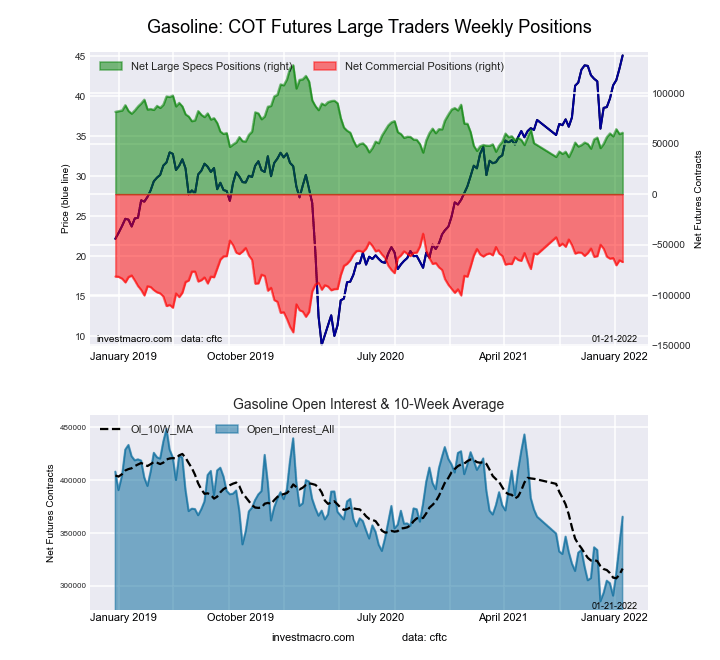
RBOB Gasoline Energy Futures COT ChartThe Gasoline Blendstock Futures large speculator standing this week equaled a net position of 60,789 contracts in the data reported through Tuesday. This was a weekly gain of 1,287 contracts from the previous week which had a total of 59,502 net contracts.

This week’s current strength score (the trader positioning range over the past three years, measured from 0 to 100) shows the speculators are currently Bearish with a score of 32.0 percent. The commercials are Bullish with a score of 69.7 percent and the small traders (not shown in chart) are Bullish with a score of 50.2 percent.

Nasdaq Mini Futures StatisticsSPECULATORSCOMMERCIALSSMALL TRADERS
– Percent of Open Interest Longs:29.049.06.2
– Percent of Open Interest Shorts:12.467.44.5
– Net Position:60,789-67,2656,476
– Gross Longs:105,959179,28722,808
– Gross Shorts:45,170246,55216,332
– Long to Short Ratio:2.3 to 10.7 to 11.4 to 1
NET POSITION TREND:
– Strength Index Score (3 Year Range Pct):32.069.750.2
– Strength Index Reading (3 Year Range):BearishBullishBullish
NET POSITION MOVEMENT INDEX:
– 6-Week Change in Strength Index:11.1-13.213.6


#2 Heating Oil NY-Harbor Futures:

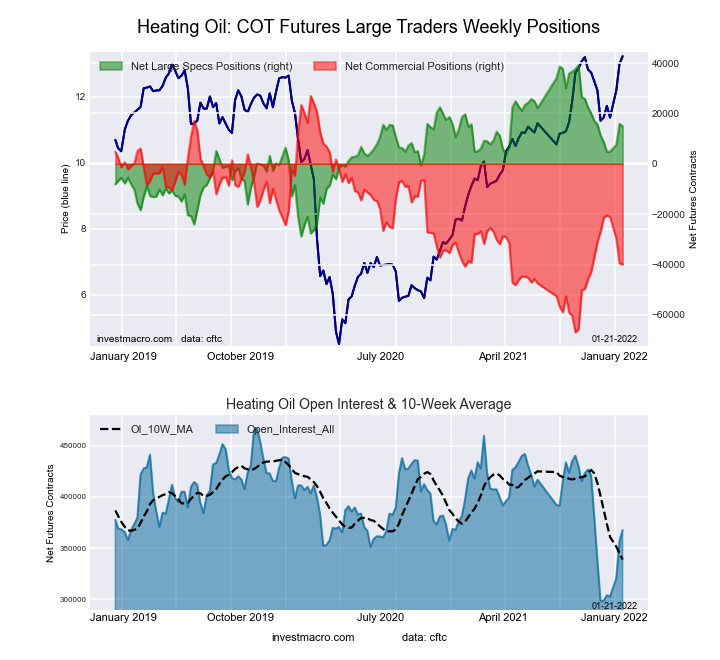
NY Harbor Heating Oil Energy Futures COT ChartThe #2 Heating Oil NY-Harbor Futures large speculator standing this week equaled a net position of 14,827 contracts in the data reported through Tuesday. This was a weekly lowering of -1,048 contracts from the previous week which had a total of 15,875 net contracts.

This week’s current strength score (the trader positioning range over the past three years, measured from 0 to 100) shows the speculators are currently Bullish with a score of 64.2 percent. The commercials are Bearish with a score of 28.7 percent and the small traders (not shown in chart) are Bullish-Extreme with a score of 85.3 percent.

Heating Oil Futures StatisticsSPECULATORSCOMMERCIALSSMALL TRADERS
– Percent of Open Interest Longs:16.350.513.9
– Percent of Open Interest Shorts:12.261.47.1
– Net Position:14,827-39,93525,108
– Gross Longs:59,763185,76451,279
– Gross Shorts:44,936225,69926,171
– Long to Short Ratio:1.3 to 10.8 to 12.0 to 1
NET POSITION TREND:
– Strength Index Score (3 Year Range Pct):64.228.785.3
– Strength Index Reading (3 Year Range):BullishBearishBullish-Extreme
NET POSITION MOVEMENT INDEX:
– 6-Week Change in Strength Index:9.2-19.842.8


Bloomberg Commodity Index Futures:

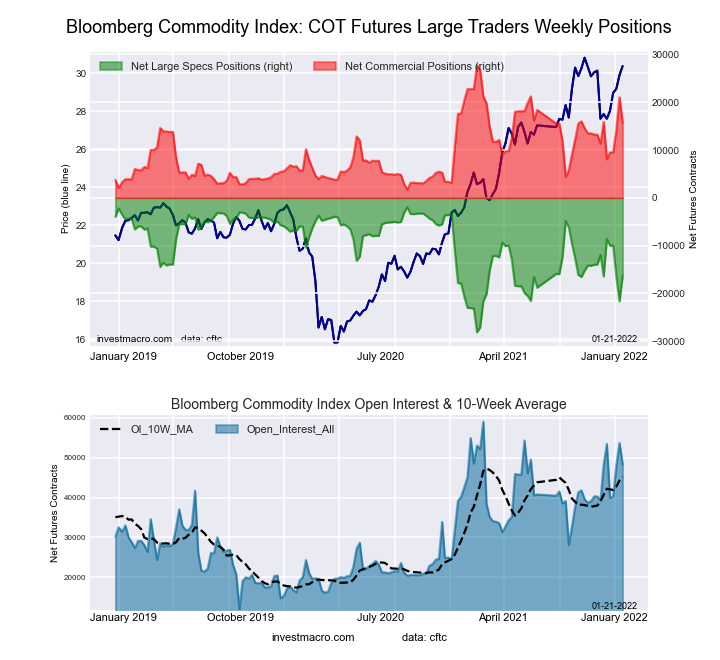
Bloomberg Commodity Index Futures COT ChartThe Bloomberg Commodity Index Futures large speculator standing this week equaled a net position of -16,277 contracts in the data reported through Tuesday. This was a weekly boost of 5,328 contracts from the previous week which had a total of -21,605 net contracts.

This week’s current strength score (the trader positioning range over the past three years, measured from 0 to 100) shows the speculators are currently Bearish with a score of 45.2 percent. The commercials are Bullish with a score of 53.7 percent and the small traders (not shown in chart) are Bearish with a score of 39.7 percent.

Bloomberg Index Futures StatisticsSPECULATORSCOMMERCIALSSMALL TRADERS
– Percent of Open Interest Longs:62.633.81.2
– Percent of Open Interest Shorts:96.31.20.1
– Net Position:-16,27715,708569
– Gross Longs:30,23216,308595
– Gross Shorts:46,50960026
– Long to Short Ratio:0.7 to 127.2 to 122.9 to 1
NET POSITION TREND:
– Strength Index Score (3 Year Range Pct):45.253.739.7
– Strength Index Reading (3 Year Range):BearishBullishBearish
NET POSITION MOVEMENT INDEX:
– 6-Week Change in Strength Index:0.6-0.60.5


Article By InvestMacroReceive our weekly COT Reports by Email

*COT Report: The COT data, released weekly to the public each Friday, is updated through the most recent Tuesday (data is 3 days old) and shows a quick view of how large speculators or non-commercials (for-profit traders) were positioned in the futures markets.

The CFTC categorizes trader positions according to commercial hedgers (traders who use futures contracts for hedging as part of the business), non-commercials (large traders who speculate to realize trading profits) and nonreportable traders (usually small traders/speculators) as well as their open interest (contracts open in the market at time of reporting).See CFTC criteria here.
COT Soft Commodities Speculators drop Corn bullish bets for 3rd week to 10-week low

By InvestMacro | COT | Data Tables | COT Leaders | Downloads | COT Newsletter

Here are the latest charts and statistics for the Commitment of Traders (COT) data published by the Commodities Futures Trading Commission (CFTC).

The latest COT data is updated through Tuesday January 18th 2022 and shows a quick view of how large traders (for-profit speculators and commercial entities) were positioned in the futures markets.

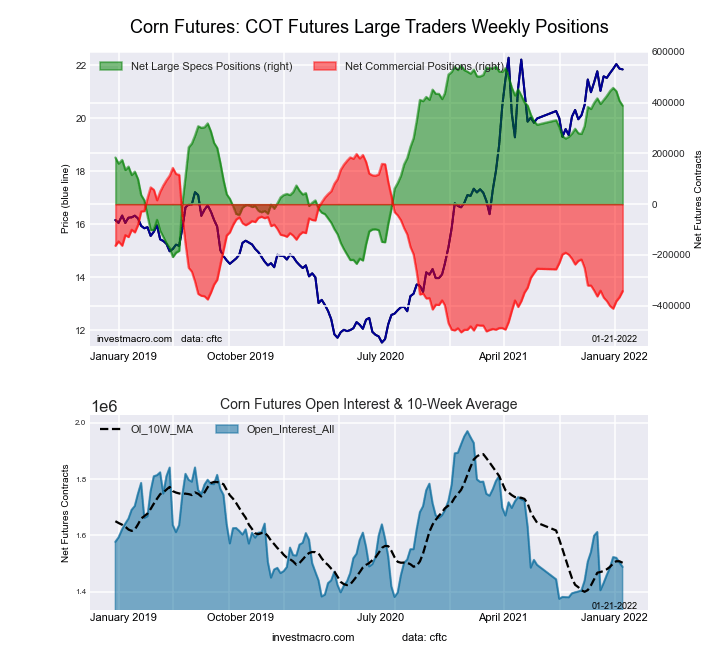
Highlighting the COT soft commodities data is the recent declines in Corn futures bets. The speculative net position in the Corn futures has fallen for three straight weeks with a total drop by -70,038 contracts over that time-frame. This has brought the current net standing to the lowest level of the past ten weeks and under the +400,000 net contract level for the first time since November 30th. The Corn strength score (current speculator standing compared to past three years where above 80 is bullish extreme & below 20 is bearish extreme) also dipped and fell below the extreme bullish line of 80 percent this week (also first time in 10 weeks) to sit currently at 79.6 percent.

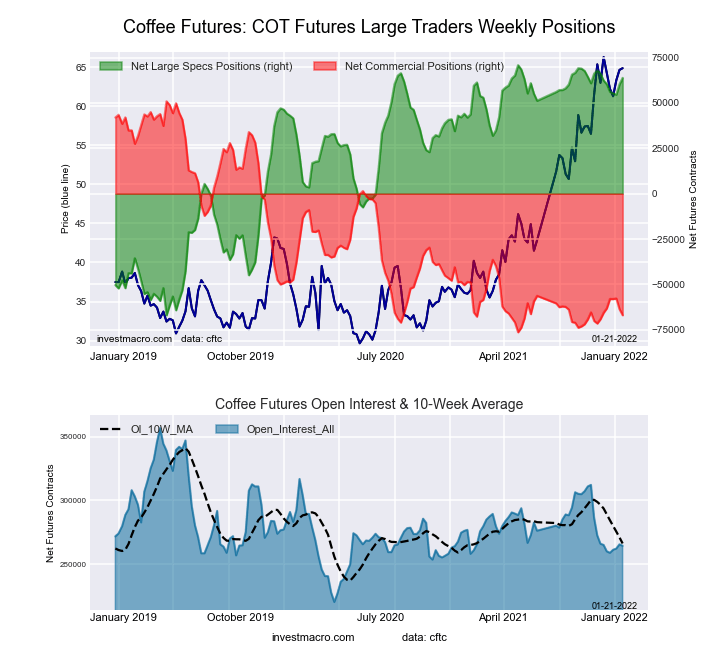
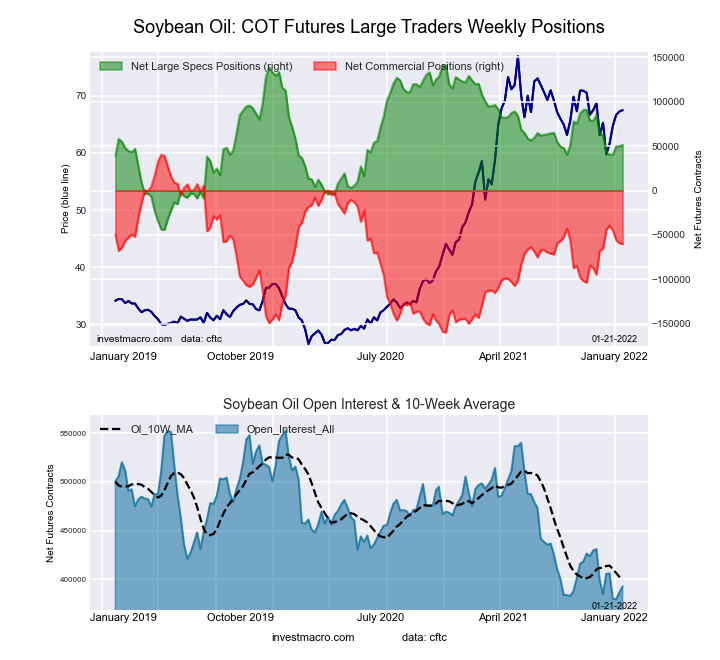
The soft commodities that saw higher speculator bets this week were Coffee (3,616 contracts), Soybean Oil (1,586 contracts), Live Cattle (1,742 contracts), Cotton (1,304 contracts), Cocoa (13,281 contracts), and Wheat (6,306 contracts).

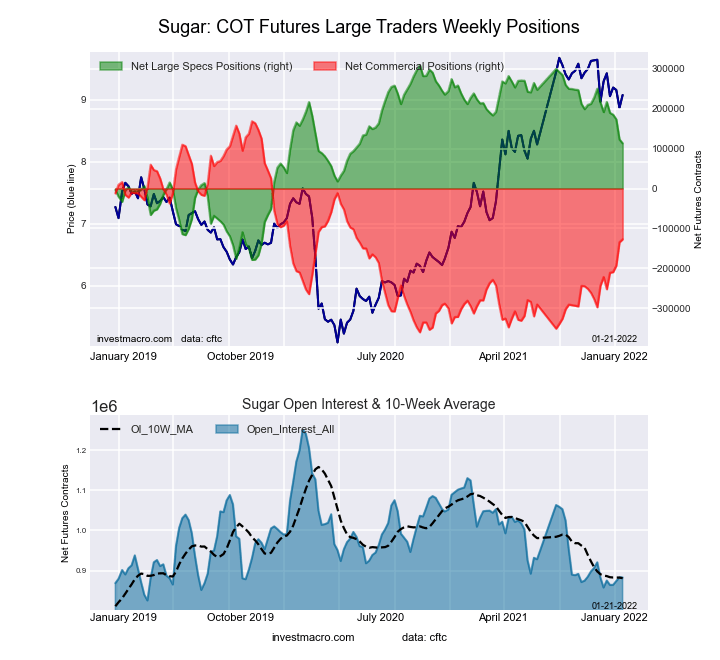
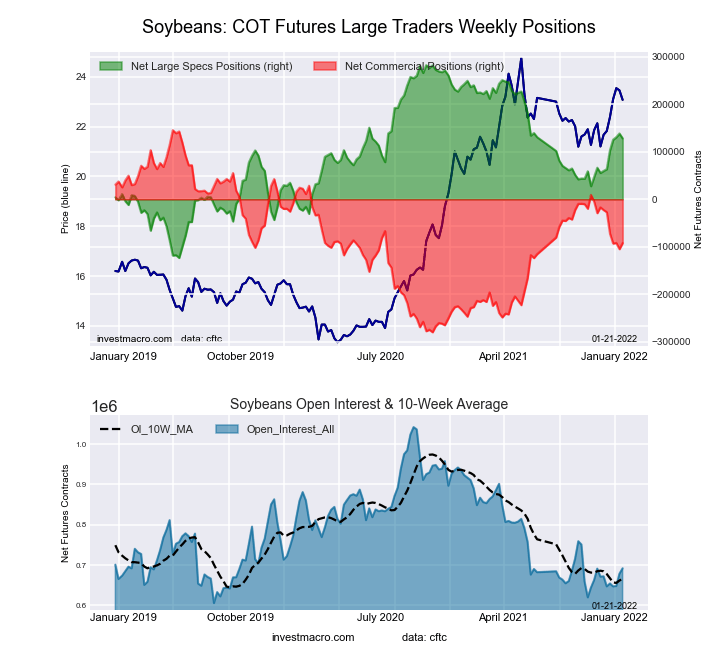
Markets with lower speculator bets this week were Corn (-19,354 contracts), Sugar (-9,757 contracts), Lean Hogs (-2,349 contracts), Soybean Meal (-16,281 contracts) and Soybeans (-10,257 contracts).


Data Snapshot of Commodity Market Traders | Columns Legend
Jan-18-2022OIOI-IndexSpec-NetSpec-IndexCom-NetCOM-IndexSmalls-NetSmalls-Index
WTI Crude2,059,56429385,78132-427,0525941,27173
Gold539,20430194,20750-221,0685026,86140
Silver148,7371529,70052-41,5405811,84012
Copper203,1982922,31058-30,538388,22873
Palladium9,37213-3,30933,40996-10039
Platinum57,321177,22913-12,911915,68241
Natural Gas1,169,18814-118,0474386,1745831,87360
Brent227,41361-20,2068417,211182,99550
Heating Oil367,6864214,82764-39,9352925,10885
Soybeans692,02220128,01562-92,19844-35,81712
Corn1,487,85819388,13880-342,68723-45,45117
Coffee264,3943263,78495-66,93773,15310
Sugar882,59813113,16860-127,0534413,88525
Wheat378,456234,840515,16046-10,00054


CORN Futures:

CORN Futures COT ChartThe CORN large speculator standing this week equaled a net position of 388,138 contracts in the data reported through Tuesday. This was a weekly decline of -19,354 contracts from the previous week which had a total of 407,492 net contracts.

This week’s current strength score (the trader positioning range over the past three years, measured from 0 to 100) shows the speculators are currently Bullish with a score of 79.6 percent. The commercials are Bearish with a score of 23.1 percent and the small traders (not shown in chart) are Bearish-Extreme with a score of 16.9 percent.

CORN Futures StatisticsSPECULATORSCOMMERCIALSSMALL TRADERS
– Percent of Open Interest Longs:32.046.39.3
– Percent of Open Interest Shorts:5.969.312.4
– Net Position:388,138-342,687-45,451
– Gross Longs:476,449688,600138,491
– Gross Shorts:88,3111,031,287183,942
– Long to Short Ratio:5.4 to 10.7 to 10.8 to 1
NET POSITION TREND:
– Strength Index Score (3 Year Range Pct):79.623.116.9
– Strength Index Reading (3 Year Range):BullishBearishBearish-Extreme
NET POSITION MOVEMENT INDEX:
– 6-Week Change in Strength Index:-2.93.6-1.4


SUGAR Futures:

SUGAR Futures COT ChartThe SUGAR large speculator standing this week equaled a net position of 113,168 contracts in the data reported through Tuesday. This was a weekly decrease of -9,757 contracts from the previous week which had a total of 122,925 net contracts.

This week’s current strength score (the trader positioning range over the past three years, measured from 0 to 100) shows the speculators are currently Bullish with a score of 59.9 percent. The commercials are Bearish with a score of 44.1 percent and the small traders (not shown in chart) are Bearish with a score of 25.0 percent.

SUGAR Futures StatisticsSPECULATORSCOMMERCIALSSMALL TRADERS
– Percent of Open Interest Longs:21.854.48.5
– Percent of Open Interest Shorts:9.068.86.9
– Net Position:113,168-127,05313,885
– Gross Longs:192,577480,30274,979
– Gross Shorts:79,409607,35561,094
– Long to Short Ratio:2.4 to 10.8 to 11.2 to 1
NET POSITION TREND:
– Strength Index Score (3 Year Range Pct):59.944.125.0
– Strength Index Reading (3 Year Range):BullishBearishBearish
NET POSITION MOVEMENT INDEX:
– 6-Week Change in Strength Index:-16.017.9-20.0


COFFEE Futures:

COFFEE Futures COT ChartThe COFFEE large speculator standing this week equaled a net position of 63,784 contracts in the data reported through Tuesday. This was a weekly increase of 3,616 contracts from the previous week which had a total of 60,168 net contracts.

This week’s current strength score (the trader positioning range over the past three years, measured from 0 to 100) shows the speculators are currently Bullish-Extreme with a score of 94.9 percent. The commercials are Bearish-Extreme with a score of 7.4 percent and the small traders (not shown in chart) are Bearish-Extreme with a score of 10.1 percent.

COFFEE Futures StatisticsSPECULATORSCOMMERCIALSSMALL TRADERS
– Percent of Open Interest Longs:28.742.63.9
– Percent of Open Interest Shorts:4.668.02.8
– Net Position:63,784-66,9373,153
– Gross Longs:75,931112,76110,428
– Gross Shorts:12,147179,6987,275
– Long to Short Ratio:6.3 to 10.6 to 11.4 to 1
NET POSITION TREND:
– Strength Index Score (3 Year Range Pct):94.97.410.1
– Strength Index Reading (3 Year Range):Bullish-ExtremeBearish-ExtremeBearish-Extreme
NET POSITION MOVEMENT INDEX:
– 6-Week Change in Strength Index:1.0-1.1-0.7


SOYBEANS Futures:

SOYBEANS Futures COT ChartThe SOYBEANS large speculator standing this week equaled a net position of 128,015 contracts in the data reported through Tuesday. This was a weekly decline of -10,257 contracts from the previous week which had a total of 138,272 net contracts.

This week’s current strength score (the trader positioning range over the past three years, measured from 0 to 100) shows the speculators are currently Bullish with a score of 62.0 percent. The commercials are Bearish with a score of 44.1 percent and the small traders (not shown in chart) are Bearish-Extreme with a score of 12.2 percent.

SOYBEANS Futures StatisticsSPECULATORSCOMMERCIALSSMALL TRADERS
– Percent of Open Interest Longs:26.052.56.8
– Percent of Open Interest Shorts:7.565.911.9
– Net Position:128,015-92,198-35,817
– Gross Longs:179,661363,53646,718
– Gross Shorts:51,646455,73482,535
– Long to Short Ratio:3.5 to 10.8 to 10.6 to 1
NET POSITION TREND:
– Strength Index Score (3 Year Range Pct):62.044.112.2
– Strength Index Reading (3 Year Range):BullishBearishBearish-Extreme
NET POSITION MOVEMENT INDEX:
– 6-Week Change in Strength Index:16.9-16.31.8


SOYBEAN OIL Futures:

SOYBEAN OIL Futures COT ChartThe SOYBEAN OIL large speculator standing this week equaled a net position of 51,503 contracts in the data reported through Tuesday. This was a weekly gain of 1,586 contracts from the previous week which had a total of 49,917 net contracts.

This week’s current strength score (the trader positioning range over the past three years, measured from 0 to 100) shows the speculators are currently Bullish with a score of 51.6 percent. The commercials are Bearish with a score of 49.7 percent and the small traders (not shown in chart) are Bearish with a score of 45.5 percent.

SOYBEAN OIL Futures StatisticsSPECULATORSCOMMERCIALSSMALL TRADERS
– Percent of Open Interest Longs:24.550.78.3
– Percent of Open Interest Shorts:11.466.06.1
– Net Position:51,503-60,1008,597
– Gross Longs:96,428199,01932,509
– Gross Shorts:44,925259,11923,912
– Long to Short Ratio:2.1 to 10.8 to 11.4 to 1
NET POSITION TREND:
– Strength Index Score (3 Year Range Pct):51.649.745.5
– Strength Index Reading (3 Year Range):BullishBearishBearish
NET POSITION MOVEMENT INDEX:
– 6-Week Change in Strength Index:-5.92.720.7


SOYBEAN MEAL Futures:

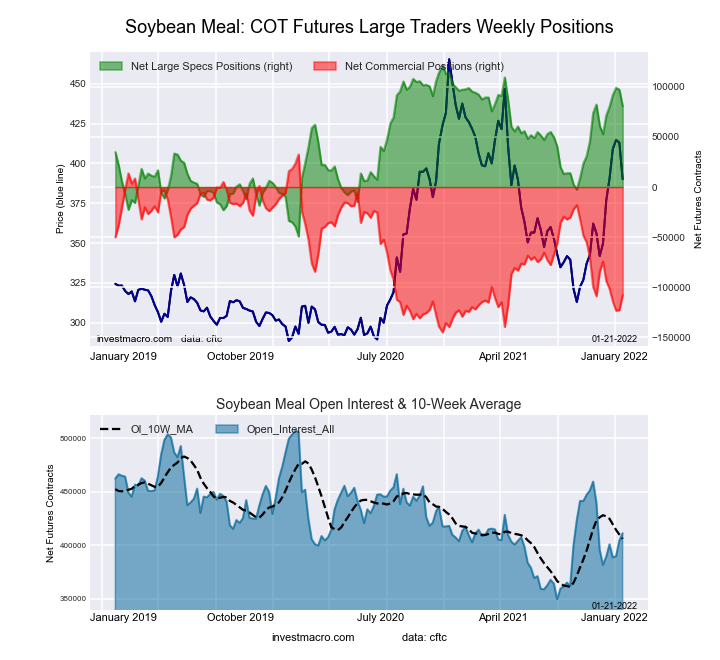
SOYBEAN MEAL Futures COT ChartThe SOYBEAN MEAL large speculator standing this week equaled a net position of 80,893 contracts in the data reported through Tuesday. This was a weekly lowering of -16,281 contracts from the previous week which had a total of 97,174 net contracts.

This week’s current strength score (the trader positioning range over the past three years, measured from 0 to 100) shows the speculators are currently Bullish with a score of 76.2 percent. The commercials are Bearish with a score of 20.9 percent and the small traders (not shown in chart) are Bullish with a score of 79.2 percent.

SOYBEAN MEAL Futures StatisticsSPECULATORSCOMMERCIALSSMALL TRADERS
– Percent of Open Interest Longs:26.646.712.5
– Percent of Open Interest Shorts:6.972.96.0
– Net Position:80,893-107,97327,080
– Gross Longs:109,188191,87851,582
– Gross Shorts:28,295299,85124,502
– Long to Short Ratio:3.9 to 10.6 to 12.1 to 1
NET POSITION TREND:
– Strength Index Score (3 Year Range Pct):76.220.979.2
– Strength Index Reading (3 Year Range):BullishBearishBullish
NET POSITION MOVEMENT INDEX:
– 6-Week Change in Strength Index:16.5-18.921.6


LIVE CATTLE Futures:

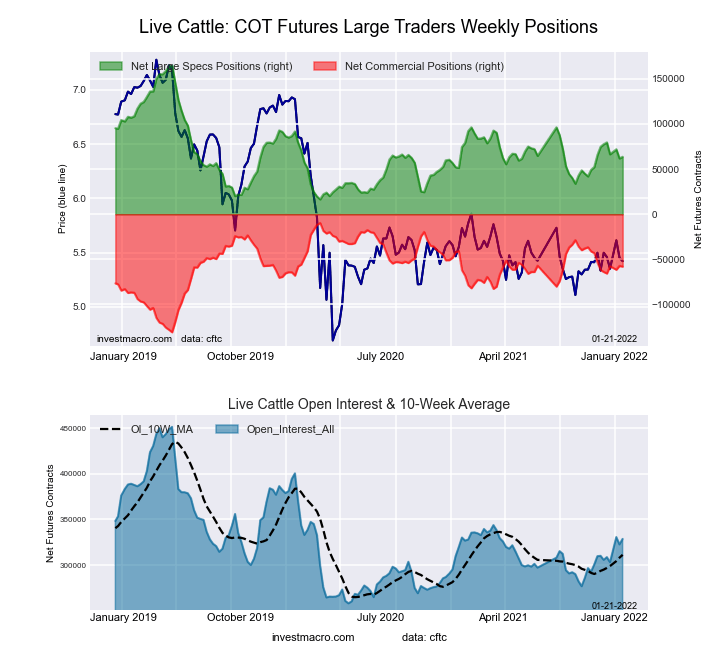
LIVE CATTLE Futures COT ChartThe LIVE CATTLE large speculator standing this week equaled a net position of 63,562 contracts in the data reported through Tuesday. This was a weekly rise of 1,742 contracts from the previous week which had a total of 61,820 net contracts.

This week’s current strength score (the trader positioning range over the past three years, measured from 0 to 100) shows the speculators are currently Bearish with a score of 31.7 percent. The commercials are Bullish with a score of 60.1 percent and the small traders (not shown in chart) are Bullish with a score of 73.8 percent.

LIVE CATTLE Futures StatisticsSPECULATORSCOMMERCIALSSMALL TRADERS
– Percent of Open Interest Longs:33.938.510.8
– Percent of Open Interest Shorts:14.656.212.4
– Net Position:63,562-58,078-5,484
– Gross Longs:111,509126,60835,421
– Gross Shorts:47,947184,68640,905
– Long to Short Ratio:2.3 to 10.7 to 10.9 to 1
NET POSITION TREND:
– Strength Index Score (3 Year Range Pct):31.760.173.8
– Strength Index Reading (3 Year Range):BearishBullishBullish
NET POSITION MOVEMENT INDEX:
– 6-Week Change in Strength Index:-9.44.919.6


LEAN HOGS Futures:

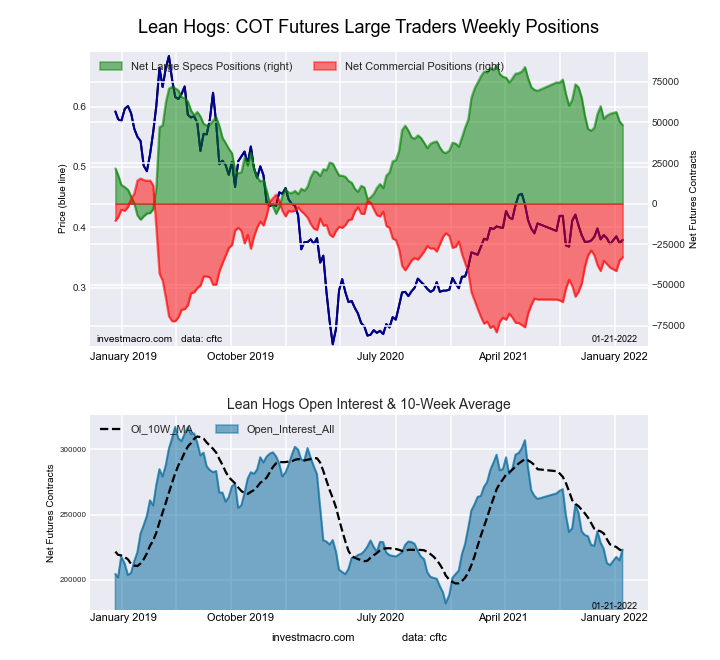
LEAN HOGS Futures COT ChartThe LEAN HOGS large speculator standing this week equaled a net position of 48,305 contracts in the data reported through Tuesday. This was a weekly lowering of -2,349 contracts from the previous week which had a total of 50,654 net contracts.

This week’s current strength score (the trader positioning range over the past three years, measured from 0 to 100) shows the speculators are currently Bullish with a score of 60.9 percent. The commercials are Bearish with a score of 48.9 percent and the small traders (not shown in chart) are Bearish-Extreme with a score of 13.6 percent.

LEAN HOGS Futures StatisticsSPECULATORSCOMMERCIALSSMALL TRADERS
– Percent of Open Interest Longs:36.337.67.6
– Percent of Open Interest Shorts:14.752.314.5
– Net Position:48,305-32,883-15,422
– Gross Longs:81,05483,99316,970
– Gross Shorts:32,749116,87632,392
– Long to Short Ratio:2.5 to 10.7 to 10.5 to 1
NET POSITION TREND:
– Strength Index Score (3 Year Range Pct):60.948.913.6
– Strength Index Reading (3 Year Range):BullishBearishBearish-Extreme
NET POSITION MOVEMENT INDEX:
– 6-Week Change in Strength Index:-4.22.37.6


COTTON Futures:

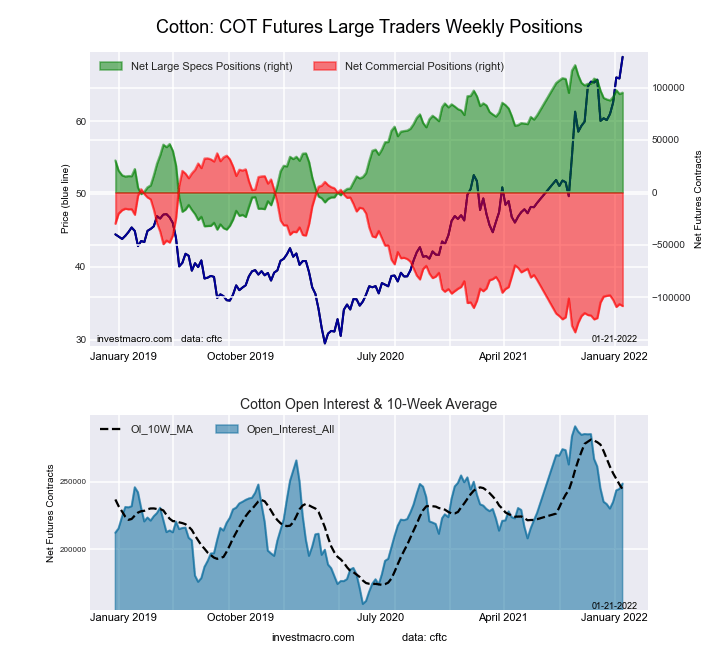
COTTON Futures COT ChartThe COTTON large speculator standing this week equaled a net position of 95,126 contracts in the data reported through Tuesday. This was a weekly advance of 1,304 contracts from the previous week which had a total of 93,822 net contracts.

This week’s current strength score (the trader positioning range over the past three years, measured from 0 to 100) shows the speculators are currently Bullish-Extreme with a score of 83.3 percent. The commercials are Bearish-Extreme with a score of 14.7 percent and the small traders (not shown in chart) are Bullish-Extreme with a score of 95.5 percent.

COTTON Futures StatisticsSPECULATORSCOMMERCIALSSMALL TRADERS
– Percent of Open Interest Longs:43.734.08.5
– Percent of Open Interest Shorts:5.477.63.2
– Net Position:95,126-108,26013,134
– Gross Longs:108,44684,47021,002
– Gross Shorts:13,320192,7307,868
– Long to Short Ratio:8.1 to 10.4 to 12.7 to 1
NET POSITION TREND:
– Strength Index Score (3 Year Range Pct):83.314.795.5
– Strength Index Reading (3 Year Range):Bullish-ExtremeBearish-ExtremeBullish-Extreme
NET POSITION MOVEMENT INDEX:
– 6-Week Change in Strength Index:3.3-5.324.0


COCOA Futures:

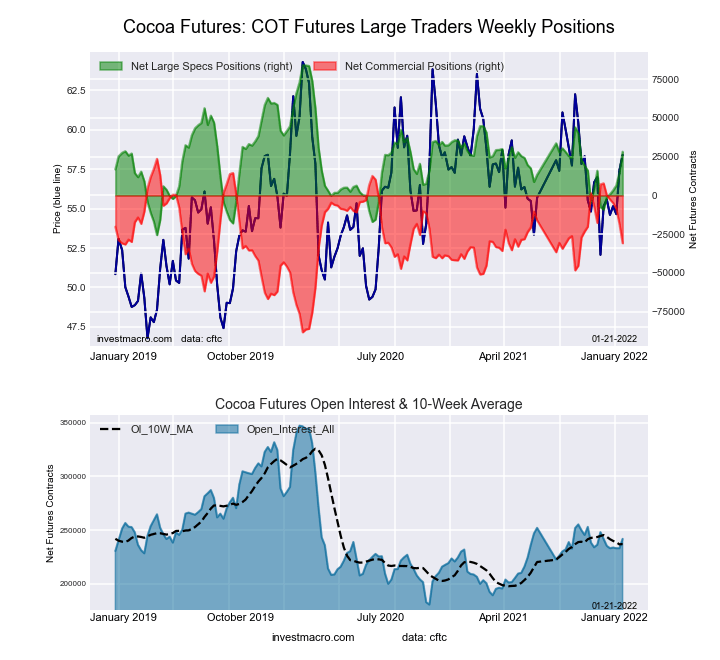
COCOA Futures COT ChartThe COCOA large speculator standing this week equaled a net position of 28,214 contracts in the data reported through Tuesday. This was a weekly rise of 13,281 contracts from the previous week which had a total of 14,933 net contracts.

This week’s current strength score (the trader positioning range over the past three years, measured from 0 to 100) shows the speculators are currently Bearish with a score of 49.1 percent. The commercials are Bullish with a score of 51.4 percent and the small traders (not shown in chart) are Bearish with a score of 38.1 percent.

COCOA Futures StatisticsSPECULATORSCOMMERCIALSSMALL TRADERS
– Percent of Open Interest Longs:26.348.15.0
– Percent of Open Interest Shorts:14.660.93.9
– Net Position:28,214-30,8212,607
– Gross Longs:63,470116,40212,024
– Gross Shorts:35,256147,2239,417
– Long to Short Ratio:1.8 to 10.8 to 11.3 to 1
NET POSITION TREND:
– Strength Index Score (3 Year Range Pct):49.151.438.1
– Strength Index Reading (3 Year Range):BearishBullishBearish
NET POSITION MOVEMENT INDEX:
– 6-Week Change in Strength Index:34.0-34.514.9


WHEAT Futures:

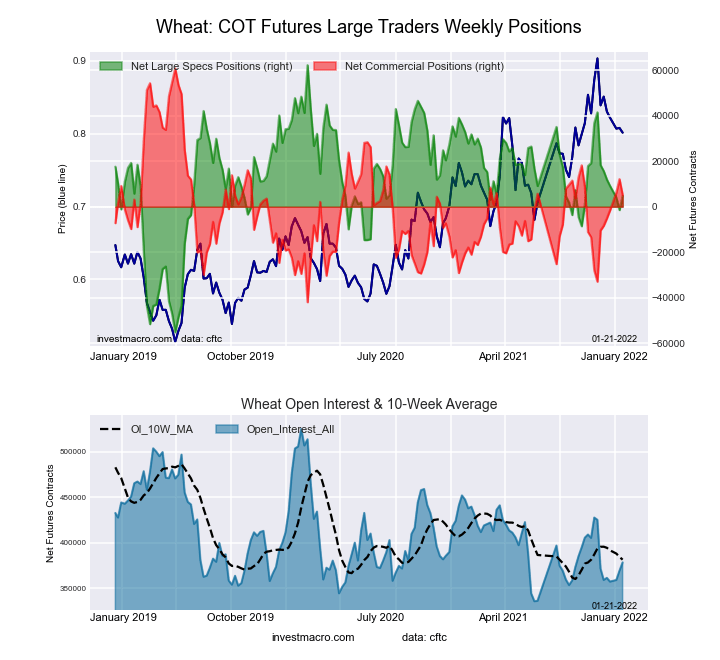
WHEAT Futures COT ChartThe WHEAT large speculator standing this week equaled a net position of 4,840 contracts in the data reported through Tuesday. This was a weekly advance of 6,306 contracts from the previous week which had a total of -1,466 net contracts.

This week’s current strength score (the trader positioning range over the past three years, measured from 0 to 100) shows the speculators are currently Bullish with a score of 51.1 percent. The commercials are Bearish with a score of 45.9 percent and the small traders (not shown in chart) are Bullish with a score of 53.8 percent.

WHEAT Futures StatisticsSPECULATORSCOMMERCIALSSMALL TRADERS
– Percent of Open Interest Longs:28.241.08.0
– Percent of Open Interest Shorts:26.939.610.7
– Net Position:4,8405,160-10,000
– Gross Longs:106,763155,14430,339
– Gross Shorts:101,923149,98440,339
– Long to Short Ratio:1.0 to 11.0 to 10.8 to 1
NET POSITION TREND:
– Strength Index Score (3 Year Range Pct):51.145.953.8
– Strength Index Reading (3 Year Range):BullishBearishBullish
NET POSITION MOVEMENT INDEX:
– 6-Week Change in Strength Index:-9.213.2-13.0


Article By InvestMacroReceive our weekly COT Reports by Email

*COT Report: The COT data, released weekly to the public each Friday, is updated through the most recent Tuesday (data is 3 days old) and shows a quick view of how large speculators or non-commercials (for-profit traders) were positioned in the futures markets.

The CFTC categorizes trader positions according to commercial hedgers (traders who use futures contracts for hedging as part of the business), non-commercials (large traders who speculate to realize trading profits) and nonreportable traders (usually small traders/speculators) as well as their open interest (contracts open in the market at time of reporting).See CFTC criteria here.
What is bioengineered food? An agriculture expert explains

By Kathleen Merrigan, Arizona State University

The U.S. Department of Agriculture defines bioengineered food as food that “contains detectable genetic material that has been modified through certain lab techniques that cannot be created through conventional breeding or found in nature.”

If that definition sounds familiar, it is because it is essentially how genetically modified organisms, or GMOs, are defined – common vocabulary many people use and understand.

Green seal with plant graphic and 'BIOENGINEERED' text.
As of Jan. 1, 2022, foods that are genetically modified must carry this label.
USDA

On Jan. 1, 2022, the USDA implemented a new U.S. bioengineered food disclosure standard. Shoppers are seeing labels on food products with the terms “bioengineered” or “derived from bioengineering” printed on a green seal with the sun shining down on cropland.

More than 90% of U.S.-grown corn, soybeans and sugar beets are genetically modified. This means that many processed foods containing high-fructose corn syrup, beet sugar or soy protein may fall under the new disclosure standard. Other whole foods on the USDA’s list of bioengineered foods, such as certain types of eggplant, potatoes and apples, may have to carry labels as well.

Disclosure debates

Food manufacturers have historically opposed labeling. They argue that it misleads consumers into thinking that bioengineered foods are unsafe. Countless studies, the USDA and the World Health Organization have concluded that eating genetically modified foods does not pose health risks.

However, many consumers have demanded labels that let them know whether foods contain genetically modified material. In 2014, Vermont enacted a strict law mandating GMO food labeling. Fearing a checkerboard of state laws and regulations, food manufacturers lobbied successfully for a federal disclosure law to preempt other states from doing the same. Now, the U.S. joins 64 countries that require some sort of labeling.

Consumer and right-to-know advocates are not happy with the new federal disclosure standard. The Center for Food Safety, the lead organization representing a coalition of food labeling nonprofits and retailers, has filed suit against the USDA, arguing that the standard not only fails to use common language but is deceptive and discriminatory.

According to this view, the standard is deceptive because loopholes exclude many bioengineered foods from mandatory disclosure, which critics say is inconsistent with consumer expectations. If the genetic material is undetectable or less than 5% of the finished product, no disclosure is required. As a result, many highly refined products – for example, sugar or oil made from a bioengineered crop – may be excluded from labeling requirements.

Bioengineered foods served in restaurants, cafeterias and transport systems, including food trucks, are also excluded. And the standard excludes meat, poultry and eggs, as well as products that list those foods as either their first ingredient or their second ingredient after water, stock or both. It takes a 43-minute USDA webinar to explain what’s in and what’s out under this new disclosure standard.

Advocates say the standard is discriminatory because it gives food manufacturers disclosure options that can substitute for the green bioengineered seal. They include listing a phone number to call or text for information or a QR code. But critics point out that many people in the U.S. lack access to smartphones, particularly those over 65 and those earning less than $30,000 annually.

In my view, consumers who want to avoid bioengineered foods may best be served by buying products that are certified organic, which prohibits genetically modified ingredients. Or they can search for the voluntary Non-GMO Project Verified label, which features a butterfly. It was launched in 2010 and appears on tens of thousands of grocery items. Both labels indicate that a third-party inspector verified that the non-GMO standard has been met.

The new federal labeling standard came to market with little fanfare – probably because neither side in the battle over genetic modification and food sees it as a win.The Conversation

About the Author:

Kathleen Merrigan, Executive Director, Swette Center for Sustainable Food Systems, Arizona State University

This article is republished from The Conversation under a Creative Commons license. Read the original article.

The Week Ahead – USD Finds Support As Rate Hike Looms

By Orbex

USD

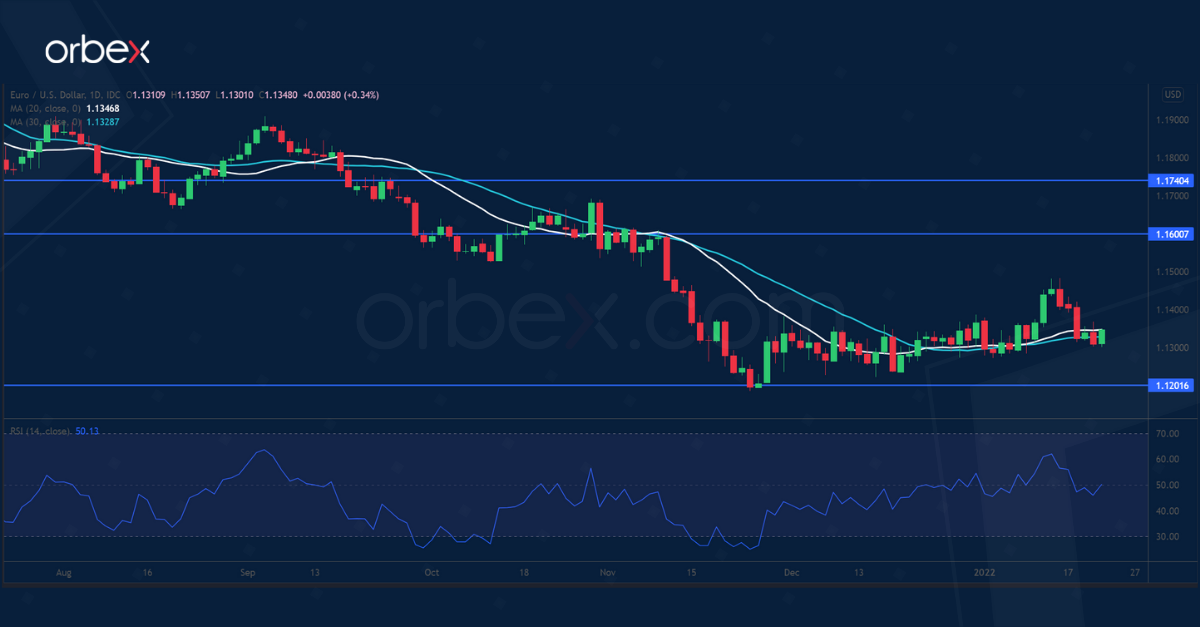
EURUSD weakens ahead of Fed meeting

EURUSD

The US dollar rallies as the markets price in a hawkish tone out of this week’s Fed policy meeting.

As the US unemployment rate falls under 4% and inflation reaches a 40-year high, traders are pondering how strong the Fed’s hand will be. Market rumors are that there could be at least four hikes this year. And a half percentage point in March (rather than a quarter point) could further boost demand for the dollar.

Soaring US Treasury yields offers the greenback solid support. In the meantime, the euro would continue to suffer from the ECB’s inaction. The pair may still drift between 1.1200 and 1.1600.

USDCAD slips over BOC rate hike hopes

USDCAD

The Canadian dollar climbs as the Bank of Canada may raise interest rates this week.

Canada’s annual inflation rate hit a 30-year high in December. In turn, this fuelled bets that the central bank will bring forward its tightening agenda and announce a hike in the upcoming meeting.

The greenback may continue to shed gains as its neighbor’s monetary policy catches up. Meanwhile, loonie buyers enjoy a sweet spot amid rises in commodity prices.

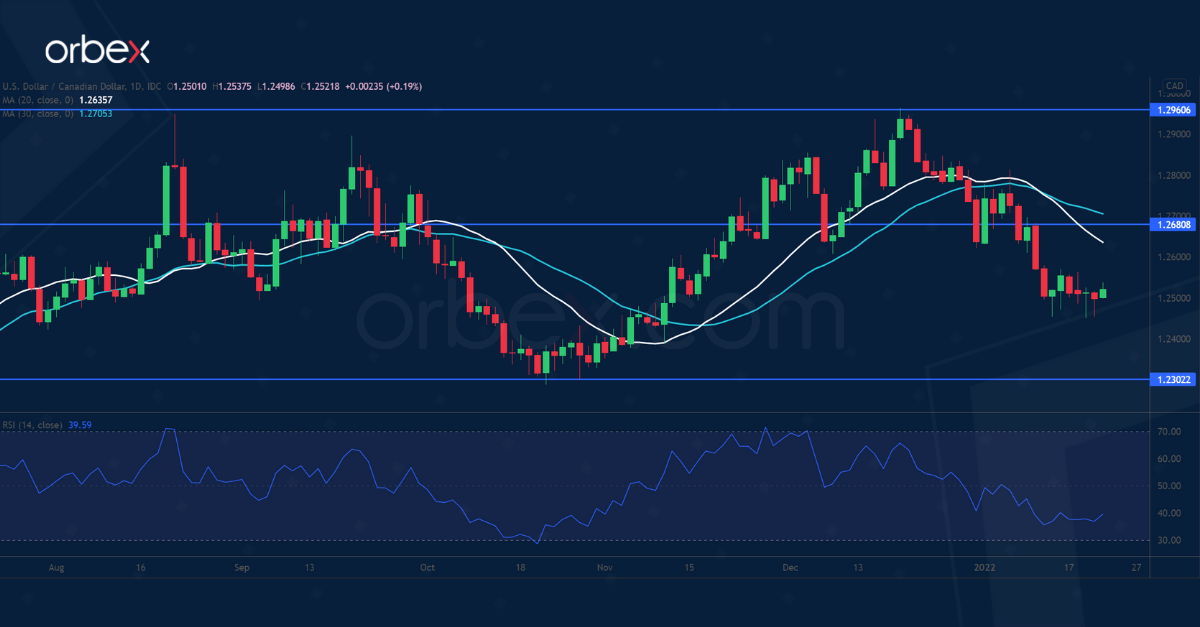
As oil prices reach seven-year highs, the Canadian dollar has found an effective floor. The pair is sliding towards 1.2300. A rebound may come under pressure near 1.2680.

UKOIL rallies on tight supply

UKOIL

Oil prices find support from robust demand forecasts and short-term supply constraints. Producers’ firm grip on the output makes it a seller’s market.

The International Energy Agency reported that the OPEC+ group’s production was below its targets in December. In conjunction with low inventories across major economies and upgraded demand forecast, the bulls’ run is yet to end.

Sporadic outages and geopolitical risks in the Middle East could only exacerbate price volatility. A pullback towards 82.00 could be due to the recent parabolic rise. The psychological tag of 90.00 is the next target.

US 100 slumps as sentiment worsens

NASDAQ

The Nasdaq tumbles as investors bet on the Federal Reserve’s aggressive monetary tightening.

Expectations of a sharp rise in US interest rates would send Treasury yields sky-high, making risk assets like growth stocks much less attractive. To rub salt in the wound, earnings disappointments from what were hot stocks last year shatter investors’ hope for a swift rebound.

Lastly, tensions in Ukraine add a layer of geopolitical risks that could keep investors on their feet. Needless to say, the market is in for a bumpy ride as sentiment deteriorates.

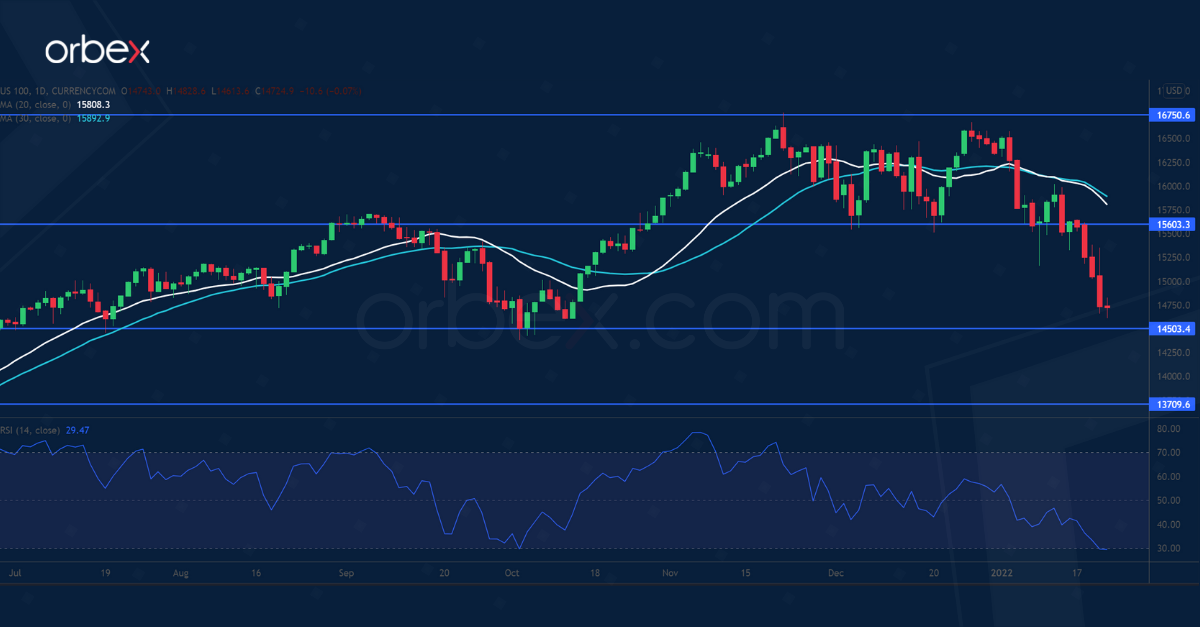
The index is hovering above the daily support at 14500. 15600 is the first hurdle ahead.


Orbex-LogoArticle by Orbex

Orbex is a fully licensed broker that was established in 2011. Founded with a mission to serve its traders responsibly and provides traders with access to the world’s largest and most liquid financial markets. www.orbex.com

China’s Strong Secular Performance on Track

By Dan Steinbock

– Understandably, there was great interest in President Xi’s Davos address. Despite great global challenges, China’s economic performance reflects long-term strength, with strong data on trade and investment, and new resiliency.

In his January 2017 address at the World Economic Forum (WEF), Chinese president Xi Jinping promoted global economic interdependency warning that protectionism would produce no winners. A year ago, Chinese he called for both greater global efforts in the fight against an unprecedented public health crisis and a renewed commitment to multilateral cooperation.

In his third WEF address, President Xi noted that the recovery of the world economy is predicated on the defeat of the once-in-a-century pandemic and the new inflation risks of inflation. As Xi cautioned: “If major economies slam on the brakes or take a U-turn in their monetary policies, there would be serious negative spillovers. They would present challenges to global economic and financial stability, and developing countries would bear the brunt of it.”

Prior to Xi’s speech, Western media featured gloomy expectations over the 4th quarter growth data. Yet, China topped impressively its 2021 growth (8.1% over the target of “above 6%”), despite expected deceleration in the 4th quarter.

Recent elevated regulatory activity and emphasis of “common prosperity” will reinforce sustained and more inclusive growth in the long-term – as evidenced by strong data on trade and investment, reforms in capital markets and new resiliency.

Strong trade and investment performance

In 2021, China’s exports and imports exceeded $6 trillion for the first time. The economy continued its recovery over the past year, despite slowing export growth on the back of a stronger yuan. Global prospects remain challenging, due to the Omicron variant, supply disruptions and higher costs, and weakening demand.

In December, China’s trade surplus widened to a record high of $95.5 billion; over $20 billion more than in the same month a year earlier. For the full year, the trade surplus widened to $676 billion, the highest on record with exports surging 29.9% and imports 30.1%. Exports continued their double-digit growth for the 15th month.

For 2021, China’s trade surplus with the US was $397 billion; 25% higher than in 2020. In light of the ongoing US trade wars and geopolitical containment efforts against the mainland, the achievement is extraordinary.

China’s performance has been reinforced by strong capital flows, thanks to the mainland’s encouragement of foreign direct investment (FDI).

Actualized foreign direct investment (FDI) into China reached a new record in 2021, when the FDI increased 14.9% year-on-year; or 20.2% in US dollar terms. In relative terms, countries and regions along the routes of Belt and Road Initiative (BRI) booked a 29.4% rise in their investment in China, while investment flows of the Southeast Asian economies (ASEAN) soared 29%.

Opening of capital markets

Heralding promising future, China’s strong performance has been reinforced by further opening of capital markets.

By December 2021, overseas investors had raised their holdings of mainland stocks and bonds by over 11% since the end of 2020, according to the People’s Bank of China (PBOC). As Reuters headlined, “foreign holdings of China government bonds smash record in November on index inclusion.”

Indeed, November marked the first full month of phased inclusion of China’s government bonds in FTSE Russell’s World Government Bond Index (WGBI). The inclusion could eventually drive $130 billion of index-related foreign inflows into the mainland bonds over a 36-month period.

Recently, US Treasuries have traded around 1.86%, as opposed to Chinese government bonds around 3.39%. As the Federal Reserve will hike rates in the coming months, US yields are likely to increase. Then again, so may Chinese yields. Moreover, as the Fed may respond hastily and belatedly to America’s highest inflation in 40 years, it could stir more volatility in the market. In contrast, Chinese bonds represent a vital diversification instrument and promising future.

Yuan’s appreciation

Last October, the PBOC stated it was phasing out the use of the countercyclical factor, launched in 2017 to contain yuan’s depreciation. A more hands-off stance toward the exchange rate has fostered appreciation. The yuan may face a rougher ride in 2022, due to normalization by overseas central banks.

Nonetheless, all these trends contributed to an intriguing development in late 2021, when Chinese yuan seemed to “decouple” from the US dollar.

The bilateral relationship between the two currencies had been consistent since the mid-2010s, as measured by the US Dollar Index (DXY). When the value of the US dollar increased, that of the Chinese yuan decreased. In the last quarter of 2021, the inverse relationship changed. US dollar and Chinese yuan appreciated in tandem.

The shift was reflected by the CFETS RMB Index; China’s version of the US Dollar Index. It measures the value of the yuan against a basket of 24 currencies, including the US dollar and the euro. The weakness of other major world currencies pushed Index from 94.8 in December 2020 to a high of 102.8 at the end of November and remains around 102.1.

Signs of new resiliency

Obviously, China’s recent data has been fostered by the mainland’s strong trade performance, impressive investment and promising capital flows. Moreover, the Omicron variant and its potential offspring pose new challenges to global prospects.

Even if the Fed’s impending rate normalization would constrain capital flows to emerging markets, the continued opening of the mainland’s financial sector is likely to offset some of the pressure. Furthermore, FDI into China is likely to prove resilient, due to capital inflows from the Belt and Road and ASEAN economies.
China’s strategic focus is on enduring secular trends, not fleeting quarterly results.

About the Author:

Dr. Dan Steinbock is an internationally recognized strategist of the multipolar world and the founder of Difference Group. He has served at India, China and America Institute (US), Shanghai Institutes for International Studies (China) and the EU Center (Singapore). For more, see https://www.differencegroup.net/  

A version of the commentary was published by China Daily on Jan. 17, 2022


Fibonacci Retracements Analysis 21.01.2022 (AUDUSD, USDCAD)

Article By RoboForex.com

AUDUSD, “Australian Dollar vs US Dollar”

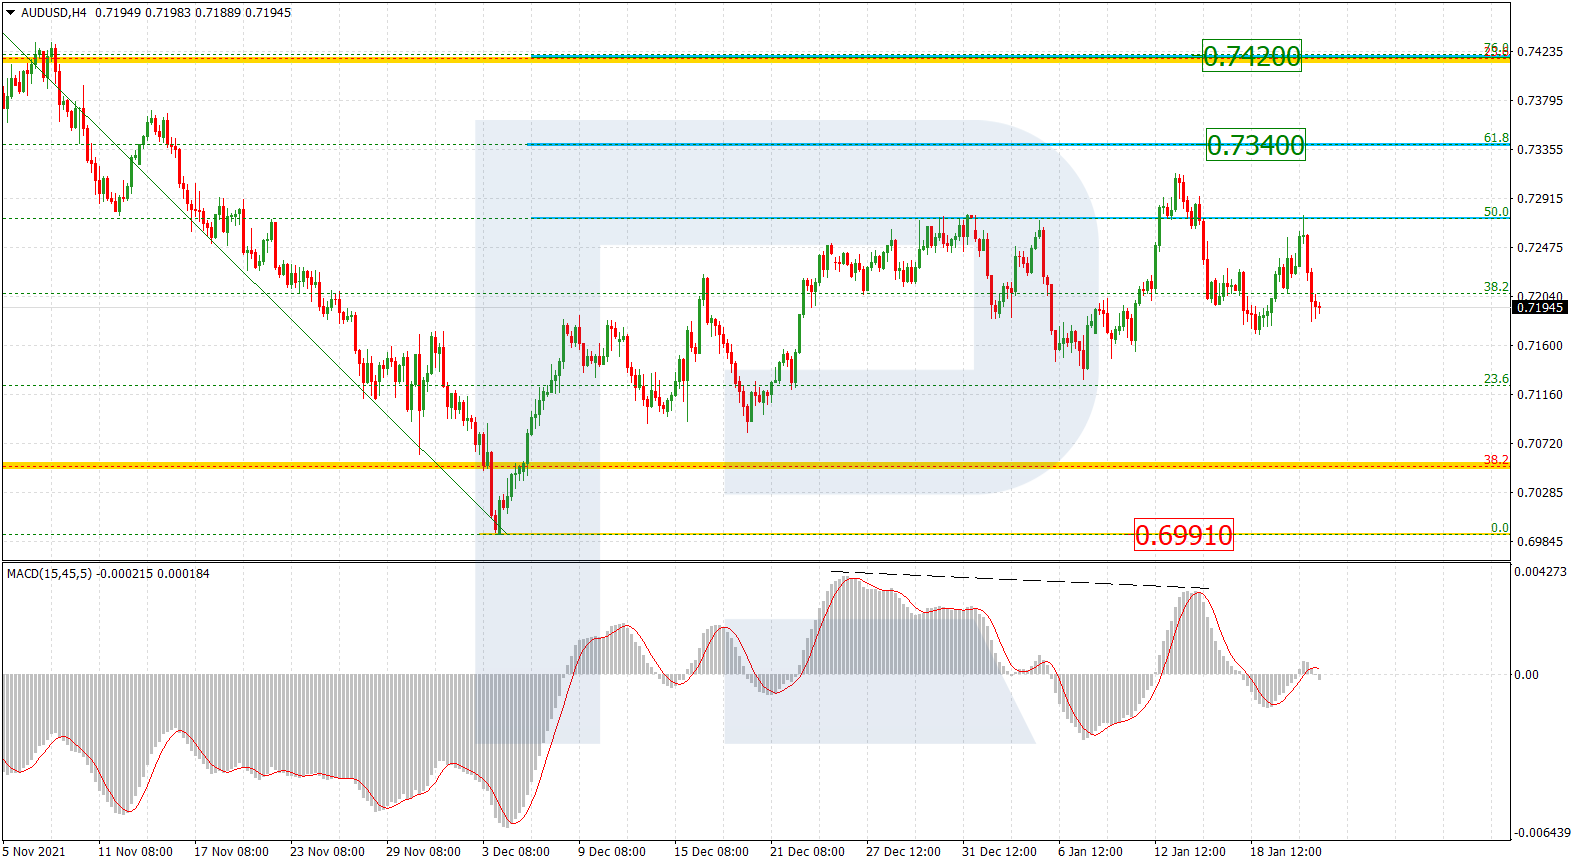
As we can see in the H4 chart, the asset is moving to the downside after finishing the correctional uptrend at 50.0% fibo and divergence on MACD. One can expect another rising impulse towards 61.8% and 76.0% fibo at 0.7340 and 0.7420 but the main scenario implies a further downtrend to reach the low at 0.6991.

AUDUSD_H4
Risk Warning: the result of previous trading operations do not guarantee the same results in the future

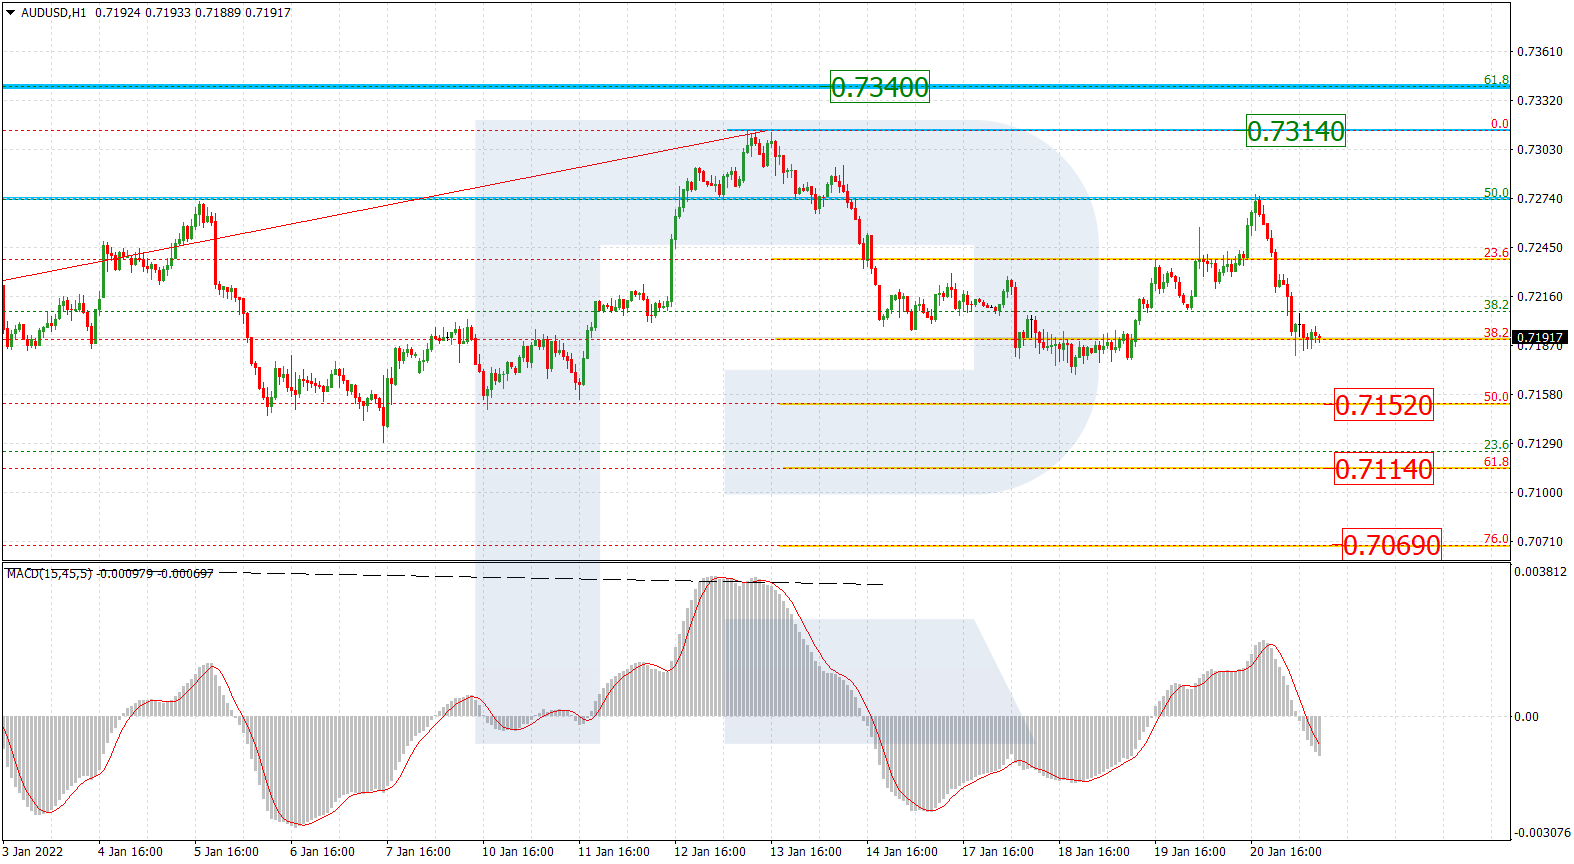
The H1 chart shows a more detailed structure of the current descending tendency, which has already tested 38.2% fibo twice. The next downside targets may be 50.0%, 61.8%, and 76.0% fibo at 0.7152, 0.7114, and 0.7069 respectively. The resistance is the high at 0.7314.

AUDUSD_H1
Risk Warning: the result of previous trading operations do not guarantee the same results in the future

USDCAD, “US Dollar vs Canadian Dollar”

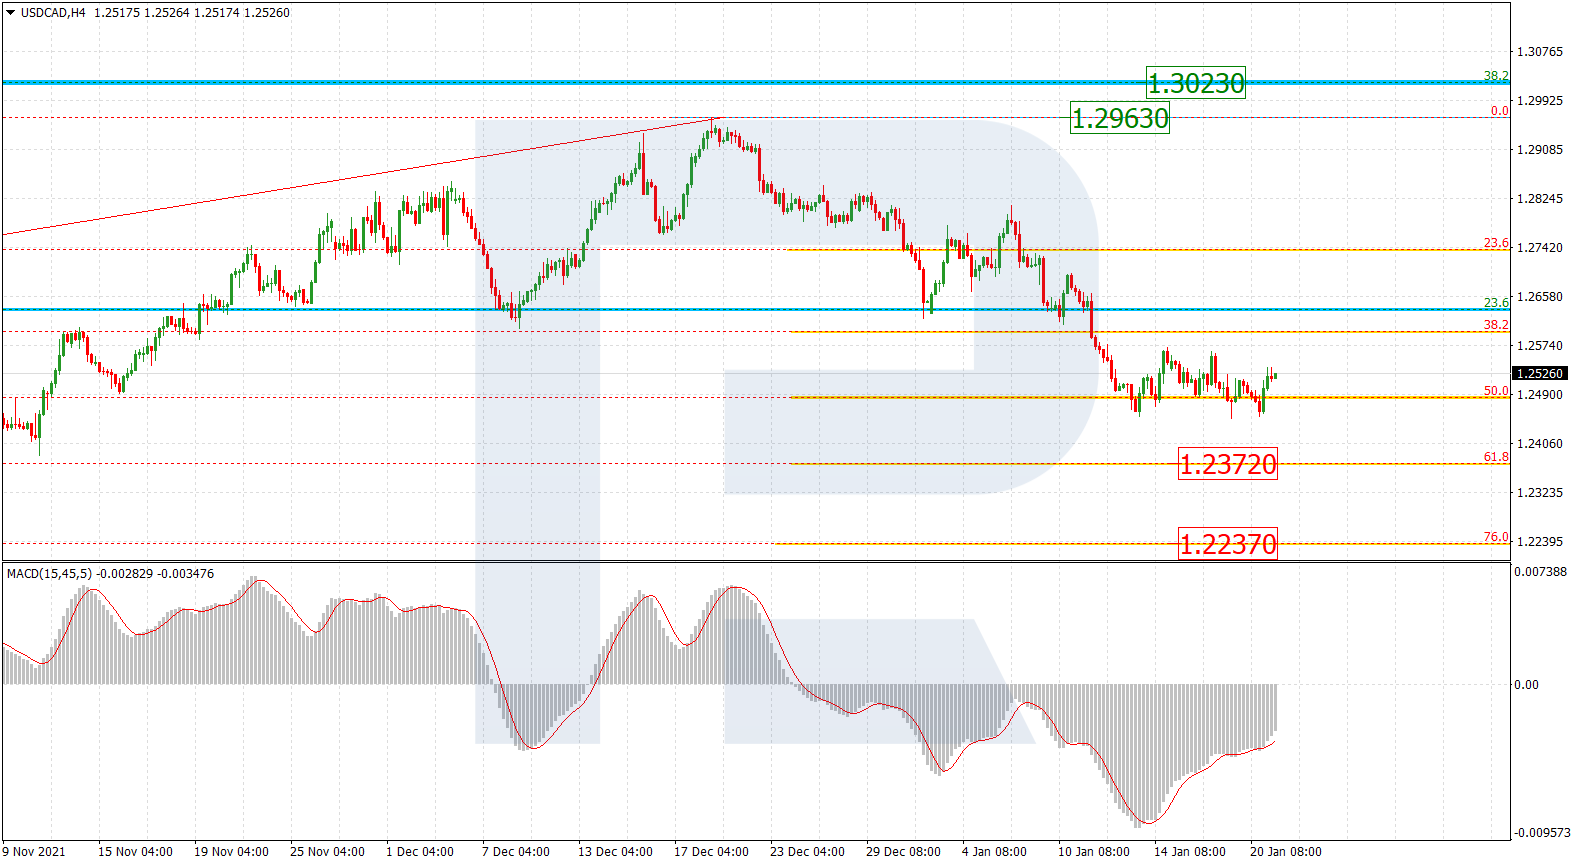
As we can see in the H4 chart, the price is still falling; right now, it testing 50.0% fibo. Later, after completing a slight pullback, the asset may continue trading downwards to reach 61.8% and 76.0% fibo at 1.2372 and 1.2237 respectively. The resistance is the high at 1.2963.

USDCAD_H4
Risk Warning: the result of previous trading operations do not guarantee the same results in the future

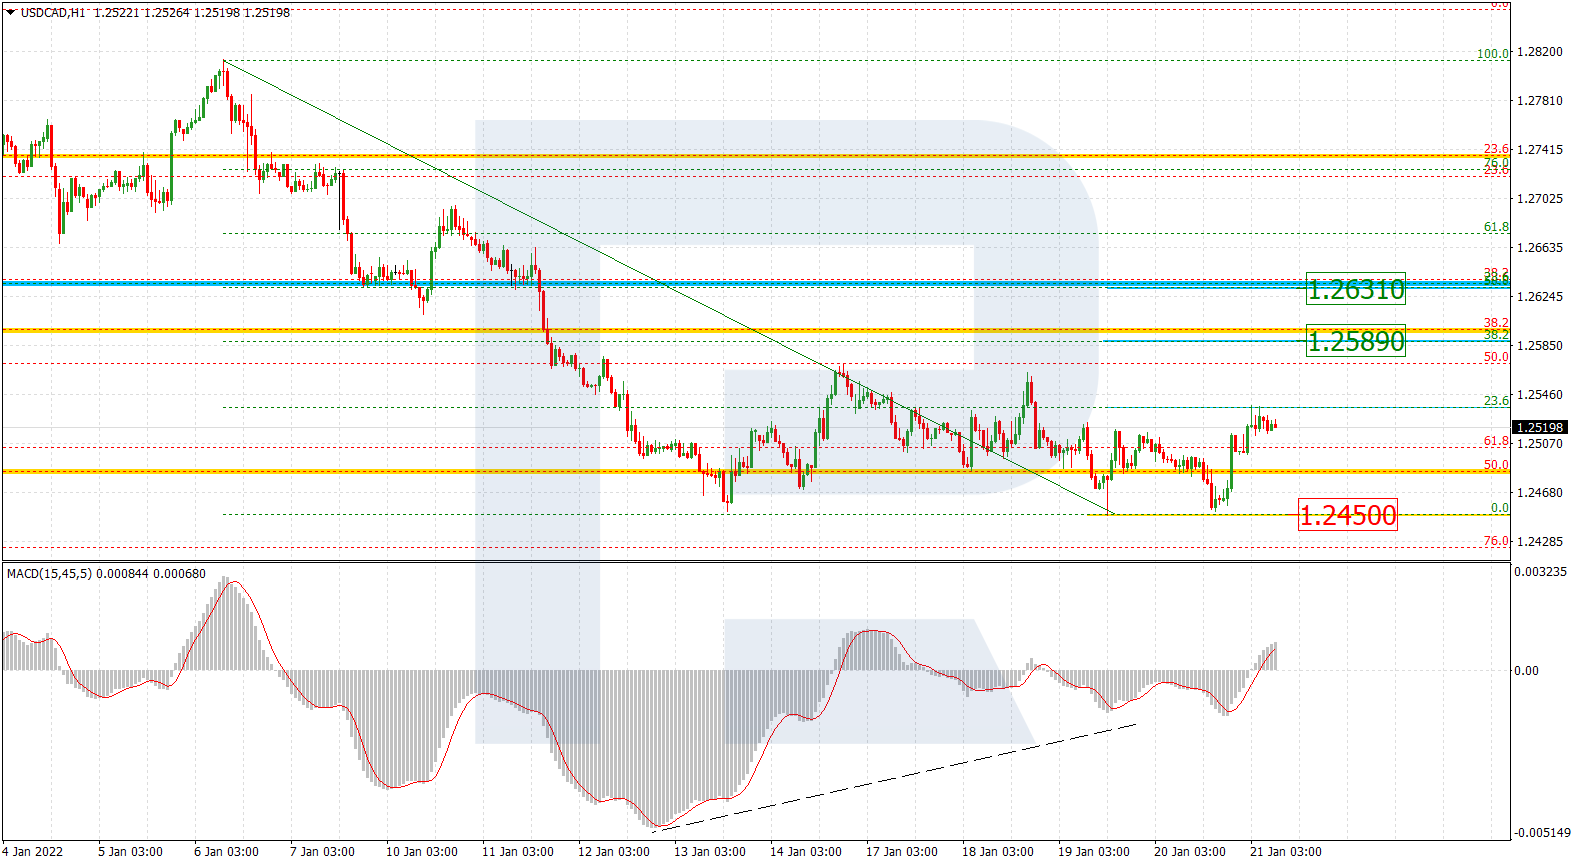
The H1 chart shows a more detailed structure of the current correction. After divergence on MACD, the growth has reached 23.6% fibo; the next upside targets may be 38.2% and 50.0% fibo at 1.2589 and 1.2631 respectively. A breakout of the local low at 1.2450 will indicate that the pullback is over and the asset may resume trading downwards.

USDCAD_H1

Article By RoboForex.com

Attention!
Forecasts presented in this section only reflect the author’s private opinion and should not be considered as guidance for trading. RoboForex LP bears no responsibility for trading results based on trading recommendations described in these analytical reviews.

Ichimoku Cloud Analysis 21.01.2022 (GBPUSD, XAGUSD, USDCHF)

Article By RoboForex.com

GBPUSD, “Great Britain Pound vs US Dollar”

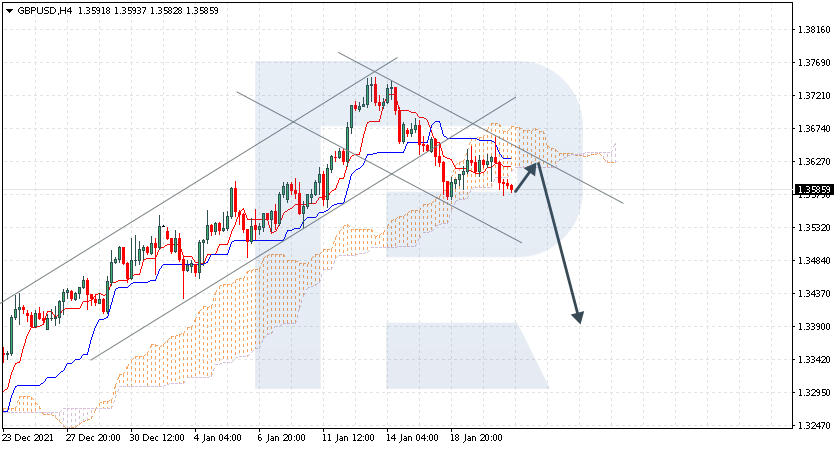
GBPUSD is trading at 1.3585; the instrument is moving below Ichimoku Cloud, thus indicating a descending tendency. The markets could indicate that the price may test the cloud’s downside border at 1.3620 and then resume moving downwards to reach 1.3390. Another signal in favour of a further downtrend will be a rebound from the descending channel’s upside border. However, the bearish scenario may no longer be valid if the price breaks the cloud’s upside border and fixes above 1.3685. In this case, the pair may continue growing towards 1.3775.

GBPUSD
Risk Warning: the result of previous trading operations do not guarantee the same results in the future

XAGUSD, “Silver vs US Dollar”

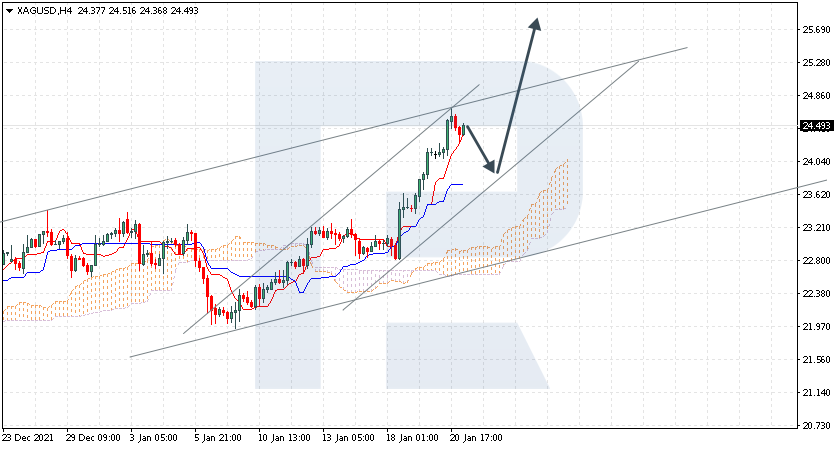
XAGUSD is trading at 24.49; the instrument is moving above Ichimoku Cloud, thus indicating an ascending tendency. The markets could indicate that the price may test Tenkan-Sen and Kijun-Sen at 23.95 and then resume moving upwards to reach 25.65. Another signal in favour of a further uptrend will be a rebound from the rising channel’s downside border. However, the bullish scenario may no longer be valid if the price breaks the cloud’s downside border and fixes below 22.25. In this case, the pair may continue falling towards 21.35. To confirm further growth, the asset must break the rising channel’s upside border and fix above 25.25.

XAGUSD
Risk Warning: the result of previous trading operations do not guarantee the same results in the future

USDCHF, “US Dollar vs Swiss Franc”

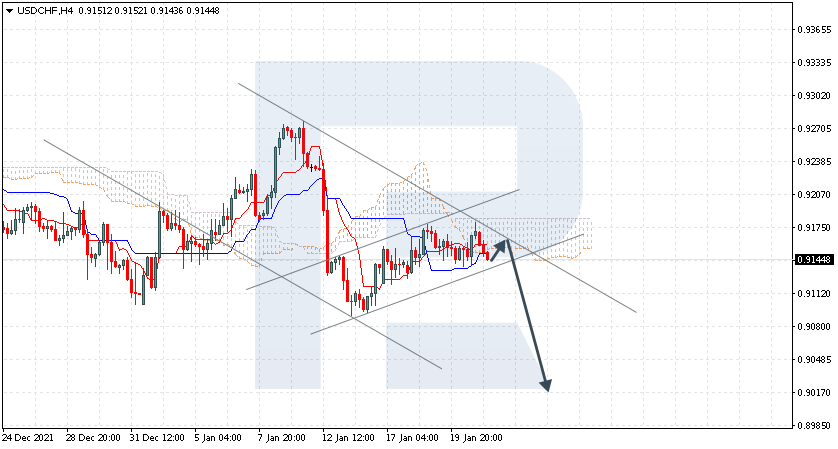
USDCHF is trading at 0.9144; the instrument is moving below Ichimoku Cloud, thus indicating a descending tendency. The markets could indicate that the price may test the cloud’s downside border at 0.9155 and then resume moving downwards to reach 0.9020. Another signal in favour of a further downtrend will be a rebound from the descending channel’s upside border. However, the bearish scenario may no longer be valid if the price breaks the cloud’s upside border and fixes above 0.9210. In this case, the pair may continue growing towards 0.9305. To confirm further decline, the asset must break the downside border of the Flag pattern and fix below 0.9115.

USDCHF

Article By RoboForex.com

Attention!
Forecasts presented in this section only reflect the author’s private opinion and should not be considered as guidance for trading. RoboForex LP bears no responsibility for trading results based on trading recommendations described in these analytical reviews.

The Analytical Overview of the Main Currency Pairs on 2022.01.21

by JustForex

The EUR/USD currency pair

Technical indicators of the currency pair:
  • Prev Open: 1.1340
  • Prev Close: 1.1310
  • % chg. over the last day: -0.26%

The ECB minutes showed that the European Central Bank officials agreed that the recent and near-term forecasted rise in inflation was mainly due to temporary causes, which are likely to reduce in 2022. According to ECB President Christine Lagarde, the European Central Bank has “good reason” not to respond as forcefully as the Federal Reserve to rising consumer prices. Interest rates are not expected to rise in 2022.

Trading recommendations
  • Support levels: 1.1317, 1.1305, 1.1288
  • Resistance levels: 1.1356, 1.1384, 1.1405

From the technical point of view, the EUR/USD on the hour time frame is bearish. The MACD indicator is in the negative zone, but there are signs of divergence. Under such market conditions, it is better to consider sell trades from the resistance levels near the moving average. Buy trades can be considered on the lower time frames from the support level of 1.1317, but only with additional confirmation in the form of a buyer’s initiative.

Alternative scenario: if the price breaks out through the 1.1405 resistance level and fixes above, the mid-term uptrend will be renewed.

EUR/USD
News feed for 2022.01.21:
  • – Eurozone ECB President Lagarde Speaks at 14:30 (GMT+2).

The GBP/USD currency pair

Technical indicators of the currency pair:
  • Prev Open: 1.3610
  • Prev Close: 1.3598
  • % chg. over the last day: -0.09%

Yesterday, British Prime Minister Boris Johnson announced the abolition of mandatory covid passports in England and the wearing of masks in public places. He also announced that Plan B, introduced due to the spread of the Omicron strain, would not be extended after January 25th, and England would return to Plan A. The government is no longer required to work from home.

Trading recommendations
  • Support levels: 1.3581, 1.3551, 1.3479
  • Resistance levels: 1.3619, 1.3661, 1.3689, 1.3715

On the hourly time frame, the trend on GBP/USD is bearish. The MACD indicator is in the negative zone, but there are the first signs of divergence. Under such market conditions, sell deals are best to look at from the resistance level of 1.3619. Buy trades should be considered from the support level of 1.3581, but only with additional confirmation in the form of buyers’ initiative.

Alternative scenario: if the price breaks out through the 1.3661 resistance level and consolidates above, the bearish scenario will be broken.

GBP/USD
News feed for 2022.01.21:
  • – UK Retail Sales (m/m) at 09:00 (GMT+2).

The USD/JPY currency pair

Technical indicators of the currency pair:
  • Prev Open: 114.32
  • Prev Close: 114.11
  • % chg. over the last day: -0.18%

Core consumer prices in Japan increased by 0.5% in December compared to last year. The nationwide core consumer price index, excluding food prices, showed growth for the fourth month in a row. The Japanese yen is strengthening now as a safe haven currency amid a massive sell-off in the US stock market.

Trading recommendations
  • Support levels: 113.64, 113.25, 112.87
  • Resistance levels: 113.99, 114.63, 115.04, 115.35, 115.64

The global trend on the USD/JPY currency pair is bearish. Buy deals are best to look at the lower time frames from the nearest support levels. Sell trades can be considered from the resistance level of 113.99, but only with confirmation in the form of a sellers’ initiative, as the monetary policy of the Bank of Japan is now aimed at decreasing the Japanese yen.

Alternative scenario: if the price fixes above 114.63, the uptrend will likely resume.

USD/JPY
News feed for 2022.01.21:
  • – Japan National Core Consumer Price Index at 01:30 (GMT+2);
  • – Japan Monetary Policy Meeting Minutes at 01:50 (GMT+2).

The USD/CAD currency pair

Technical indicators of the currency pair:
  • Prev Open: 1.2506
  • Prev Close: 1.2504
  • % chg. over the last day: -0.02%

The Canadian dollar is a commodity currency, so it depends not only on the monetary policy of the Bank of Canada but also on the oil prices and the dollar index. Oil quotes fell sharply by 2% on the background of sell-off on the US stock market and unexpected growth of weekly crude oil reserves in the USA. Taking into account the dollar index growth, USD/CAD quotes rose slightly by the end of the day.

Trading recommendations
  • Support levels: 1.2476, 1.2427
  • Resistance levels: 1.2537, 1.2628, 1.2678, 1.2715

From a technical point of view, the USD/CAD currency pair is bearish. The price is now trading in a corridor with a range of 1.2476-1.2537. The price range has shifted slightly lower, but the price has remained trading within the corridor. The MACD indicator has become positive. Under such market conditions, it is better to look for buy deals from the level of 1.2476 on the lower time frames. It is better to consider sell deals from the upper border of the range of 1.2537.

Alternative scenario: if the price breaks through the 1.2575 resistance level and fixes above, the downtrend is likely to be broken.

USD/CAD
News feed for 2022.01.21:
  • – US Crude Oil Reserves (w/w) at 18:00 (GMT+2).

by JustForex


This article reflects a personal opinion and should not be interpreted as an investment advice, and/or offer, and/or a persistent request for carrying out financial transactions, and/or a guarantee, and/or a forecast of future events.

European Flash January PMIs

By Orbex

The omicron variant has restored the question of how much the restrictions to curb the spread of covid will affect retailers. Now, the focus across Europe seems to be more on getting people to vaccinate, than restricting gatherings or access to enclosed spaces.

That could put additional strain on retailers in the form of increased costs to check patrons’ vaccination status. However, it doesn’t directly impede people from going shopping. Since even the unvaccinated can get tested to comply with the rules.

So, the restrictions aren’t the largest problem retailers are facing during this stage of the pandemic. The issue now has shifted to being able to get supply and deal with rising costs.

What the data means for the markets

Services PMI figures have come to the fore during the recovery, as investors gauge how much the economy has reopened and normalized. The sector has remained largely in positive territory during the recovery period.

But at some point, it will start normalizing. And the data can lead to two conflicting effects, so it’s important to understand the underlying dynamics.

On the one hand, higher PMI indicates more optimism among retailers and could be a sign of better economic conditions. On the other, it could also indicate increased consumer demand in a situation plagued by supply problems.

Moreover, it can potentially indicate higher inflation. This could change the market’s outlook for when the ECB could start dealing with inflation.

This could explain the unusual situation where manufacturing PMI in some cases is higher than the services PMI. We have to remember though, that these are preliminary results, and subject to adjustment when the final results come out on February 1st.

What we are expecting

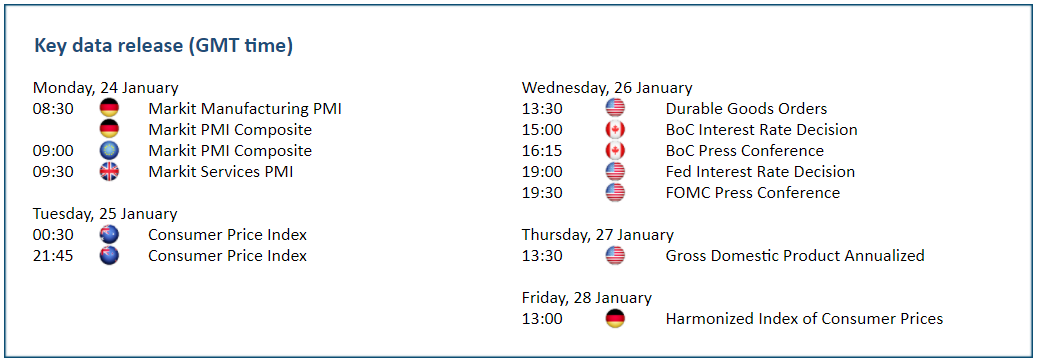
First to report is France, and it’s likely to set the tone for the day. Analysts project French Services PMI to decline modestly to 56.5 from 57.0 in December. Meanwhile, they expect Manufacturing PMI to perform a little worse, declining to 54.4 from 55.6 prior. Both are well in expansion, but trending in the wrong direction.

Germany’s PMIs could move the market if they contradict France’s. German Manufacturing PMI could slip a bit, though stay well in expansion at 57.0, compared to 57.4 in the prior month. The Services component, however, could move further into contraction to 48 from 48.7.

That’s a worrying sign for the economy. Nevertheless, this could indicate that consumer demand is faltering, potentially easing inflationary pressures in the EU’s largest economy.

For the whole of the eurozone, economists anticipate Composite PMI to show dwindling optimism among businesses. Specifically, it could just barely be in expansion at 52.2 compared to 53.3 in the prior reading.

Finally, the prediction for the UK Services PMI is to buck the European trend, moving higher to 54.0 from 53.6. Most notably, the survey was largely conducted before PM Johnson announced the lifting of most covid restrictions. UK Manufacturing PMI could show a little loss of optimism but still remain comfortably in expansion at 57.0, down from 57.9 in December.


Orbex-LogoArticle by Orbex

Orbex is a fully licensed broker that was established in 2011. Founded with a mission to serve its traders responsibly and provides traders with access to the world’s largest and most liquid financial markets. www.orbex.com