Currency Speculators raise their bullish bets for Canadian Dollar to 40-week high

By InvestMacro | COT | Data Tables | COT Leaders | Downloads | COT Newsletter
Here are the latest charts and statistics for the Commitment of Traders (COT) data published by the Commodities Futures Trading Commission (CFTC).

The latest COT data is updated through Tuesday April 19th and shows a quick view of how large traders (for-profit speculators and commercial entities) were positioned in the futures markets. All currency positions are in direct relation to the US dollar where, for example, a bet for the euro is a bet that the euro will rise versus the dollar while a bet against the euro will be a bet that the euro will decline versus the dollar.

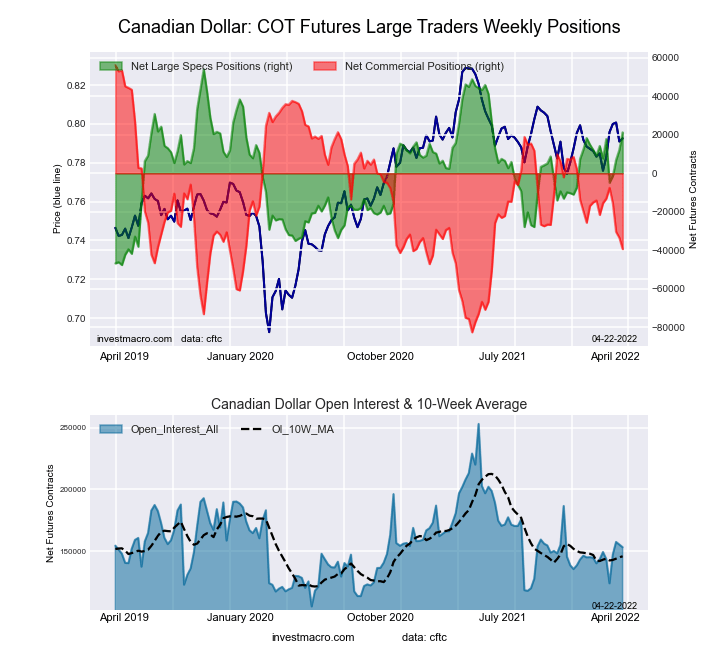
Highlighting the COT currency data is the rising of bullish bets in the Canadian ‘Loonie’ dollar currency futures contracts. CAD speculators raised their bullish bets for a fourth straight week this week and for the fifth time in the past six weeks. Over the past four-week time-frame, CAD bets have improved by a total of +26,166 contracts, going from -4,940 net positions on March 22nd to +21,226 net positions this week. These gains have brought this week’s speculator level to the most bullish position since July 13th of 2021, a span of forty weeks.

This recent improvement in Loonie sentiment has been helped out by the hike in interest rates by the Bank of Canada (BOC). The BOC recently pushed its key interest rate higher by 50 basis points on April 13th and has in the past few days hinted that more interest rate rises were to come. The recent inflation numbers out of Canada were above expectations (6.7 percent) and according to Bloomberg, market participants have pushed their odds to 100 percent for another 50 basis point hike in June.

Overall, the currencies with higher speculator bets this week were the US Dollar Index (2,943 contracts), Japanese yen (4,640 contracts), Swiss franc (2,492 contracts), New Zealand dollar (654 contracts), Canadian dollar (9,068 contracts)and the Mexican peso (6,704 contracts).

The currencies with declining bets were the Euro (-7,759 contracts), Brazil real (-1,557 contracts), Australian dollar (-122 contracts), Bitcoin (-361 contracts) and the British pound sterling (-5,860 contracts).


Speculator strength standings for each Commodity where strength index is current net position compared to past three years, above 80 is bullish extreme, below 20 is bearish extreme


Data Snapshot of Forex Market Traders | Columns Legend
Apr-19-2022OIOI-IndexSpec-NetSpec-IndexCom-NetCOM-IndexSmalls-NetSmalls-Index
USD Index54,5247732,58082-35,893153,31353
EUR675,9397231,30145-49,7266218,4255
GBP249,52970-58,9143272,88973-13,97527
JPY251,29190-107,1873129,84299-22,6557
CHF44,26920-11,4505023,05157-11,60129
CAD153,3023221,22668-39,3383118,11266
AUD147,30943-28,8375820,800348,03772
NZD41,098263657250331-86842
MXN165,4033321,66437-26,214624,55062
RUB20,93047,54331-7,15069-39324
BRL70,5536844,57294-47,06352,49194
Bitcoin11,27661-19490-175036921


US Dollar Index Futures:

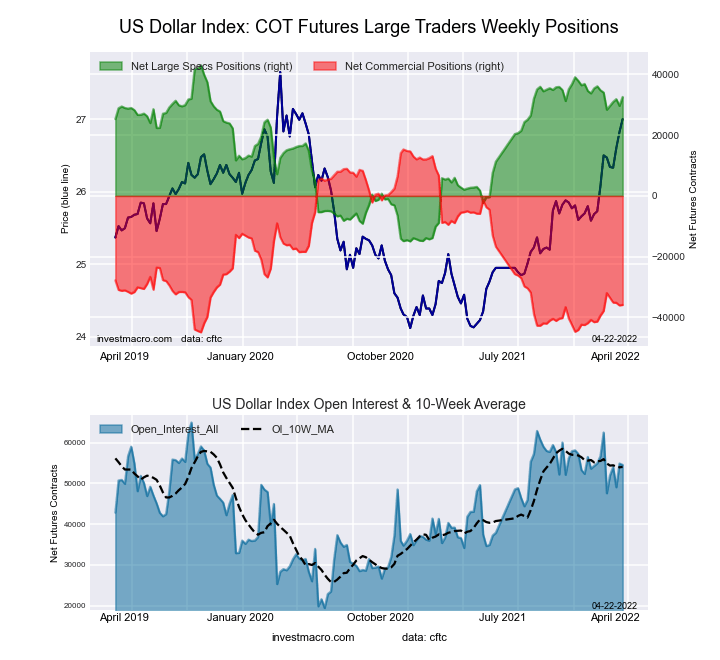
US Dollar Index Forex Futures COT ChartThe US Dollar Index large speculator standing this week reached a net position of 32,580 contracts in the data reported through Tuesday. This was a weekly lift of 2,943 contracts from the previous week which had a total of 29,637 net contracts.

This week’s current strength score (the trader positioning range over the past three years, measured from 0 to 100) shows the speculators are currently Bullish-Extreme with a score of 82.0 percent. The commercials are Bearish-Extreme with a score of 15.0 percent and the small traders (not shown in chart) are Bullish with a score of 52.8 percent.

US DOLLAR INDEX StatisticsSPECULATORSCOMMERCIALSSMALL TRADERS
– Percent of Open Interest Longs:85.63.39.5
– Percent of Open Interest Shorts:25.969.13.5
– Net Position:32,580-35,8933,313
– Gross Longs:46,6851,7785,198
– Gross Shorts:14,10537,6711,885
– Long to Short Ratio:3.3 to 10.0 to 12.8 to 1
NET POSITION TREND:
– Strength Index Score (3 Year Range Pct):82.015.052.8
– Strength Index Reading (3 Year Range):Bullish-ExtremeBearish-ExtremeBullish
NET POSITION MOVEMENT INDEX:
– 6-Week Change in Strength Index:-2.53.3-5.8


Euro Currency Futures:

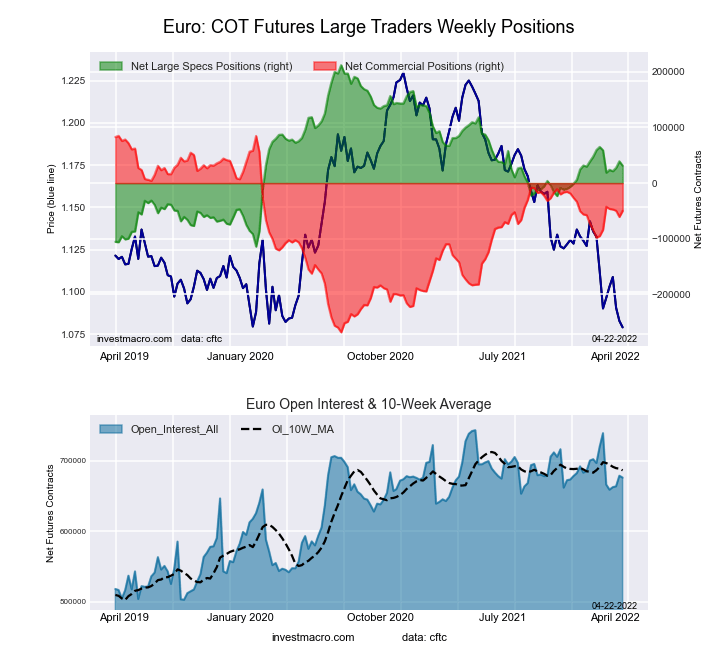
Euro Currency Futures COT ChartThe Euro Currency large speculator standing this week reached a net position of 31,301 contracts in the data reported through Tuesday. This was a weekly lowering of -7,759 contracts from the previous week which had a total of 39,060 net contracts.

This week’s current strength score (the trader positioning range over the past three years, measured from 0 to 100) shows the speculators are currently Bearish with a score of 44.6 percent. The commercials are Bullish with a score of 61.9 percent and the small traders (not shown in chart) are Bearish-Extreme with a score of 4.9 percent.

EURO Currency StatisticsSPECULATORSCOMMERCIALSSMALL TRADERS
– Percent of Open Interest Longs:32.753.711.4
– Percent of Open Interest Shorts:28.161.08.7
– Net Position:31,301-49,72618,425
– Gross Longs:221,003362,93076,939
– Gross Shorts:189,702412,65658,514
– Long to Short Ratio:1.2 to 10.9 to 11.3 to 1
NET POSITION TREND:
– Strength Index Score (3 Year Range Pct):44.661.94.9
– Strength Index Reading (3 Year Range):BearishBullishBearish-Extreme
NET POSITION MOVEMENT INDEX:
– 6-Week Change in Strength Index:-8.59.7-10.9


British Pound Sterling Futures:

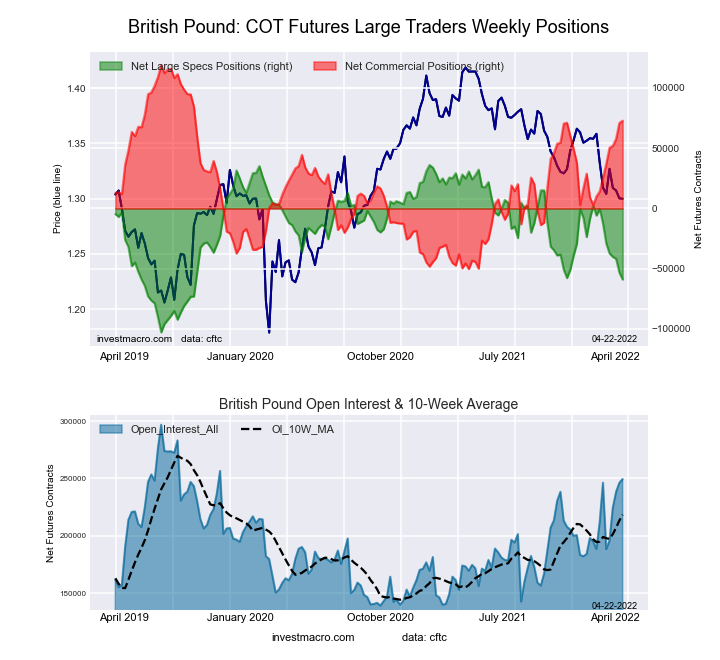
British Pound Sterling Futures COT ChartThe British Pound Sterling large speculator standing this week reached a net position of -58,914 contracts in the data reported through Tuesday. This was a weekly decrease of -5,860 contracts from the previous week which had a total of -53,054 net contracts.

This week’s current strength score (the trader positioning range over the past three years, measured from 0 to 100) shows the speculators are currently Bearish with a score of 31.6 percent. The commercials are Bullish with a score of 72.8 percent and the small traders (not shown in chart) are Bearish with a score of 26.7 percent.

BRITISH POUND StatisticsSPECULATORSCOMMERCIALSSMALL TRADERS
– Percent of Open Interest Longs:14.874.68.8
– Percent of Open Interest Shorts:38.445.414.4
– Net Position:-58,91472,889-13,975
– Gross Longs:36,811186,13421,987
– Gross Shorts:95,725113,24535,962
– Long to Short Ratio:0.4 to 11.6 to 10.6 to 1
NET POSITION TREND:
– Strength Index Score (3 Year Range Pct):31.672.826.7
– Strength Index Reading (3 Year Range):BearishBullishBearish
NET POSITION MOVEMENT INDEX:
– 6-Week Change in Strength Index:-33.428.1-2.2


Japanese Yen Futures:

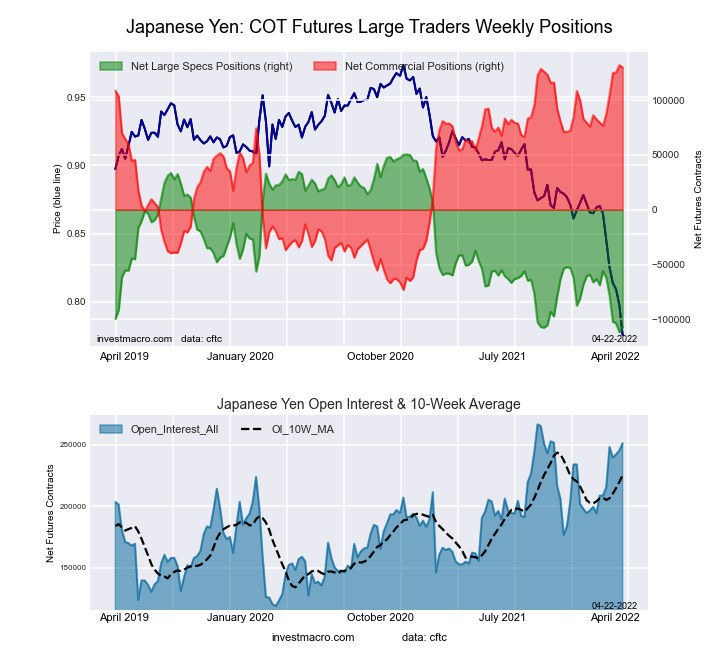
Japanese Yen Forex Futures COT ChartThe Japanese Yen large speculator standing this week reached a net position of -107,187 contracts in the data reported through Tuesday. This was a weekly lift of 4,640 contracts from the previous week which had a total of -111,827 net contracts.

This week’s current strength score (the trader positioning range over the past three years, measured from 0 to 100) shows the speculators are currently Bearish-Extreme with a score of 2.9 percent. The commercials are Bullish-Extreme with a score of 99.0 percent and the small traders (not shown in chart) are Bearish-Extreme with a score of 7.4 percent.

JAPANESE YEN StatisticsSPECULATORSCOMMERCIALSSMALL TRADERS
– Percent of Open Interest Longs:5.186.08.3
– Percent of Open Interest Shorts:47.734.317.3
– Net Position:-107,187129,842-22,655
– Gross Longs:12,723216,10120,761
– Gross Shorts:119,91086,25943,416
– Long to Short Ratio:0.1 to 12.5 to 10.5 to 1
NET POSITION TREND:
– Strength Index Score (3 Year Range Pct):2.999.07.4
– Strength Index Reading (3 Year Range):Bearish-ExtremeBullish-ExtremeBearish-Extreme
NET POSITION MOVEMENT INDEX:
– 6-Week Change in Strength Index:-31.625.9-3.8


Swiss Franc Futures:

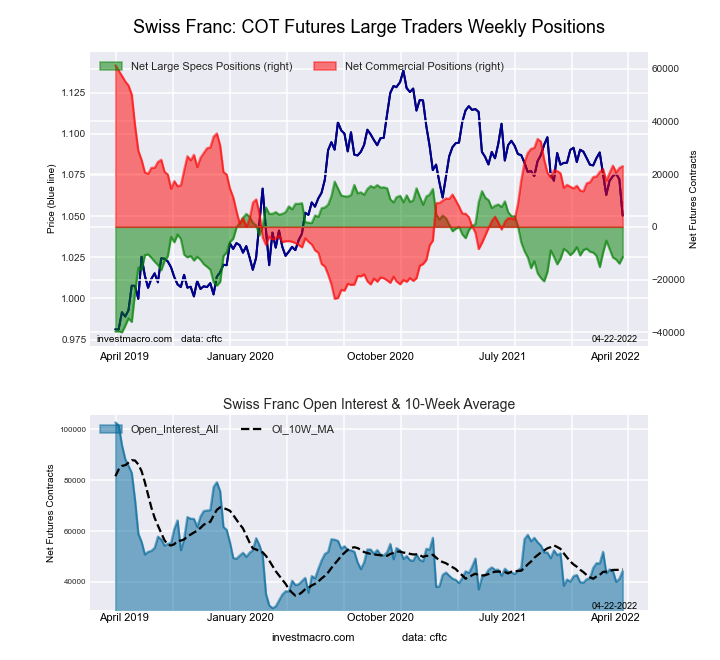
Swiss Franc Forex Futures COT ChartThe Swiss Franc large speculator standing this week reached a net position of -11,450 contracts in the data reported through Tuesday. This was a weekly increase of 2,492 contracts from the previous week which had a total of -13,942 net contracts.

This week’s current strength score (the trader positioning range over the past three years, measured from 0 to 100) shows the speculators are currently Bearish with a score of 50.0 percent. The commercials are Bullish with a score of 56.8 percent and the small traders (not shown in chart) are Bearish with a score of 29.2 percent.

SWISS FRANC StatisticsSPECULATORSCOMMERCIALSSMALL TRADERS
– Percent of Open Interest Longs:6.671.721.7
– Percent of Open Interest Shorts:32.419.647.9
– Net Position:-11,45023,051-11,601
– Gross Longs:2,90031,7359,599
– Gross Shorts:14,3508,68421,200
– Long to Short Ratio:0.2 to 13.7 to 10.5 to 1
NET POSITION TREND:
– Strength Index Score (3 Year Range Pct):50.056.829.2
– Strength Index Reading (3 Year Range):BearishBullishBearish
NET POSITION MOVEMENT INDEX:
– 6-Week Change in Strength Index:-3.01.31.8


Canadian Dollar Futures:

Canadian Dollar Forex Futures COT ChartThe Canadian Dollar large speculator standing this week reached a net position of 21,226 contracts in the data reported through Tuesday. This was a weekly advance of 9,068 contracts from the previous week which had a total of 12,158 net contracts.

This week’s current strength score (the trader positioning range over the past three years, measured from 0 to 100) shows the speculators are currently Bullish with a score of 67.7 percent. The commercials are Bearish with a score of 31.1 percent and the small traders (not shown in chart) are Bullish with a score of 65.8 percent.

CANADIAN DOLLAR StatisticsSPECULATORSCOMMERCIALSSMALL TRADERS
– Percent of Open Interest Longs:28.745.024.6
– Percent of Open Interest Shorts:14.970.712.8
– Net Position:21,226-39,33818,112
– Gross Longs:44,06368,98937,784
– Gross Shorts:22,837108,32719,672
– Long to Short Ratio:1.9 to 10.6 to 11.9 to 1
NET POSITION TREND:
– Strength Index Score (3 Year Range Pct):67.731.165.8
– Strength Index Reading (3 Year Range):BullishBearishBullish
NET POSITION MOVEMENT INDEX:
– 6-Week Change in Strength Index:13.4-17.220.4


Australian Dollar Futures:

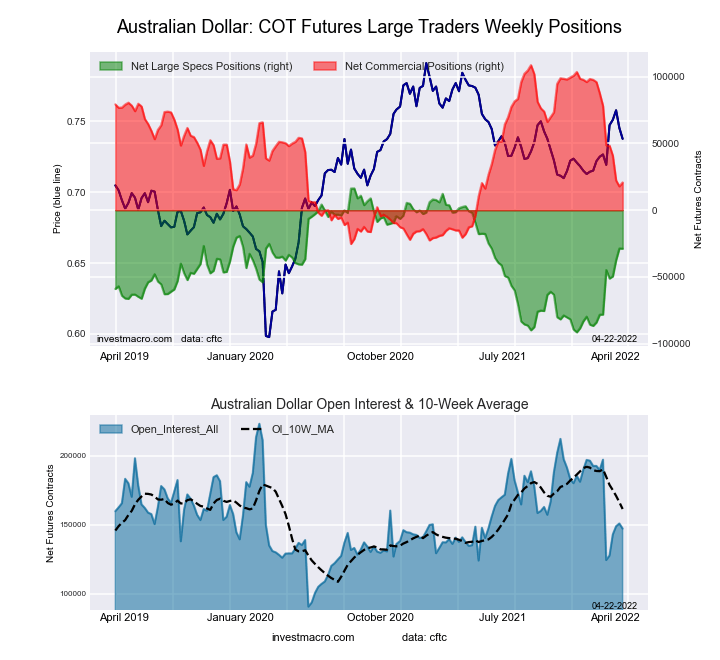
Australian Dollar Forex Futures COT ChartThe Australian Dollar large speculator standing this week reached a net position of -28,837 contracts in the data reported through Tuesday. This was a weekly decline of -122 contracts from the previous week which had a total of -28,715 net contracts.

This week’s current strength score (the trader positioning range over the past three years, measured from 0 to 100) shows the speculators are currently Bullish with a score of 58.1 percent. The commercials are Bearish with a score of 34.4 percent and the small traders (not shown in chart) are Bullish with a score of 72.0 percent.

AUSTRALIAN DOLLAR StatisticsSPECULATORSCOMMERCIALSSMALL TRADERS
– Percent of Open Interest Longs:26.653.819.2
– Percent of Open Interest Shorts:46.239.613.7
– Net Position:-28,83720,8008,037
– Gross Longs:39,20179,20828,257
– Gross Shorts:68,03858,40820,220
– Long to Short Ratio:0.6 to 11.4 to 11.4 to 1
NET POSITION TREND:
– Strength Index Score (3 Year Range Pct):58.134.472.0
– Strength Index Reading (3 Year Range):BullishBearishBullish
NET POSITION MOVEMENT INDEX:
– 6-Week Change in Strength Index:45.8-42.819.6


New Zealand Dollar Futures:

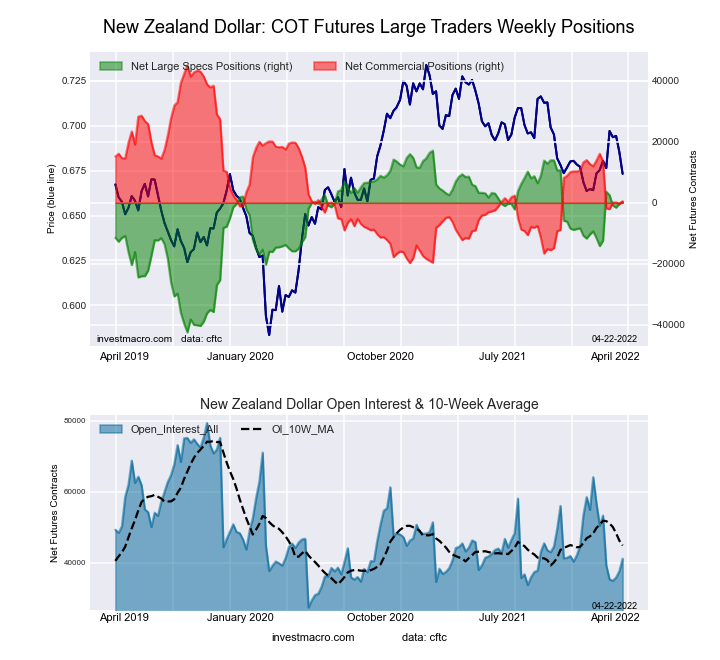
New Zealand Dollar Forex Futures COT ChartThe New Zealand Dollar large speculator standing this week reached a net position of 365 contracts in the data reported through Tuesday. This was a weekly boost of 654 contracts from the previous week which had a total of -289 net contracts.

This week’s current strength score (the trader positioning range over the past three years, measured from 0 to 100) shows the speculators are currently Bullish with a score of 71.9 percent. The commercials are Bearish with a score of 31.2 percent and the small traders (not shown in chart) are Bearish with a score of 41.9 percent.

NEW ZEALAND DOLLAR StatisticsSPECULATORSCOMMERCIALSSMALL TRADERS
– Percent of Open Interest Longs:46.445.96.8
– Percent of Open Interest Shorts:45.544.68.9
– Net Position:365503-868
– Gross Longs:19,08118,8532,797
– Gross Shorts:18,71618,3503,665
– Long to Short Ratio:1.0 to 11.0 to 10.8 to 1
NET POSITION TREND:
– Strength Index Score (3 Year Range Pct):71.931.241.9
– Strength Index Reading (3 Year Range):BullishBearishBearish
NET POSITION MOVEMENT INDEX:
– 6-Week Change in Strength Index:21.4-20.24.0


Mexican Peso Futures:

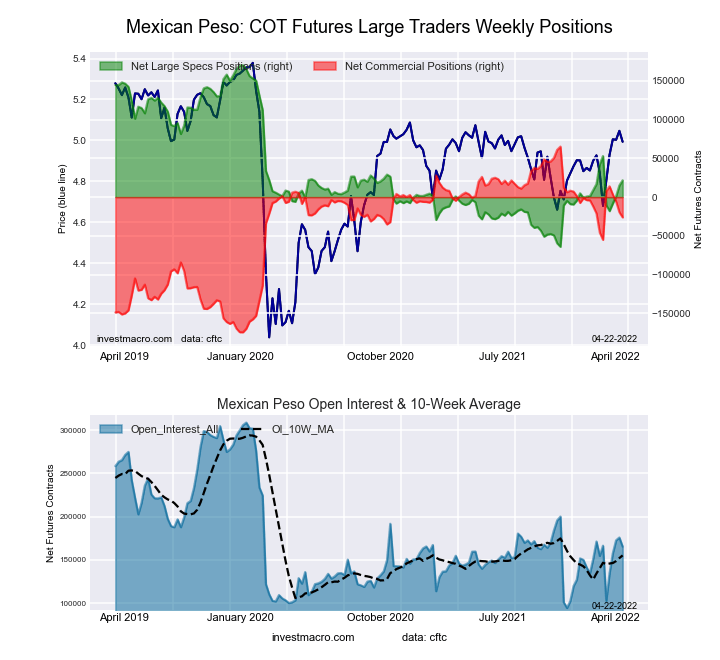
Mexican Peso Futures COT ChartThe Mexican Peso large speculator standing this week reached a net position of 21,664 contracts in the data reported through Tuesday. This was a weekly advance of 6,704 contracts from the previous week which had a total of 14,960 net contracts.

This week’s current strength score (the trader positioning range over the past three years, measured from 0 to 100) shows the speculators are currently Bearish with a score of 36.6 percent. The commercials are Bullish with a score of 61.9 percent and the small traders (not shown in chart) are Bullish with a score of 62.3 percent.

MEXICAN PESO StatisticsSPECULATORSCOMMERCIALSSMALL TRADERS
– Percent of Open Interest Longs:44.650.04.7
– Percent of Open Interest Shorts:31.565.81.9
– Net Position:21,664-26,2144,550
– Gross Longs:73,71082,6437,701
– Gross Shorts:52,046108,8573,151
– Long to Short Ratio:1.4 to 10.8 to 12.4 to 1
NET POSITION TREND:
– Strength Index Score (3 Year Range Pct):36.661.962.3
– Strength Index Reading (3 Year Range):BearishBullishBullish
NET POSITION MOVEMENT INDEX:
– 6-Week Change in Strength Index:-13.412.110.1


Brazilian Real Futures:

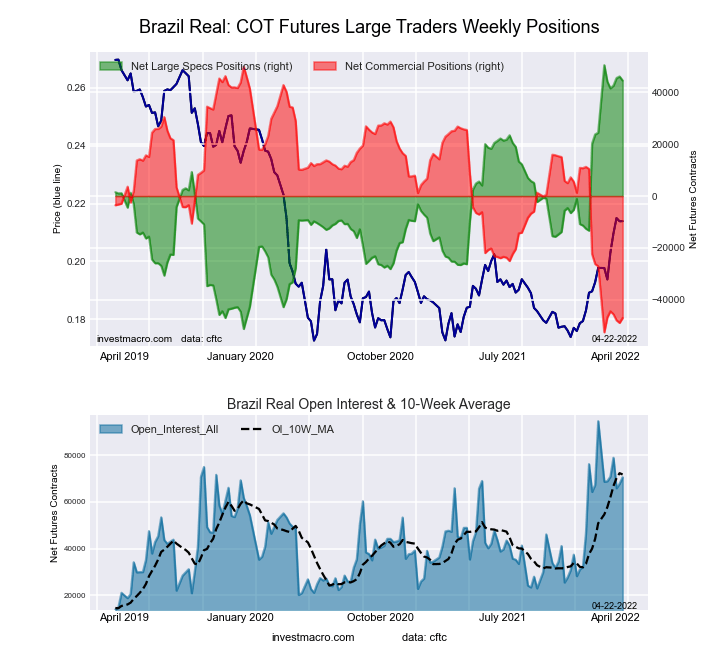
Brazil Real Futures COT ChartThe Brazilian Real large speculator standing this week reached a net position of 44,572 contracts in the data reported through Tuesday. This was a weekly fall of -1,557 contracts from the previous week which had a total of 46,129 net contracts.

This week’s current strength score (the trader positioning range over the past three years, measured from 0 to 100) shows the speculators are currently Bullish-Extreme with a score of 94.2 percent. The commercials are Bearish-Extreme with a score of 5.4 percent and the small traders (not shown in chart) are Bullish-Extreme with a score of 94.0 percent.

BRAZIL REAL StatisticsSPECULATORSCOMMERCIALSSMALL TRADERS
– Percent of Open Interest Longs:76.217.66.1
– Percent of Open Interest Shorts:13.184.32.5
– Net Position:44,572-47,0632,491
– Gross Longs:53,79012,3994,272
– Gross Shorts:9,21859,4621,781
– Long to Short Ratio:5.8 to 10.2 to 12.4 to 1
NET POSITION TREND:
– Strength Index Score (3 Year Range Pct):94.25.494.0
– Strength Index Reading (3 Year Range):Bullish-ExtremeBearish-ExtremeBullish-Extreme
NET POSITION MOVEMENT INDEX:
– 6-Week Change in Strength Index:-5.85.45.0


Bitcoin Futures:

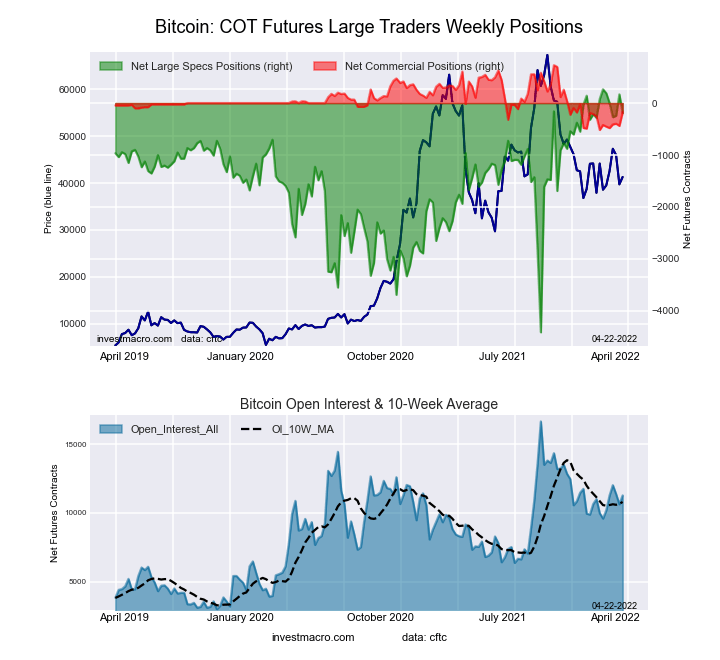
Bitcoin Crypto Futures COT ChartThe Bitcoin large speculator standing this week reached a net position of -194 contracts in the data reported through Tuesday. This was a weekly decline of -361 contracts from the previous week which had a total of 167 net contracts.

This week’s current strength score (the trader positioning range over the past three years, measured from 0 to 100) shows the speculators are currently Bullish-Extreme with a score of 90.2 percent. The commercials are Bearish with a score of 27.4 percent and the small traders (not shown in chart) are Bearish with a score of 21.3 percent.

BITCOIN StatisticsSPECULATORSCOMMERCIALSSMALL TRADERS
– Percent of Open Interest Longs:73.33.610.2
– Percent of Open Interest Shorts:75.05.27.0
– Net Position:-194-175369
– Gross Longs:8,2634081,155
– Gross Shorts:8,457583786
– Long to Short Ratio:1.0 to 10.7 to 11.5 to 1
NET POSITION TREND:
– Strength Index Score (3 Year Range Pct):90.227.421.3
– Strength Index Reading (3 Year Range):Bullish-ExtremeBearishBearish
NET POSITION MOVEMENT INDEX:
– 6-Week Change in Strength Index:-9.819.84.8


Article By InvestMacroReceive our weekly COT Reports by Email

*COT Report: The COT data, released weekly to the public each Friday, is updated through the most recent Tuesday (data is 3 days old) and shows a quick view of how large speculators or non-commercials (for-profit traders) were positioned in the futures markets.

The CFTC categorizes trader positions according to commercial hedgers (traders who use futures contracts for hedging as part of the business), non-commercials (large traders who speculate to realize trading profits) and nonreportable traders (usually small traders/speculators) as well as their open interest (contracts open in the market at time of reporting).See CFTC criteria here.

COT Metals Speculators reduce their Gold bullish bets but positions remain strong

By InvestMacro | COT | Data Tables | COT Leaders | Downloads | COT Newsletter

Here are the latest charts and statistics for the Commitment of Traders (COT) data published by the Commodities Futures Trading Commission (CFTC).

The latest COT data is updated through Tuesday April 19th and shows a quick view of how large traders (for-profit speculators and commercial entities) were positioned in the futures markets.

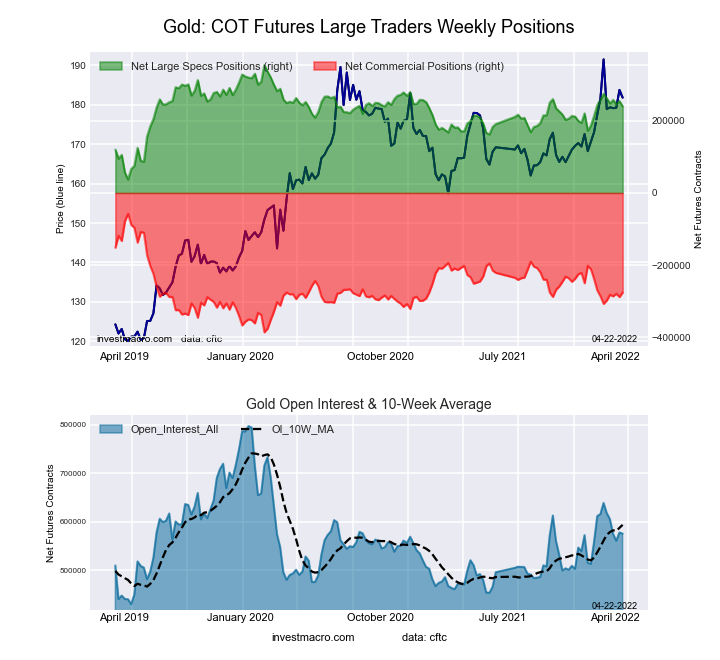
Highlighting the COT metals data is the recent decline in the Gold futures bets. The speculative net position in the Gold futures has fallen for two out of the past three weeks and in four out of the past six weeks. Previously, Gold speculator positions had added bullish bets for five consecutive weeks from February 8th through March 8th and brought the speculator bullish standing to the highest level in sixty-one weeks at +274,388 contracts.

The recent reduction in speculator bets and the slight cool off in the Gold price do not necessarily mean that sentiment for the shiny metal is turning. In fact, the Gold position may have greater heights in store as open interest levels have not recently touched any significant peak high (typically a surge of opinions and counter-opinions that can stop a trend especially at key levels) and the speculator strength level has not reached (or gotten close to) a bullish-extreme level (both of these levels can be signs of a top and exhaustion in trends). The net position for Gold, even after the recent weakness, remains above the 2022 weekly average of +230,004 contracts (the weekly average of all of 2021 was +204,623 contracts). So despite a rising interest rate environment (which may hurt or may help Gold), the combination of super-hot inflationary pressures, a war-time crisis and strong sentiment could help make Gold primed to stay on its bullish path.

Overall, the markets with higher speculator bets this week were Silver (443 contracts) and Platinum (1,122 contracts).

The markets with declining speculator bets this week were Gold (-14,530 contracts), Copper (-4,510 contracts) and Palladium (-149 contracts).


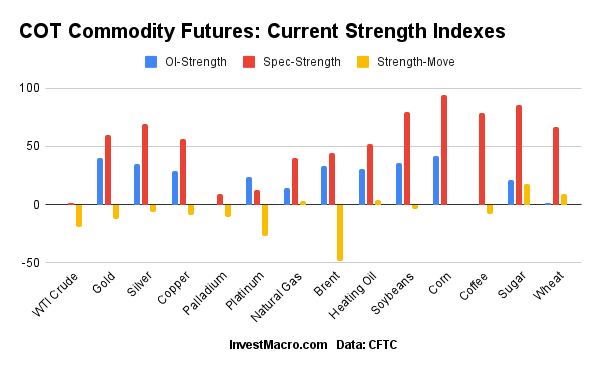
Speculator strength standings for each Commodity where strength index is current net position compared to past three years, above 80 is bullish extreme, below 20 is bearish extreme


Data Snapshot of Commodity Market Traders | Columns Legend
Apr-19-2022OIOI-IndexSpec-NetSpec-IndexCom-NetCOM-IndexSmalls-NetSmalls-Index
WTI Crude1,740,3000307,6971-351,25210043,55576
Gold575,20240239,75760-275,5253735,76866
Silver170,5773546,42969-63,2883716,85941
Copper203,8962918,84056-28,307409,46780
Palladium6,4350-2,18291,5608562280
Platinum61,603247,53713-13,812896,27550
Natural Gas1,144,04714-130,0064082,1135747,893100
Brent191,88333-40,1024437,663562,43942
Heating Oil349,618316,45552-32,4343725,97988
Soybeans762,85536200,09880-174,87325-25,22528
Corn1,625,19842500,61294-456,2697-44,34318
Coffee209,410041,80379-45,447243,64415
Sugar909,62221239,51586-295,4701255,95577
Wheat337,038123,24567-20,42521-2,82098


Gold Comex Futures:

Gold Futures COT ChartThe Gold Comex Futures large speculator standing this week was a net position of 239,757 contracts in the data reported through Tuesday. This was a weekly decline of -14,530 contracts from the previous week which had a total of 254,287 net contracts.

This week’s current strength score (the trader positioning range over the past three years, measured from 0 to 100) shows the speculators are currently Bullish with a score of 60.4 percent. The commercials are Bearish with a score of 37.0 percent and the small traders (not shown in chart) are Bullish with a score of 65.7 percent.

Gold Futures StatisticsSPECULATORSCOMMERCIALSSMALL TRADERS
– Percent of Open Interest Longs:57.522.59.6
– Percent of Open Interest Shorts:15.870.43.3
– Net Position:239,757-275,52535,768
– Gross Longs:330,745129,15755,032
– Gross Shorts:90,988404,68219,264
– Long to Short Ratio:3.6 to 10.3 to 12.9 to 1
NET POSITION TREND:
– Strength Index Score (3 Year Range Pct):60.437.065.7
– Strength Index Reading (3 Year Range):BullishBearishBullish
NET POSITION MOVEMENT INDEX:
– 6-Week Change in Strength Index:-12.010.69.1


Silver Comex Futures:

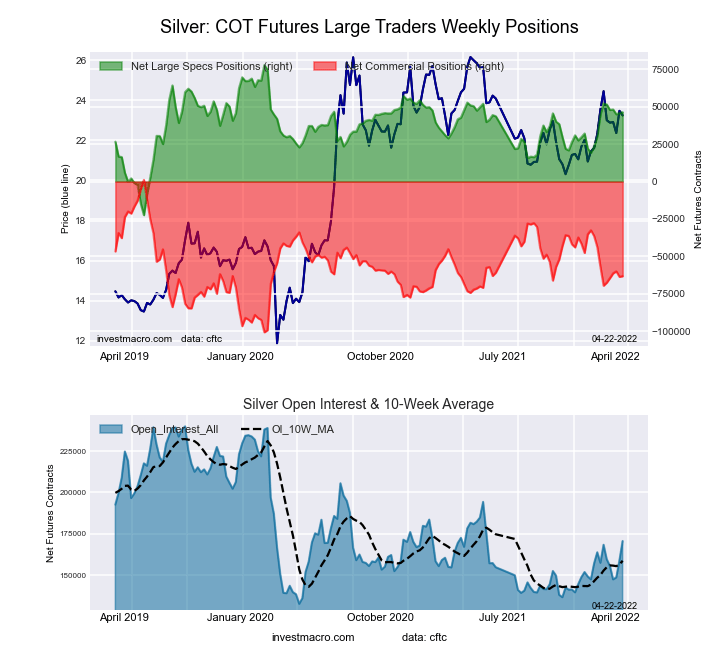
Silver Futures COT ChartThe Silver Comex Futures large speculator standing this week was a net position of 46,429 contracts in the data reported through Tuesday. This was a weekly increase of 443 contracts from the previous week which had a total of 45,986 net contracts.

This week’s current strength score (the trader positioning range over the past three years, measured from 0 to 100) shows the speculators are currently Bullish with a score of 68.6 percent. The commercials are Bearish with a score of 36.8 percent and the small traders (not shown in chart) are Bearish with a score of 41.0 percent.

Silver Futures StatisticsSPECULATORSCOMMERCIALSSMALL TRADERS
– Percent of Open Interest Longs:40.532.116.7
– Percent of Open Interest Shorts:13.369.26.8
– Net Position:46,429-63,28816,859
– Gross Longs:69,08854,71928,471
– Gross Shorts:22,659118,00711,612
– Long to Short Ratio:3.0 to 10.5 to 12.5 to 1
NET POSITION TREND:
– Strength Index Score (3 Year Range Pct):68.636.841.0
– Strength Index Reading (3 Year Range):BullishBearishBearish
NET POSITION MOVEMENT INDEX:
– 6-Week Change in Strength Index:-5.96.2-2.6


Copper Grade #1 Futures:

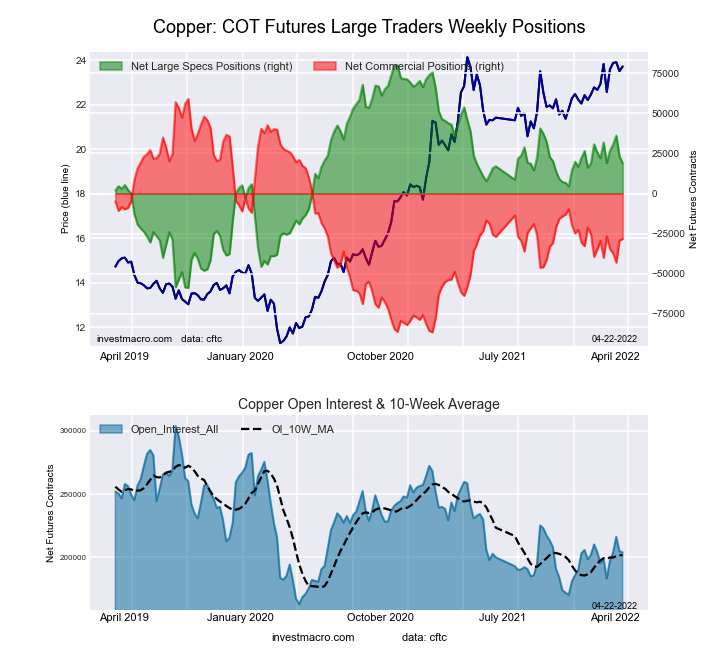
Copper Futures COT ChartThe Copper Grade #1 Futures large speculator standing this week was a net position of 18,840 contracts in the data reported through Tuesday. This was a weekly fall of -4,510 contracts from the previous week which had a total of 23,350 net contracts.

This week’s current strength score (the trader positioning range over the past three years, measured from 0 to 100) shows the speculators are currently Bullish with a score of 55.9 percent. The commercials are Bearish with a score of 40.0 percent and the small traders (not shown in chart) are Bullish-Extreme with a score of 80.0 percent.

Copper Futures StatisticsSPECULATORSCOMMERCIALSSMALL TRADERS
– Percent of Open Interest Longs:40.839.410.1
– Percent of Open Interest Shorts:31.653.35.4
– Net Position:18,840-28,3079,467
– Gross Longs:83,26180,28020,538
– Gross Shorts:64,421108,58711,071
– Long to Short Ratio:1.3 to 10.7 to 11.9 to 1
NET POSITION TREND:
– Strength Index Score (3 Year Range Pct):55.940.080.0
– Strength Index Reading (3 Year Range):BullishBearishBullish-Extreme
NET POSITION MOVEMENT INDEX:
– 6-Week Change in Strength Index:-9.38.17.0


Platinum Futures:

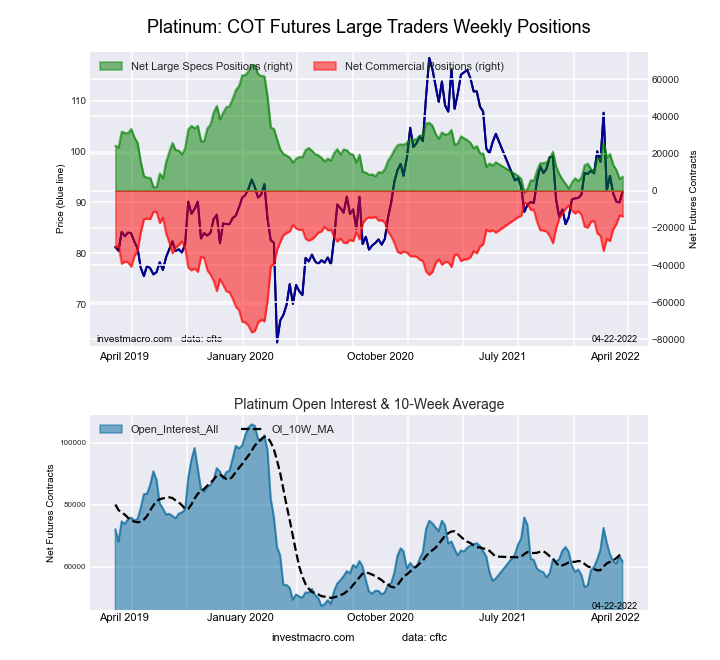
Platinum Futures COT ChartThe Platinum Futures large speculator standing this week was a net position of 7,537 contracts in the data reported through Tuesday. This was a weekly increase of 1,122 contracts from the previous week which had a total of 6,415 net contracts.

This week’s current strength score (the trader positioning range over the past three years, measured from 0 to 100) shows the speculators are currently Bearish-Extreme with a score of 12.5 percent. The commercials are Bullish-Extreme with a score of 89.3 percent and the small traders (not shown in chart) are Bearish with a score of 49.6 percent.

Platinum Futures StatisticsSPECULATORSCOMMERCIALSSMALL TRADERS
– Percent of Open Interest Longs:45.935.115.0
– Percent of Open Interest Shorts:33.757.54.8
– Net Position:7,537-13,8126,275
– Gross Longs:28,29321,6179,250
– Gross Shorts:20,75635,4292,975
– Long to Short Ratio:1.4 to 10.6 to 13.1 to 1
NET POSITION TREND:
– Strength Index Score (3 Year Range Pct):12.589.349.6
– Strength Index Reading (3 Year Range):Bearish-ExtremeBullish-ExtremeBearish
NET POSITION MOVEMENT INDEX:
– 6-Week Change in Strength Index:-26.626.6-3.5


Palladium Futures:

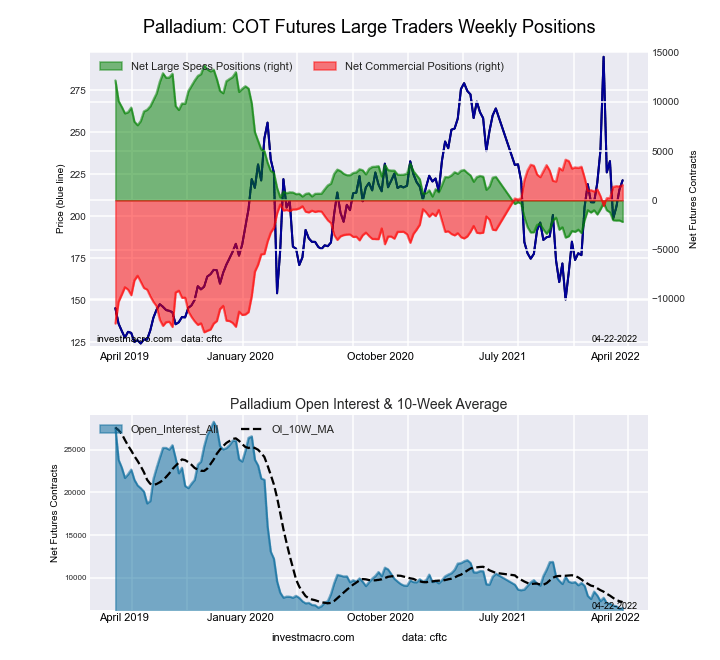
Palladium Futures COT ChartThe Palladium Futures large speculator standing this week was a net position of -2,182 contracts in the data reported through Tuesday. This was a weekly reduction of -149 contracts from the previous week which had a total of -2,033 net contracts.

This week’s current strength score (the trader positioning range over the past three years, measured from 0 to 100) shows the speculators are currently Bearish-Extreme with a score of 9.1 percent. The commercials are Bullish-Extreme with a score of 85.4 percent and the small traders (not shown in chart) are Bullish with a score of 79.9 percent.

Palladium Futures StatisticsSPECULATORSCOMMERCIALSSMALL TRADERS
– Percent of Open Interest Longs:22.955.521.0
– Percent of Open Interest Shorts:56.831.311.3
– Net Position:-2,1821,560622
– Gross Longs:1,4753,5731,349
– Gross Shorts:3,6572,013727
– Long to Short Ratio:0.4 to 11.8 to 11.9 to 1
NET POSITION TREND:
– Strength Index Score (3 Year Range Pct):9.185.479.9
– Strength Index Reading (3 Year Range):Bearish-ExtremeBullish-ExtremeBullish
NET POSITION MOVEMENT INDEX:
– 6-Week Change in Strength Index:-10.912.1-12.3


Article By InvestMacroReceive our weekly COT Reports by Email

*COT Report: The COT data, released weekly to the public each Friday, is updated through the most recent Tuesday (data is 3 days old) and shows a quick view of how large speculators or non-commercials (for-profit traders) were positioned in the futures markets.

The CFTC categorizes trader positions according to commercial hedgers (traders who use futures contracts for hedging as part of the business), non-commercials (large traders who speculate to realize trading profits) and nonreportable traders (usually small traders/speculators) as well as their open interest (contracts open in the market at time of reporting).See CFTC criteria here.
COT Soft Commodities Speculators raising bullish bets for Soybean Oil as prices hit record high

By InvestMacro | COT | Data Tables | COT Leaders | Downloads | COT Newsletter

Here are the latest charts and statistics for the Commitment of Traders (COT) data published by the Commodities Futures Trading Commission (CFTC).

The latest COT data is updated through Tuesday April 19th and shows a quick view of how large traders (for-profit speculators and commercial entities) were positioned in the futures markets.

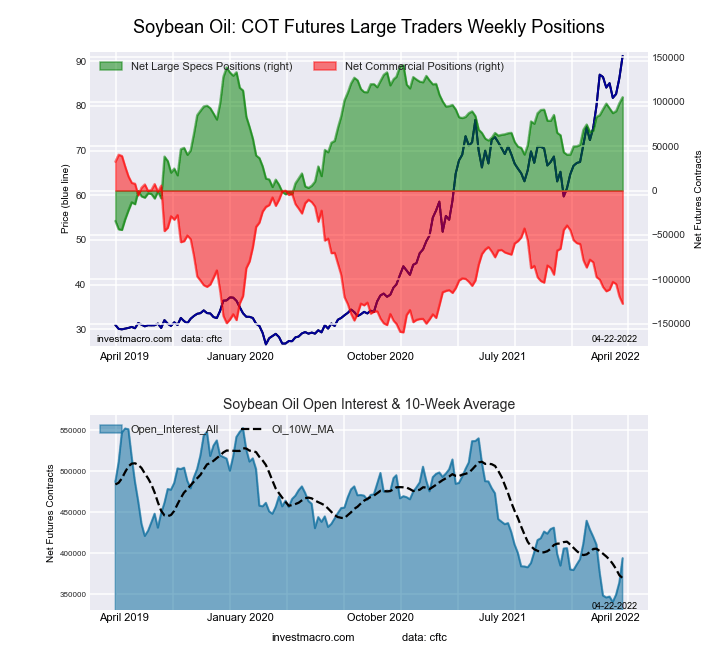
Highlighting the COT soft commodities data is the recent rises in Soybean Oil futures bets. The speculative net position in the Soybean Oil futures has gained for three straight weeks and has increased in eight out of the past ten weeks. Soybean Oil speculator positions have added a total of +39,176 contracts over the past ten weeks as well. This ascent in bullish bets has brought the current overall position to over +100,000 net contracts and to the highest level of the past fifty-six weeks, dating back to March 23rd of 2021.

Soybean Oil prices raced to a record high level at over $80 per pound this week and surpassed the previous price peaks of 2008 and 2021. The Soybean Oil prices have had a strong fundamental component driving it higher. The war in Ukraine has created a major disruption in Sunflower Oils (Ukraine and Russia are major suppliers) that has pushed the prices in alternative oils and other soft commodities sharply higher. Reuters news service also cited an Indonesia ban on exports of Palm Oil as having caused an even greater demand for alternative vegetable oils. The dreary outlook for vegetable oil production could mean we see even higher Soybean Oil prices.

Overall, the soft commodities that saw higher bets this week were Corn (5,031 contracts), Soybeans (1,803 contracts), Soybean Oil (6,887 contracts), Soybean Meal (6,498 contracts), Live Cattle (2,683 contracts), Lean Hogs (2,231 contracts) and Cotton (1,900 contracts).

The soft commodities that saw lower bets this week were Sugar (-349 contracts), Coffee (-6,126 contracts), Cocoa (-2,802 contracts) and Wheat (-641 contracts).


Data Snapshot of Commodity Market Traders | Columns Legend
Apr-19-2022OIOI-IndexSpec-NetSpec-IndexCom-NetCOM-IndexSmalls-NetSmalls-Index
WTI Crude1,740,3000307,6971-351,25210043,55576
Gold575,20240239,75760-275,5253735,76866
Silver170,5773546,42969-63,2883716,85941
Copper203,8962918,84056-28,307409,46780
Palladium6,4350-2,18291,5608562280
Platinum61,603247,53713-13,812896,27550
Natural Gas1,144,04714-130,0064082,1135747,893100
Brent191,88333-40,1024437,663562,43942
Heating Oil349,618316,45552-32,4343725,97988
Soybeans762,85536200,09880-174,87325-25,22528
Corn1,625,19842500,61294-456,2697-44,34318
Coffee209,410041,80379-45,447243,64415
Sugar909,62221239,51586-295,4701255,95577
Wheat337,038123,24567-20,42521-2,82098


CORN Futures:

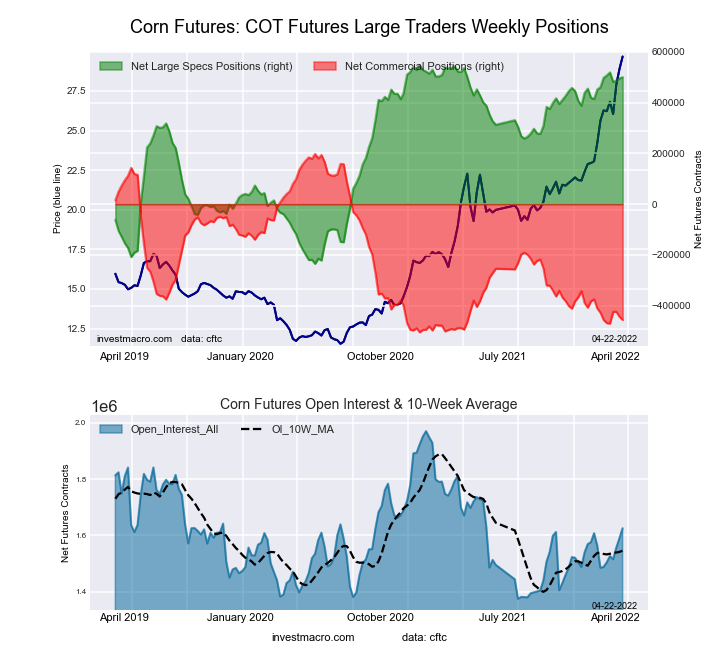
CORN Futures COT ChartThe CORN large speculator standing this week equaled a net position of 500,612 contracts in the data reported through Tuesday. This was a weekly lift of 5,031 contracts from the previous week which had a total of 495,581 net contracts.

This week’s current strength score (the trader positioning range over the past three years, measured from 0 to 100) shows the speculators are currently Bullish-Extreme with a score of 94.0 percent. The commercials are Bearish-Extreme with a score of 6.9 percent and the small traders (not shown in chart) are Bearish-Extreme with a score of 17.5 percent.

CORN Futures StatisticsSPECULATORSCOMMERCIALSSMALL TRADERS
– Percent of Open Interest Longs:36.145.09.4
– Percent of Open Interest Shorts:5.373.112.1
– Net Position:500,612-456,269-44,343
– Gross Longs:586,638731,004152,407
– Gross Shorts:86,0261,187,273196,750
– Long to Short Ratio:6.8 to 10.6 to 10.8 to 1
NET POSITION TREND:
– Strength Index Score (3 Year Range Pct):94.06.917.5
– Strength Index Reading (3 Year Range):Bullish-ExtremeBearish-ExtremeBearish-Extreme
NET POSITION MOVEMENT INDEX:
– 6-Week Change in Strength Index:0.30.1-1.7


SUGAR Futures:

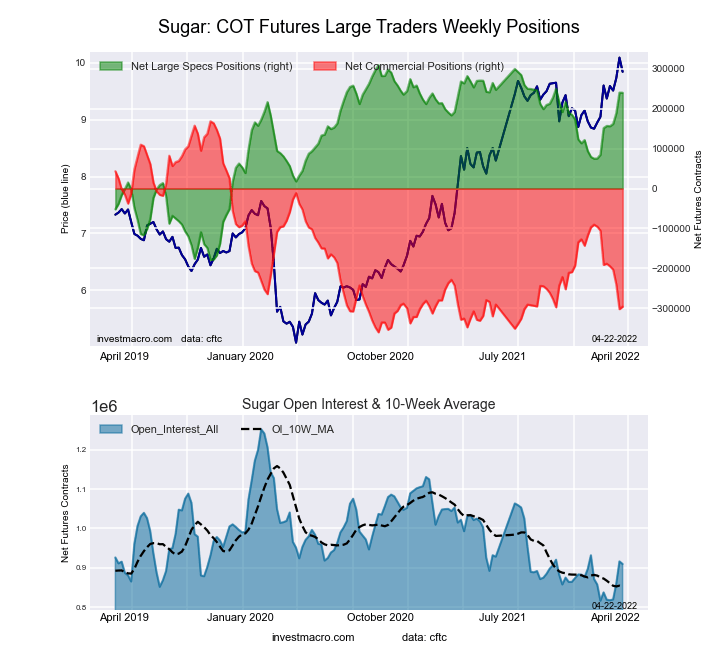
SUGAR Futures COT ChartThe SUGAR large speculator standing this week equaled a net position of 239,515 contracts in the data reported through Tuesday. This was a weekly decrease of -349 contracts from the previous week which had a total of 239,864 net contracts.

This week’s current strength score (the trader positioning range over the past three years, measured from 0 to 100) shows the speculators are currently Bullish-Extreme with a score of 85.8 percent. The commercials are Bearish-Extreme with a score of 12.1 percent and the small traders (not shown in chart) are Bullish with a score of 77.0 percent.

SUGAR Futures StatisticsSPECULATORSCOMMERCIALSSMALL TRADERS
– Percent of Open Interest Longs:32.644.211.6
– Percent of Open Interest Shorts:6.376.75.5
– Net Position:239,515-295,47055,955
– Gross Longs:296,437402,400105,565
– Gross Shorts:56,922697,87049,610
– Long to Short Ratio:5.2 to 10.6 to 12.1 to 1
NET POSITION TREND:
– Strength Index Score (3 Year Range Pct):85.812.177.0
– Strength Index Reading (3 Year Range):Bullish-ExtremeBearish-ExtremeBullish
NET POSITION MOVEMENT INDEX:
– 6-Week Change in Strength Index:18.2-19.820.0


COFFEE Futures:

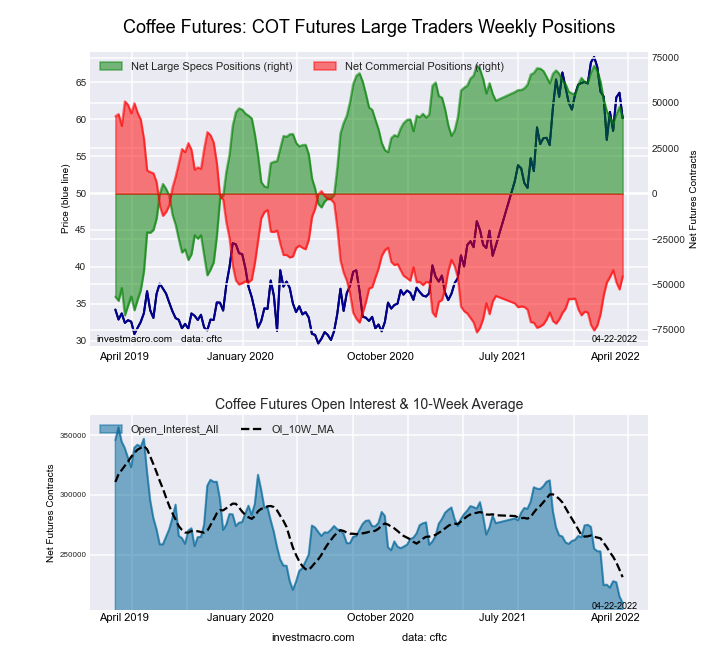
COFFEE Futures COT ChartThe COFFEE large speculator standing this week equaled a net position of 41,803 contracts in the data reported through Tuesday. This was a weekly fall of -6,126 contracts from the previous week which had a total of 47,929 net contracts.

This week’s current strength score (the trader positioning range over the past three years, measured from 0 to 100) shows the speculators are currently Bullish with a score of 78.5 percent. The commercials are Bearish with a score of 24.5 percent and the small traders (not shown in chart) are Bearish-Extreme with a score of 15.4 percent.

COFFEE Futures StatisticsSPECULATORSCOMMERCIALSSMALL TRADERS
– Percent of Open Interest Longs:25.553.84.7
– Percent of Open Interest Shorts:5.575.52.9
– Net Position:41,803-45,4473,644
– Gross Longs:53,423112,6169,760
– Gross Shorts:11,620158,0636,116
– Long to Short Ratio:4.6 to 10.7 to 11.6 to 1
NET POSITION TREND:
– Strength Index Score (3 Year Range Pct):78.524.515.4
– Strength Index Reading (3 Year Range):BullishBearishBearish-Extreme
NET POSITION MOVEMENT INDEX:
– 6-Week Change in Strength Index:-7.68.4-2.5


SOYBEANS Futures:

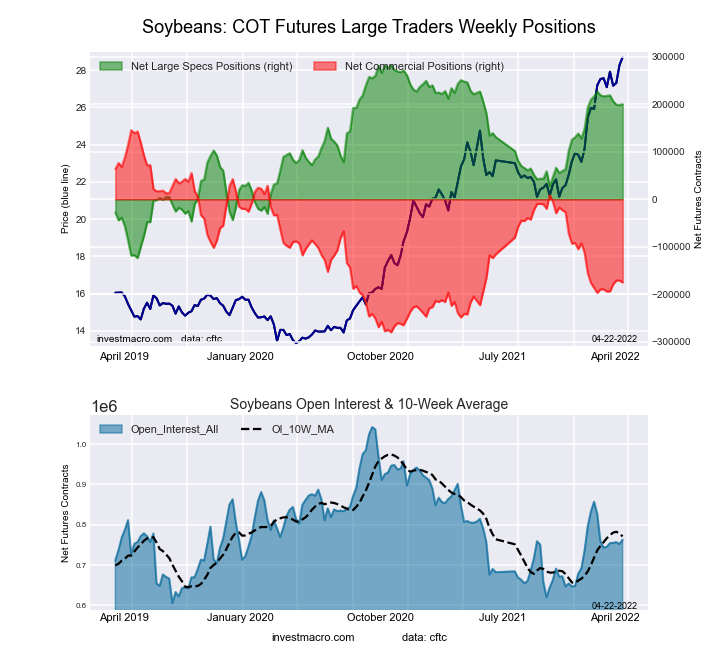
SOYBEANS Futures COT ChartThe SOYBEANS large speculator standing this week equaled a net position of 200,098 contracts in the data reported through Tuesday. This was a weekly boost of 1,803 contracts from the previous week which had a total of 198,295 net contracts.

This week’s current strength score (the trader positioning range over the past three years, measured from 0 to 100) shows the speculators are currently Bullish with a score of 79.8 percent. The commercials are Bearish with a score of 24.7 percent and the small traders (not shown in chart) are Bearish with a score of 28.4 percent.

SOYBEANS Futures StatisticsSPECULATORSCOMMERCIALSSMALL TRADERS
– Percent of Open Interest Longs:32.846.07.2
– Percent of Open Interest Shorts:6.669.010.5
– Net Position:200,098-174,873-25,225
– Gross Longs:250,566351,28655,231
– Gross Shorts:50,468526,15980,456
– Long to Short Ratio:5.0 to 10.7 to 10.7 to 1
NET POSITION TREND:
– Strength Index Score (3 Year Range Pct):79.824.728.4
– Strength Index Reading (3 Year Range):BullishBearishBearish
NET POSITION MOVEMENT INDEX:
– 6-Week Change in Strength Index:-4.13.43.6


SOYBEAN OIL Futures:

SOYBEAN OIL Futures COT ChartThe SOYBEAN OIL large speculator standing this week equaled a net position of 105,211 contracts in the data reported through Tuesday. This was a weekly lift of 6,887 contracts from the previous week which had a total of 98,324 net contracts.

This week’s current strength score (the trader positioning range over the past three years, measured from 0 to 100) shows the speculators are currently Bullish-Extreme with a score of 80.6 percent. The commercials are Bearish-Extreme with a score of 16.1 percent and the small traders (not shown in chart) are Bullish-Extreme with a score of 96.2 percent.

SOYBEAN OIL Futures StatisticsSPECULATORSCOMMERCIALSSMALL TRADERS
– Percent of Open Interest Longs:31.544.210.5
– Percent of Open Interest Shorts:4.876.54.9
– Net Position:105,211-127,39922,188
– Gross Longs:124,302174,16241,383
– Gross Shorts:19,091301,56119,195
– Long to Short Ratio:6.5 to 10.6 to 12.2 to 1
NET POSITION TREND:
– Strength Index Score (3 Year Range Pct):80.616.196.2
– Strength Index Reading (3 Year Range):Bullish-ExtremeBearish-ExtremeBullish-Extreme
NET POSITION MOVEMENT INDEX:
– 6-Week Change in Strength Index:7.3-9.520.0


SOYBEAN MEAL Futures:

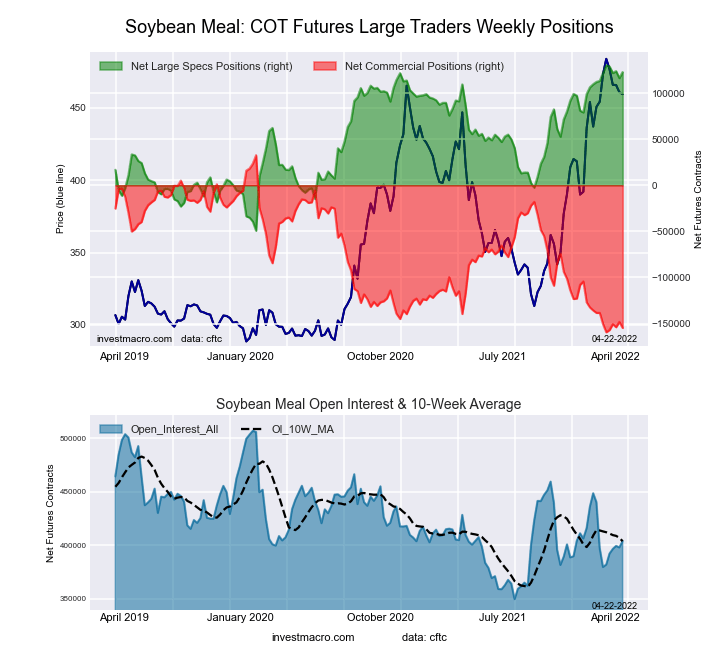
SOYBEAN MEAL Futures COT ChartThe SOYBEAN MEAL large speculator standing this week equaled a net position of 122,756 contracts in the data reported through Tuesday. This was a weekly boost of 6,498 contracts from the previous week which had a total of 116,258 net contracts.

This week’s current strength score (the trader positioning range over the past three years, measured from 0 to 100) shows the speculators are currently Bullish-Extreme with a score of 95.8 percent. The commercials are Bearish-Extreme with a score of 2.4 percent and the small traders (not shown in chart) are Bullish-Extreme with a score of 99.0 percent.

SOYBEAN MEAL Futures StatisticsSPECULATORSCOMMERCIALSSMALL TRADERS
– Percent of Open Interest Longs:33.542.413.1
– Percent of Open Interest Shorts:3.180.75.2
– Net Position:122,756-154,80132,045
– Gross Longs:135,397171,10752,874
– Gross Shorts:12,641325,90820,829
– Long to Short Ratio:10.7 to 10.5 to 12.5 to 1
NET POSITION TREND:
– Strength Index Score (3 Year Range Pct):95.82.499.0
– Strength Index Reading (3 Year Range):Bullish-ExtremeBearish-ExtremeBullish-Extreme
NET POSITION MOVEMENT INDEX:
– 6-Week Change in Strength Index:0.6-2.213.0


LIVE CATTLE Futures:

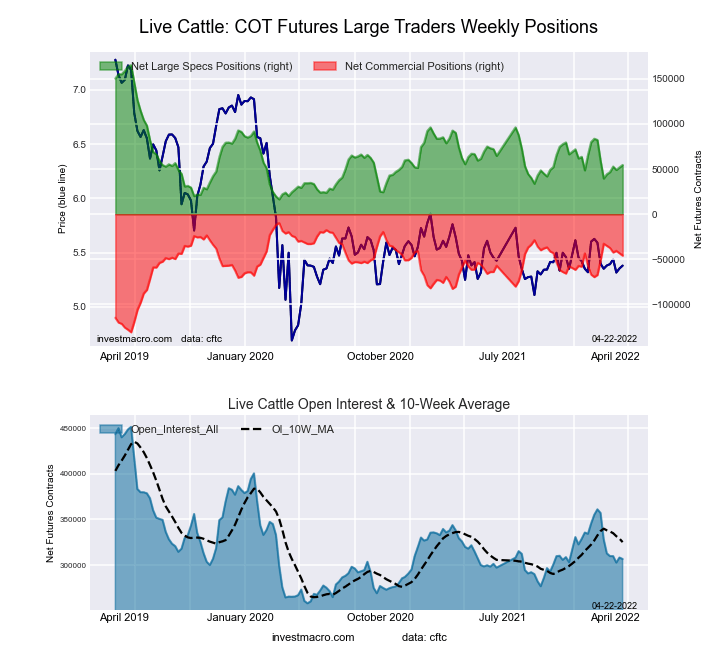
LIVE CATTLE Futures COT ChartThe LIVE CATTLE large speculator standing this week equaled a net position of 54,525 contracts in the data reported through Tuesday. This was a weekly lift of 2,683 contracts from the previous week which had a total of 51,842 net contracts.

This week’s current strength score (the trader positioning range over the past three years, measured from 0 to 100) shows the speculators are currently Bearish with a score of 29.5 percent. The commercials are Bullish with a score of 67.0 percent and the small traders (not shown in chart) are Bullish with a score of 56.0 percent.

LIVE CATTLE Futures StatisticsSPECULATORSCOMMERCIALSSMALL TRADERS
– Percent of Open Interest Longs:37.639.810.1
– Percent of Open Interest Shorts:19.854.812.9
– Net Position:54,525-45,886-8,639
– Gross Longs:115,285122,06530,955
– Gross Shorts:60,760167,95139,594
– Long to Short Ratio:1.9 to 10.7 to 10.8 to 1
NET POSITION TREND:
– Strength Index Score (3 Year Range Pct):29.567.056.0
– Strength Index Reading (3 Year Range):BearishBullishBullish
NET POSITION MOVEMENT INDEX:
– 6-Week Change in Strength Index:11.6-12.0-5.7


LEAN HOGS Futures:

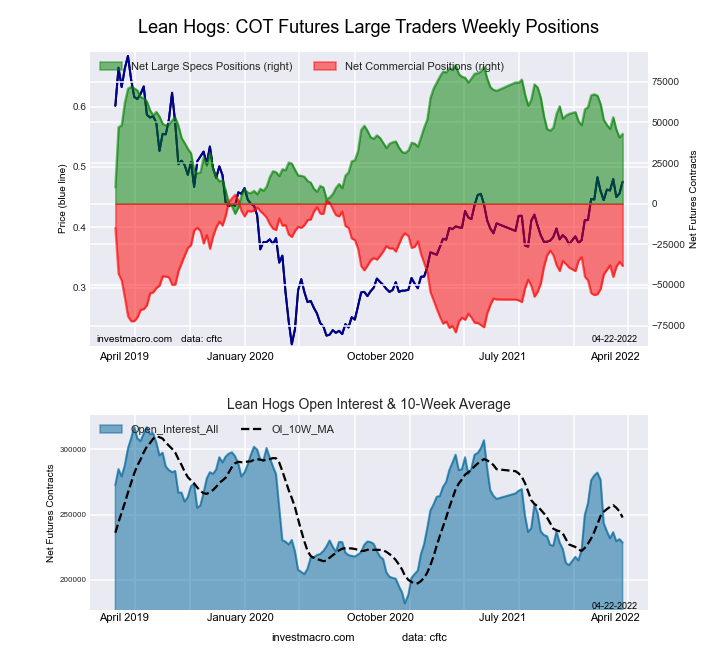
LEAN HOGS Futures COT ChartThe LEAN HOGS large speculator standing this week equaled a net position of 43,002 contracts in the data reported through Tuesday. This was a weekly increase of 2,231 contracts from the previous week which had a total of 40,771 net contracts.

This week’s current strength score (the trader positioning range over the past three years, measured from 0 to 100) shows the speculators are currently Bullish with a score of 53.6 percent. The commercials are Bearish with a score of 48.2 percent and the small traders (not shown in chart) are Bullish with a score of 69.8 percent.

LEAN HOGS Futures StatisticsSPECULATORSCOMMERCIALSSMALL TRADERS
– Percent of Open Interest Longs:36.434.410.7
– Percent of Open Interest Shorts:17.651.112.7
– Net Position:43,002-38,275-4,727
– Gross Longs:83,13378,60124,424
– Gross Shorts:40,131116,87629,151
– Long to Short Ratio:2.1 to 10.7 to 10.8 to 1
NET POSITION TREND:
– Strength Index Score (3 Year Range Pct):53.648.269.8
– Strength Index Reading (3 Year Range):BullishBearishBullish
NET POSITION MOVEMENT INDEX:
– 6-Week Change in Strength Index:-9.36.116.7


COTTON Futures:

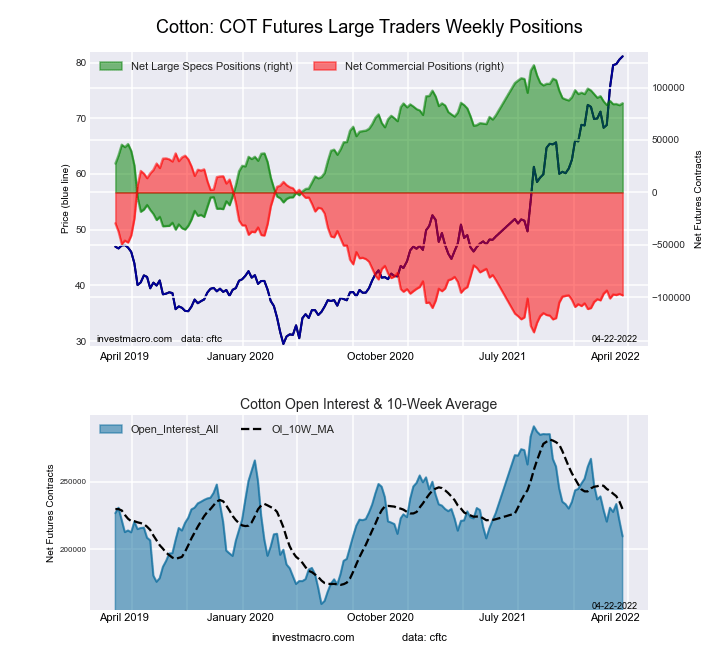
COTTON Futures COT ChartThe COTTON large speculator standing this week equaled a net position of 85,120 contracts in the data reported through Tuesday. This was a weekly gain of 1,900 contracts from the previous week which had a total of 83,220 net contracts.

This week’s current strength score (the trader positioning range over the past three years, measured from 0 to 100) shows the speculators are currently Bullish with a score of 76.9 percent. The commercials are Bearish with a score of 20.6 percent and the small traders (not shown in chart) are Bullish-Extreme with a score of 94.6 percent.

COTTON Futures StatisticsSPECULATORSCOMMERCIALSSMALL TRADERS
– Percent of Open Interest Longs:46.635.09.4
– Percent of Open Interest Shorts:6.081.83.1
– Net Position:85,120-98,10712,987
– Gross Longs:97,61373,29619,582
– Gross Shorts:12,493171,4036,595
– Long to Short Ratio:7.8 to 10.4 to 13.0 to 1
NET POSITION TREND:
– Strength Index Score (3 Year Range Pct):76.920.694.6
– Strength Index Reading (3 Year Range):BullishBearishBullish-Extreme
NET POSITION MOVEMENT INDEX:
– 6-Week Change in Strength Index:-1.1-1.020.9


COCOA Futures:

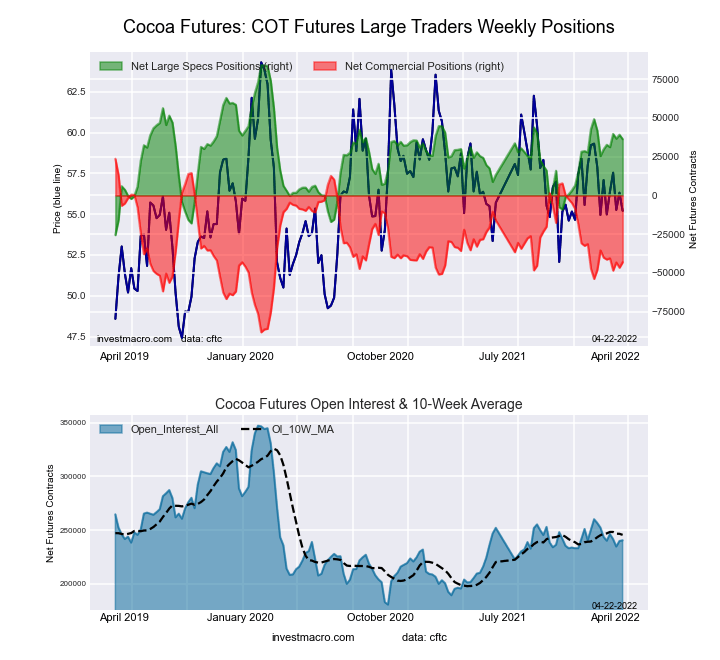
COCOA Futures COT ChartThe COCOA large speculator standing this week equaled a net position of 36,357 contracts in the data reported through Tuesday. This was a weekly reduction of -2,802 contracts from the previous week which had a total of 39,159 net contracts.

This week’s current strength score (the trader positioning range over the past three years, measured from 0 to 100) shows the speculators are currently Bullish with a score of 53.3 percent. The commercials are Bearish with a score of 44.0 percent and the small traders (not shown in chart) are Bullish with a score of 65.1 percent.

COCOA Futures StatisticsSPECULATORSCOMMERCIALSSMALL TRADERS
– Percent of Open Interest Longs:31.545.66.3
– Percent of Open Interest Shorts:16.463.53.5
– Net Position:36,357-43,0996,742
– Gross Longs:75,822109,53815,230
– Gross Shorts:39,465152,6378,488
– Long to Short Ratio:1.9 to 10.7 to 11.8 to 1
NET POSITION TREND:
– Strength Index Score (3 Year Range Pct):53.344.065.1
– Strength Index Reading (3 Year Range):BullishBearishBullish
NET POSITION MOVEMENT INDEX:
– 6-Week Change in Strength Index:6.5-2.9-34.9


WHEAT Futures:

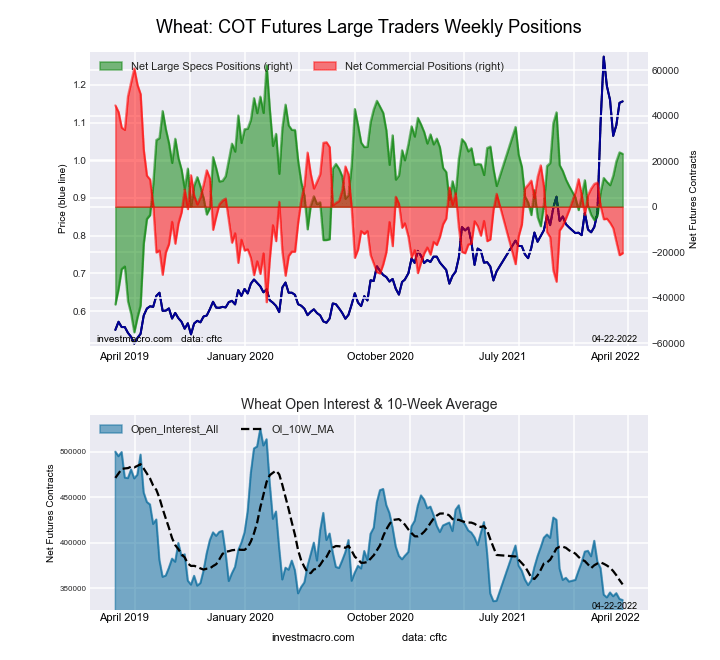
WHEAT Futures COT ChartThe WHEAT large speculator standing this week equaled a net position of 23,245 contracts in the data reported through Tuesday. This was a weekly fall of -641 contracts from the previous week which had a total of 23,886 net contracts.

This week’s current strength score (the trader positioning range over the past three years, measured from 0 to 100) shows the speculators are currently Bullish with a score of 66.8 percent. The commercials are Bearish with a score of 21.0 percent and the small traders (not shown in chart) are Bullish-Extreme with a score of 98.1 percent.

WHEAT Futures StatisticsSPECULATORSCOMMERCIALSSMALL TRADERS
– Percent of Open Interest Longs:36.037.69.5
– Percent of Open Interest Shorts:29.143.710.4
– Net Position:23,245-20,425-2,820
– Gross Longs:121,339126,76632,116
– Gross Shorts:98,094147,19134,936
– Long to Short Ratio:1.2 to 10.9 to 10.9 to 1
NET POSITION TREND:
– Strength Index Score (3 Year Range Pct):66.821.098.1
– Strength Index Reading (3 Year Range):BullishBearishBullish-Extreme
NET POSITION MOVEMENT INDEX:
– 6-Week Change in Strength Index:9.0-14.522.9


Article By InvestMacroReceive our weekly COT Reports by Email

*COT Report: The COT data, released weekly to the public each Friday, is updated through the most recent Tuesday (data is 3 days old) and shows a quick view of how large speculators or non-commercials (for-profit traders) were positioned in the futures markets.

The CFTC categorizes trader positions according to commercial hedgers (traders who use futures contracts for hedging as part of the business), non-commercials (large traders who speculate to realize trading profits) and nonreportable traders (usually small traders/speculators) as well as their open interest (contracts open in the market at time of reporting).See CFTC criteria here.
Week Ahead: Can USDJPY hit fresh 20-year high above 130?

By Han Tan Chief Market Analyst at Exinity Group

Shifting expectations for the next policy moves by major central banks remain a key theme across global financial markets, as investors and traders digest these major data releases and events in the week ahead:

Monday, April 25

  • EUR: Euro to react to Sunday’s French presidential election results
  • EUR: Germany April IFO business climate

Tuesday, April 26

  • JPY: Japan March unemployment
  • USD: US April consumer confidence
  • Alphabet Q1 earnings

Wednesday, April 27

  • AUD: Australia weekly consumer confidence, 1Q CPI
  • CNH: China March industrial profits
  • US crude: EIA weekly US crude inventories
  • Meta Platforms Q1 earnings

Thursday, April 28

  • JPY: Bank of Japan policy decision, March retail sales and industrial production
  • EUR: Germany April CPI, Eurozone April economic confidence, ECB economic bulletin
  • USD: US weekly initial jobless claims, 1Q GDP
  • Nasdaq 100: Amazon, Apple, Twitter Q1 earnings

Friday, April 29

  • EUR: Eurozone April CPI, 1Q GDP
  • USD: US March personal income and spending, PCE deflator, April consumer sentiment
  • Exxon Q1 earnings
  • Chevron Q1 earnings


The Bank of Japan is set to go into action, or rather the lack thereof, as the central bank is widely expected to stick to its ultra-loose monetary policy stance.

The BOJ has kept its policy rate floored at negative 0.1% and buying up even more bonds, which is in stark contrast to what other major central banks are doing (bar China). Most central banks around the world are already raising interest rates and starting to curb their bond purchases in an apparent race to quell skyrocketing inflation.

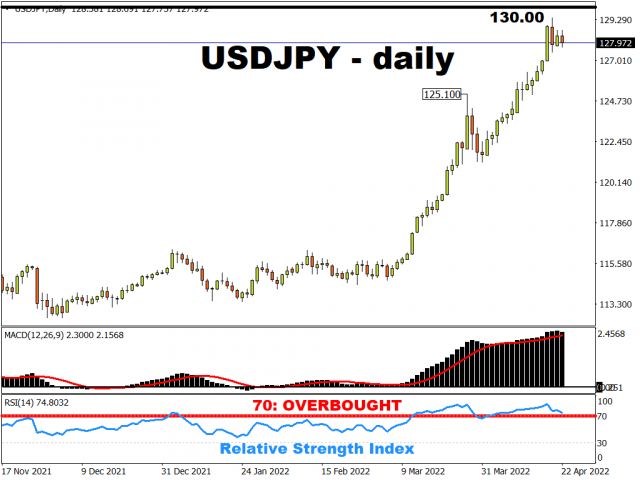
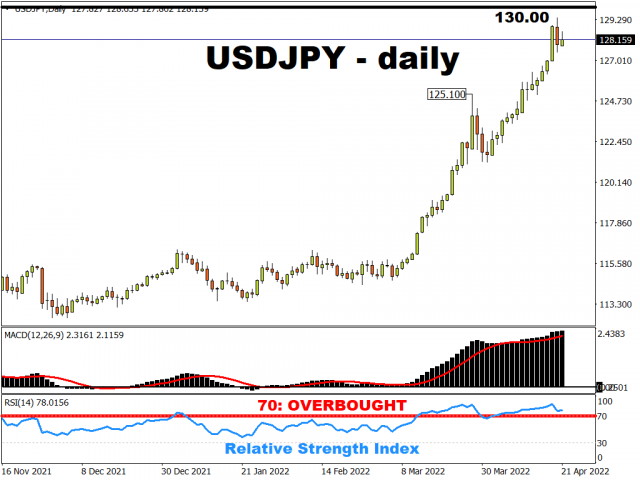
This policy divergence between the Fed and the BOJ in particular has sent USDJPY racing towards a 20-year high, closing in on the psychologically-important 130 mark.

Still, it’s ascent is on a breather at this point in time, with the 14-day relative strength index suggesting that the currency pair is trying to clear some of the froth and attempting to recover from overbought conditions.

READ MORE: Why is the Yen so weak?


Markets will be closely monitoring if BOJ Governor Haruhiko Kuroda will make any adjustments to policymakers’ stance on keeping bond yields capped at 0.25% and tolerating a weaker yen.

If the BOJ chief stays staunchly dovish, that could well pave the way for USDPJY to run towards its 2002 peak around 135. This climb could be further accentuated if the incoming GDP and PCE deflator data out of the US shows that the world’s largest economy could do with more Fed rate hikes – widening the policy divergence between the Fed and the BOJ.

However, any hints that a change in tack is forthcoming could translate into the unwinding of gains for USDJPY, potentially moving it closer to the previous cycle’s peak of 125.10.


French presidential election: Macron win could aid EURUSD recovery

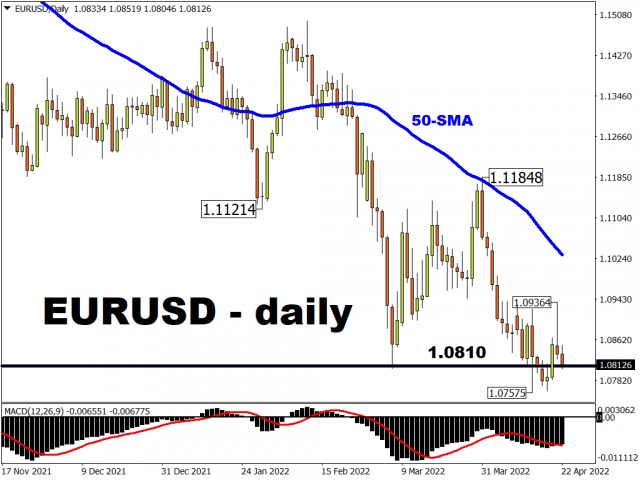
The euro recently resurfaced back above the 1.08 mark against the US dollar as markets return to their bets that the European Central will be forced to lean harder into its hawkish pivot.

Still, the recovery in the bloc currency proved fleeting, with EURUSD‘s downside bias still evident at the time of writing.

While the ECB policy outlook remains a major influence over the euro’s performance, traders and investors will also be digesting the results out of the presidential elections between incumbent Emmanuel Macron and nationalist challenger Marine Le Pen when markets reopen for the new trading week.

A win for Macron, which should ensure policy continuity amid a trying time for the Eurozone, could result in further relief for the euro.

However, a surprise Le Pen victory, which injects policy ambiguity into an already uncertain economic outlook in light of the still-raging war in the Ukraine, may drag EURUSD further below 1.08 as a knee-jerk risk-off reaction.


Big Tech earnings boost needed to stem losses for Nasdaq 100

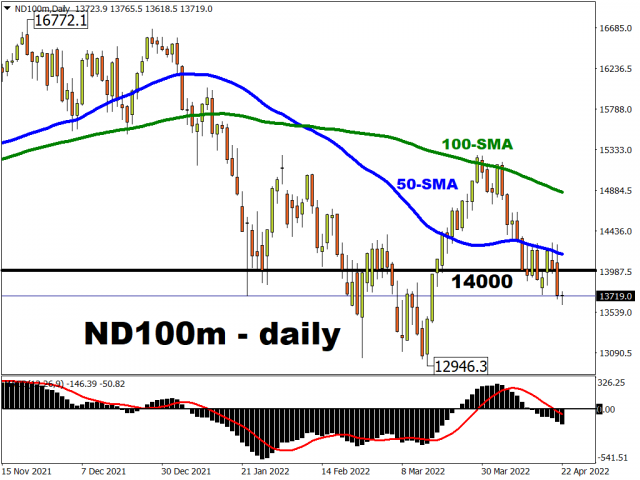
Surging US Treasury yields in recent months have earned the scorn of tech stocks, with the Nasdaq 100 dragged further below 14,000 this week.

The prospects of higher US interest rates and the accompanying rise in borrowing costs have soured the outlook for growth companies.

Having a year-to-date drop of almost 16% (before US markets open on Friday, 22 April), it’s up to illustrious names such as Amazon, Apple, Alphabet, Meta and Twitter to provide an earnings beat to shore up the declines in the Nasdaq 100 (though Twitter’s earnings call will likely be dominated by the latest developments surrounding the much-hyped takeover bid by Elon Musk).

Note that the 5 companies mentioned above have a combined market cap of more than US$6.4 trillion, which is almost 40% of the entire market cap of the Nasdaq 100.

In other words, those 5 companies carry a lot of heft that could move the entire index.

These Big Tech companies are expected to see decelerating growth last quarter, given the heightened competition and the tough comparisons with a stellar Q1 2021.

Still, any positive surprises out of these earnings calls (barring another shock move by Mr. Musk) could offer some relief for the Nasdaq 100, though the index is expected to remain capped by its 50-day simple moving average as the prospects of more incoming Fed rate hikes loom closer.


Disclaimer: The content in this article comprises personal opinions and should not be construed as containing personal and/or other investment advice and/or an offer of and/or solicitation for any transactions in financial instruments and/or a guarantee and/or prediction of future performance. ForexTime (FXTM), its affiliates, agents, directors, officers or employees do not guarantee the accuracy, validity, timeliness or completeness, of any information or data made available and assume no liability as to any loss arising from any investment based on the same.


Forex-Time-LogoArticle by ForexTime

ForexTime Ltd (FXTM) is an award winning international online forex broker regulated by CySEC 185/12 www.forextime.com

Forex Technical Analysis & Forecast 22.04.2022

Article By RoboForex.com

EURUSD, “Euro vs US Dollar”

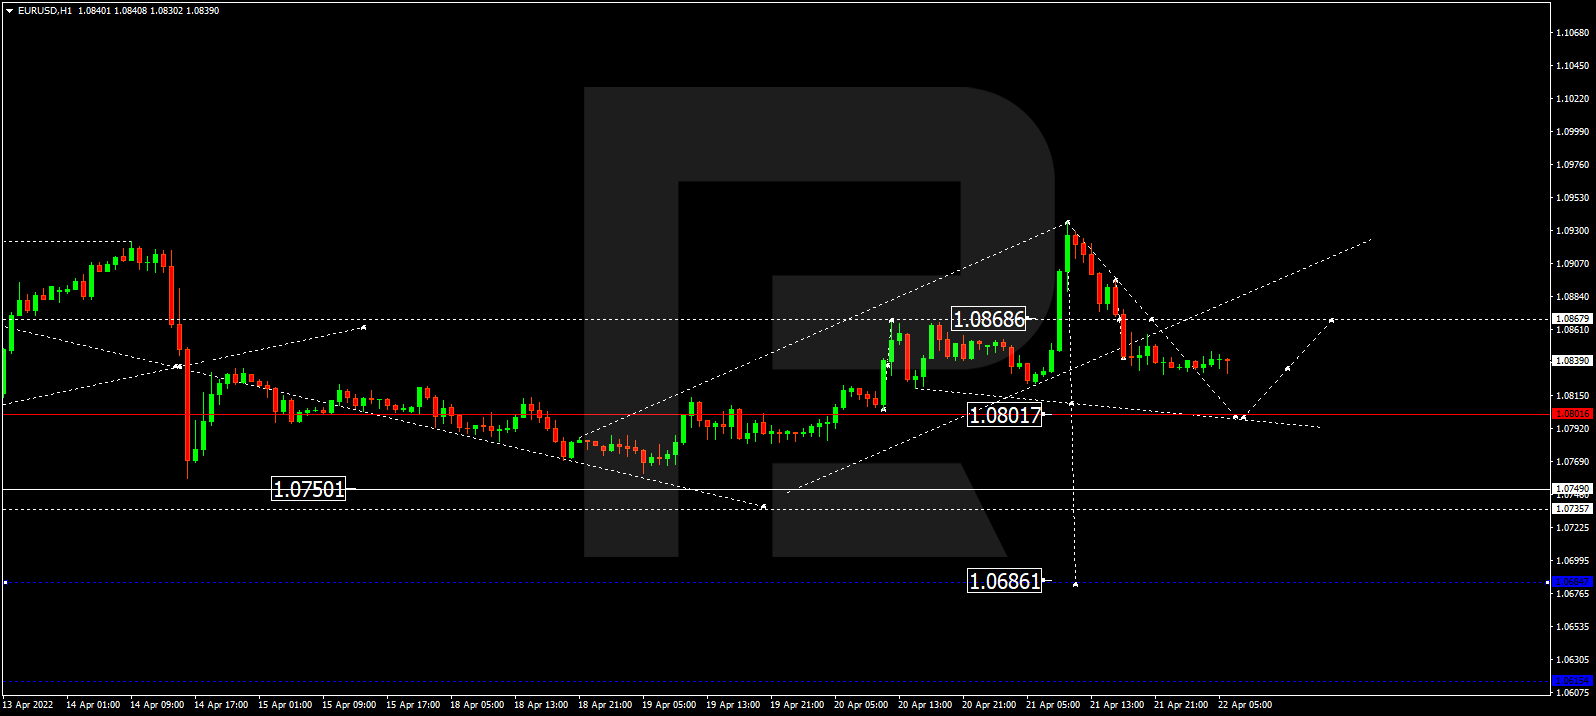
EURUSD has rebounded from 1.0930; right now, it is falling towards 1.0801. After that, the instrument may correct to reach 1.0866 and then start a new decline with the target at 1.0686.

EURUSD
Risk Warning: the result of previous trading operations do not guarantee the same results in the future

GBPUSD, “Great Britain Pound vs US Dollar”

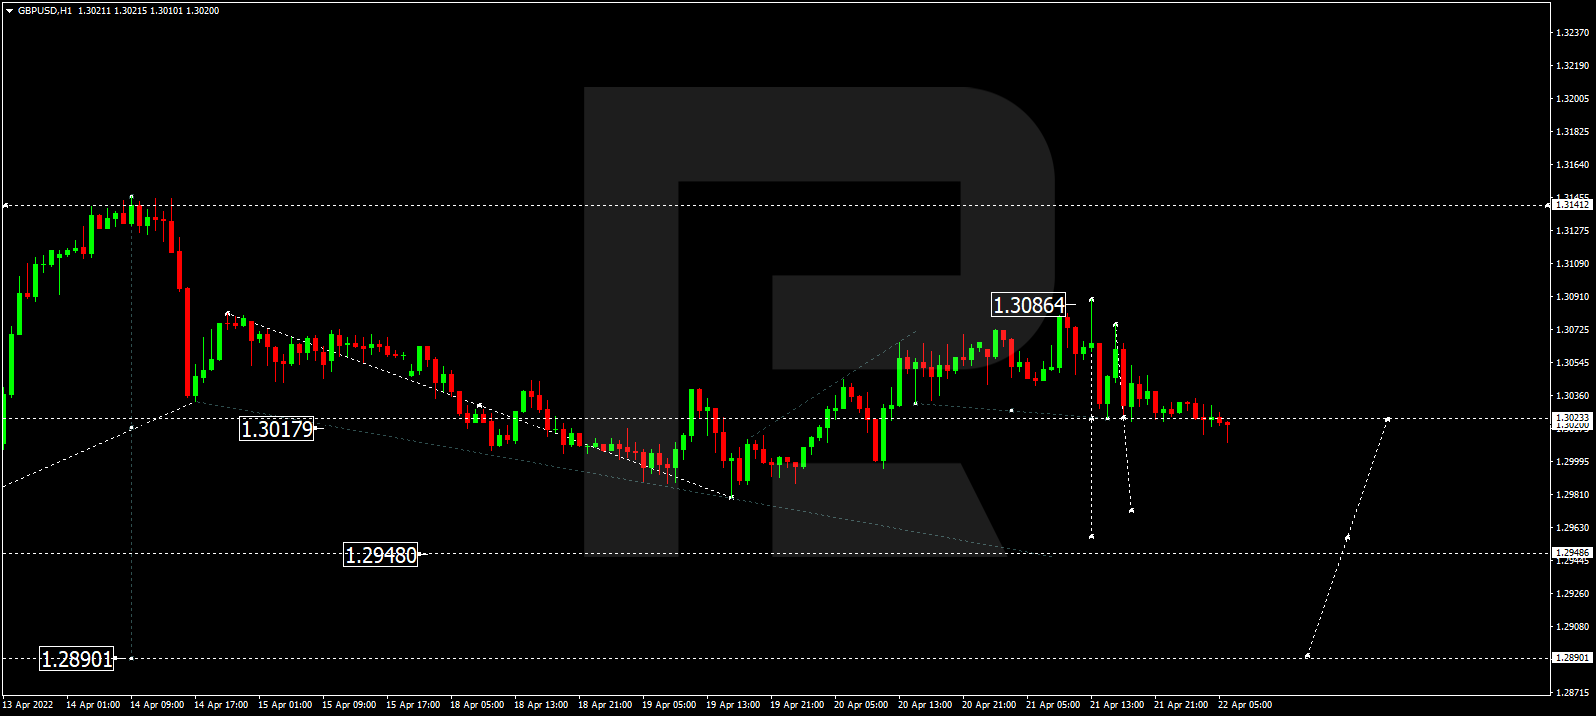
Having rebounded from 1.3086, GBPUSD is trading downwards to reach 1/2950. Later, the market may start a new correction towards 1.3022 and then resume falling with the target at 1.2930.

GBPUSD
Risk Warning: the result of previous trading operations do not guarantee the same results in the future

USDJPY, “US Dollar vs Japanese Yen”

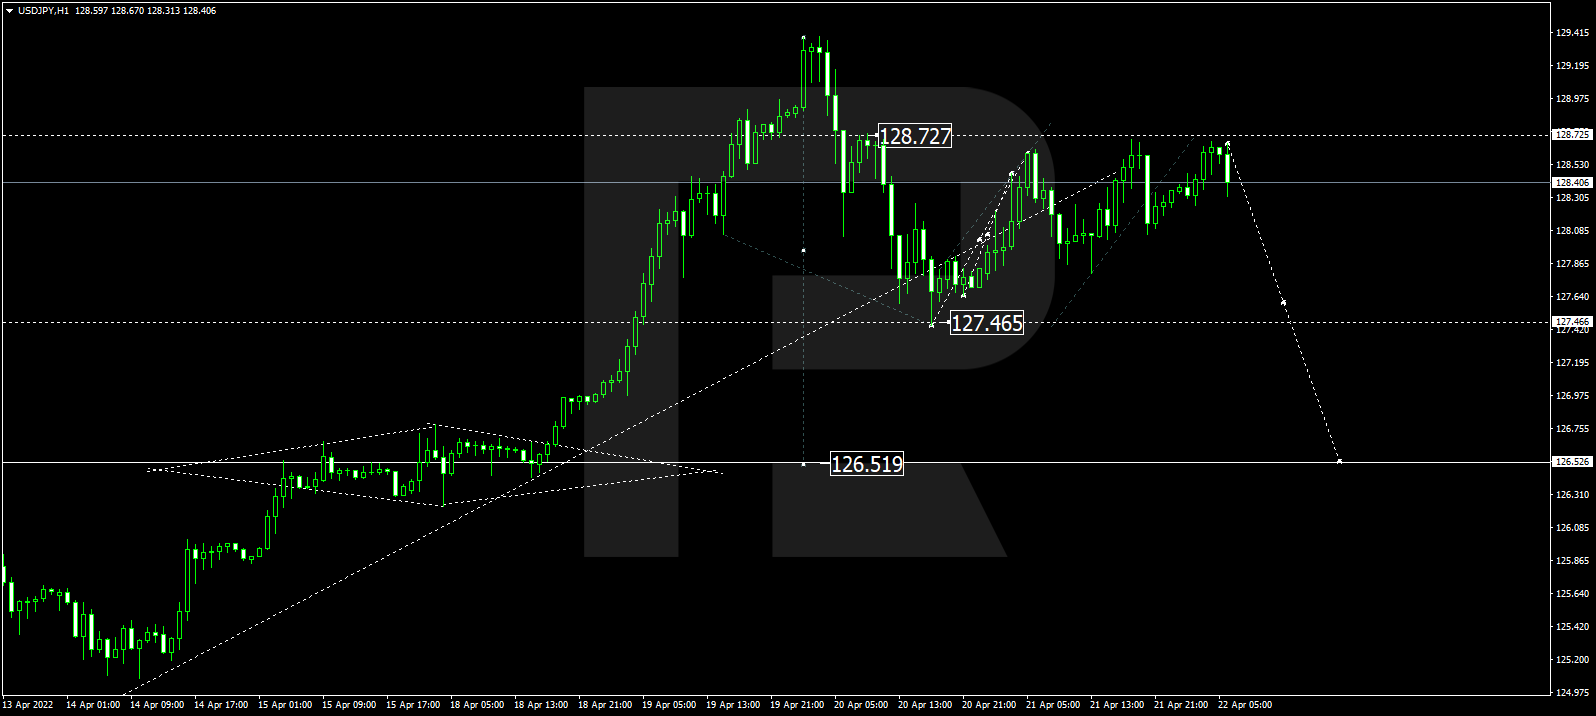
After finishing the correctional wave at 128.60, USDJPY is expected to consolidate below this level. Later, the market may break the range to the downside and start another decline with the target at 127.44.

USDJPY
Risk Warning: the result of previous trading operations do not guarantee the same results in the future

USDCHF, “US Dollar vs Swiss Franc”

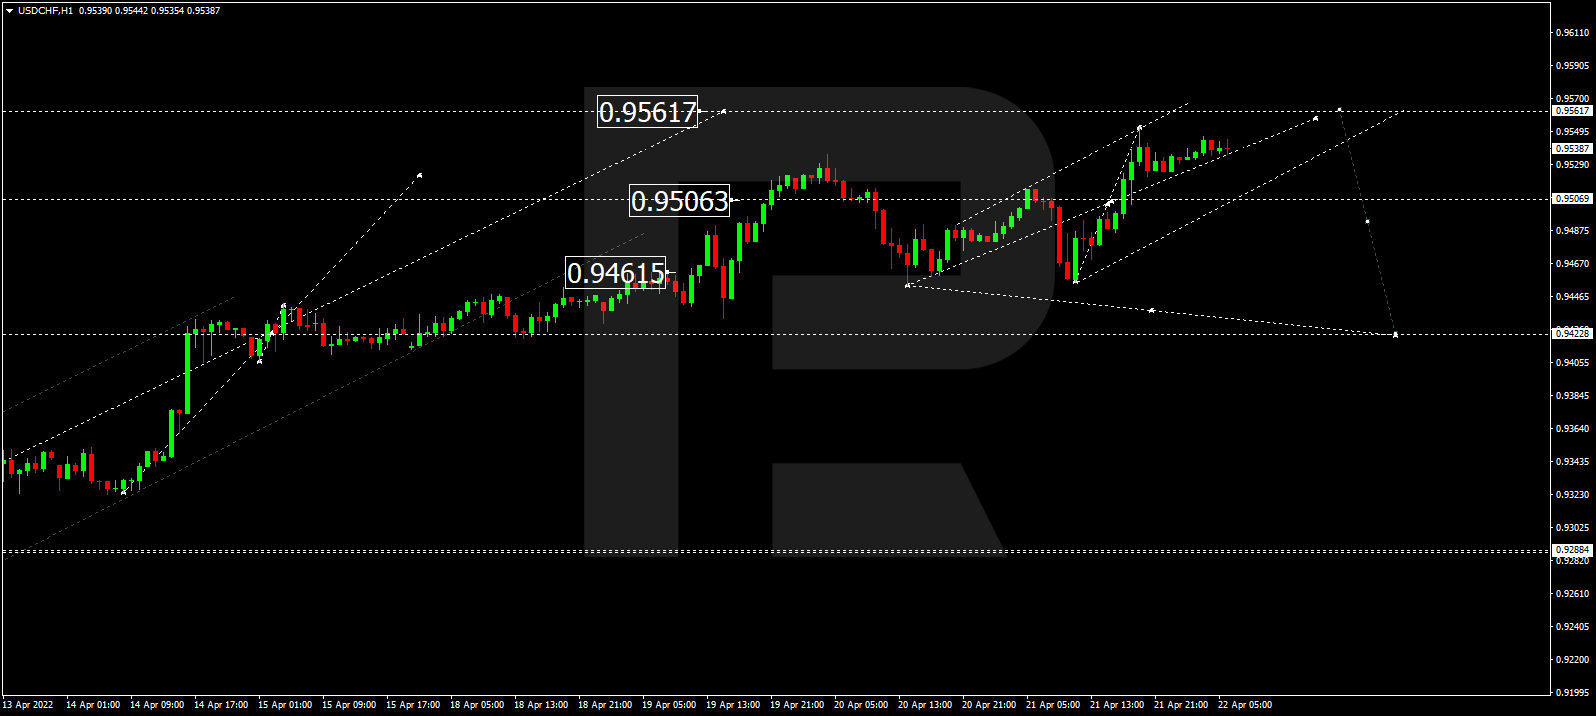
Having rebounded from 0.9457, USDCHF is growing towards 0.9560. After that, the instrument may start another correction with the target at 0.9422.

USDCHF
Risk Warning: the result of previous trading operations do not guarantee the same results in the future

AUDUSD, “Australian Dollar vs US Dollar”

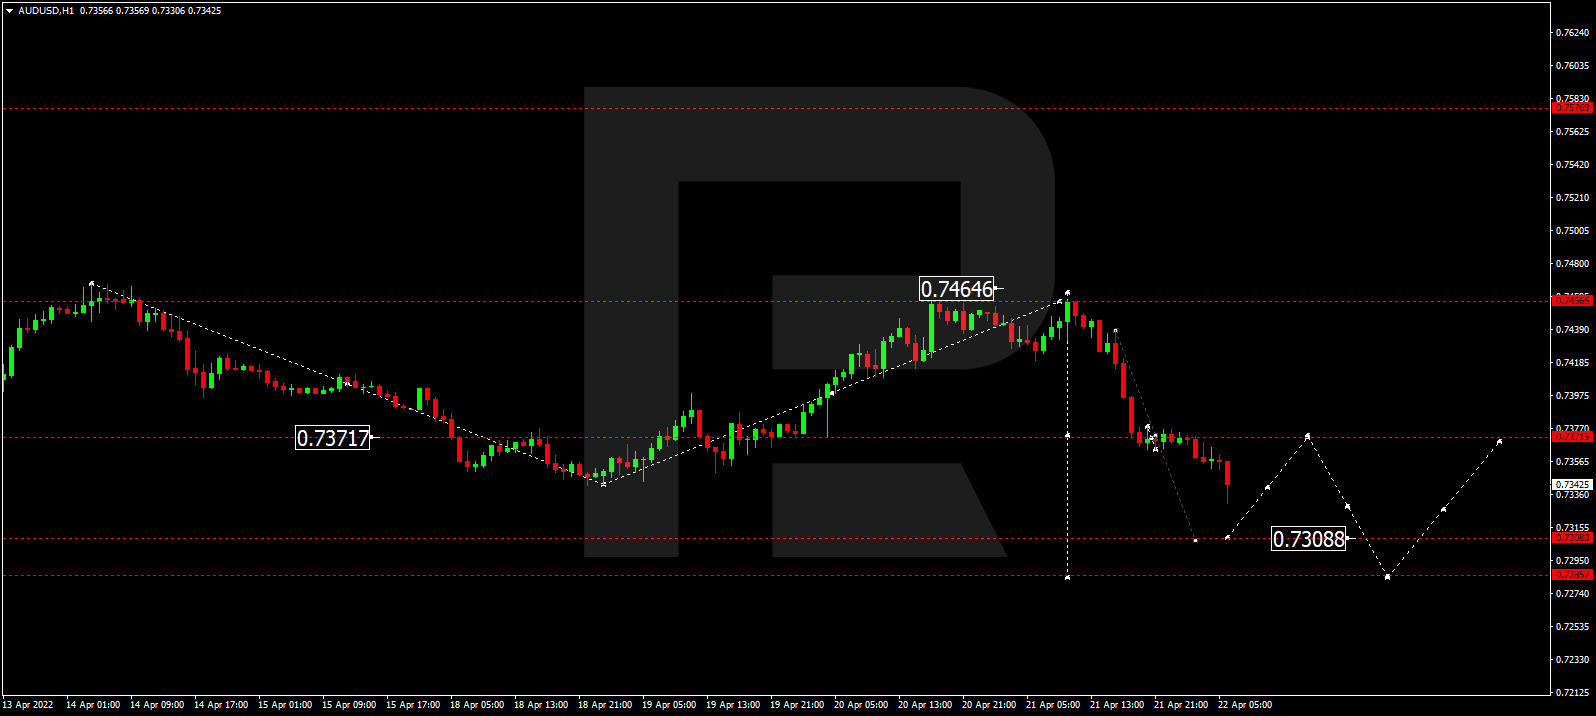
After completing the correctional wave at 0.7465 along with the descending structure towards 0.7373, AUDUSD has formed a new consolidation range there. Possibly, today the pair may break the range to the downside and resume moving downwards with the target at 0.7300.

AUDUSD
Risk Warning: the result of previous trading operations do not guarantee the same results in the future

BRENT

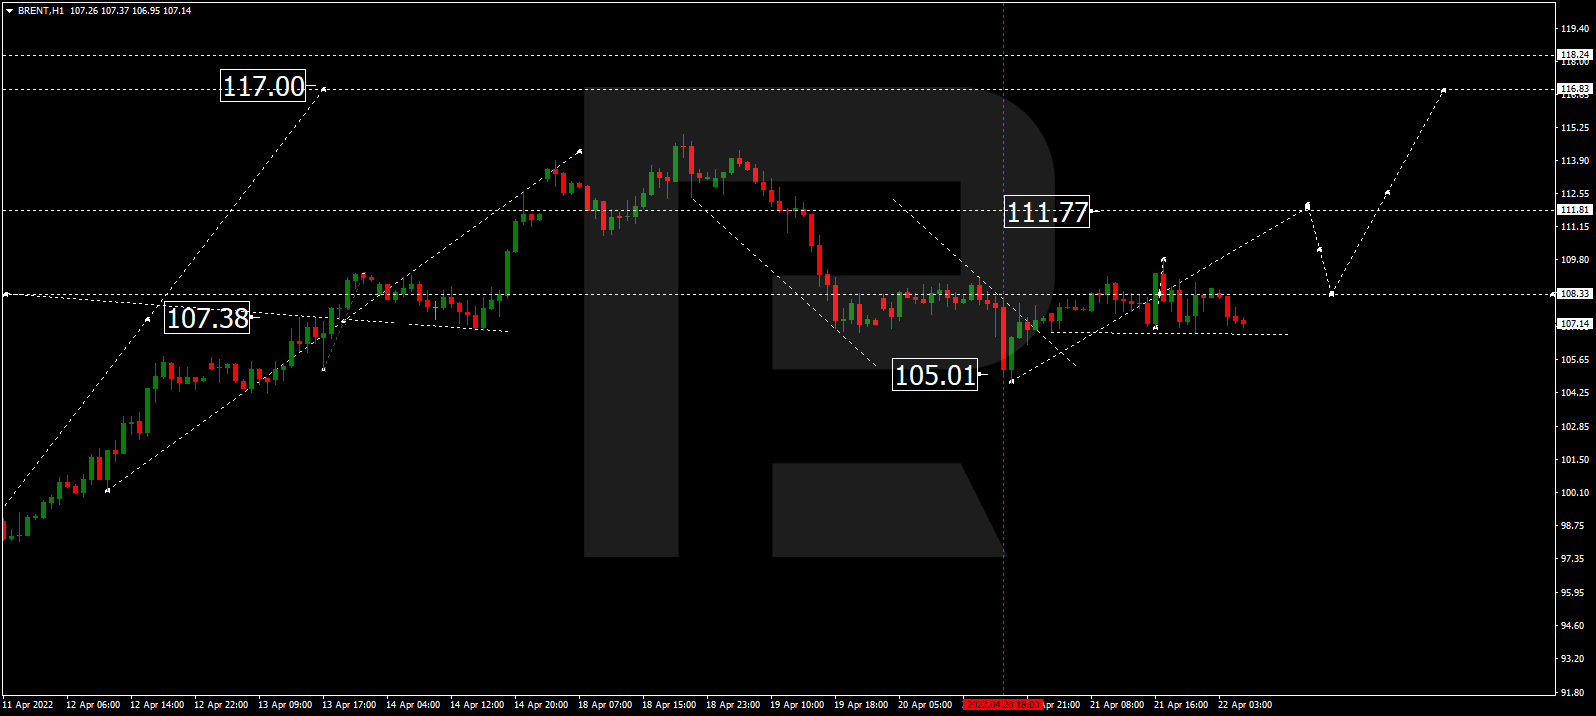
After forming a new consolidation range around 108.33, Brent is expected to break it upwards and form one more ascending wave to reach 111.77. Later, the market may correct towards 108.55 and then resume moving within the uptrend with the target at 117.00.

BRENT
Risk Warning: the result of previous trading operations do not guarantee the same results in the future

XAUUSD, “Gold vs US Dollar”

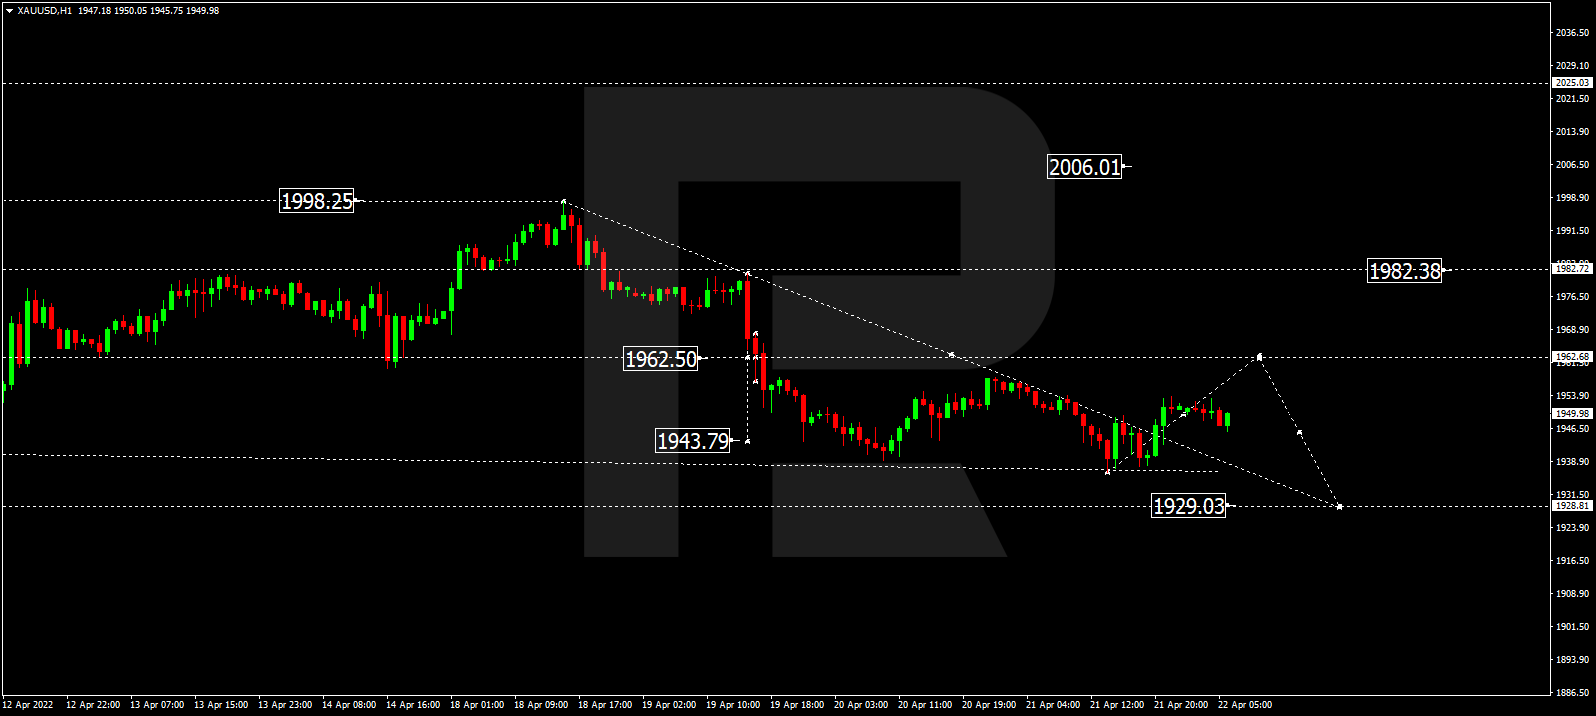
Gold has completed the correctional wave at 1936.40; right now, it is consolidating above this level. If later the price breaks this range to the upside, the market may start another growth towards 1962.68 and then form a new descending structure to reach 1929.00. After that, the instrument may resume trading upwards with the target at 2025.00.

GOLD
Risk Warning: the result of previous trading operations do not guarantee the same results in the future

S&P 500

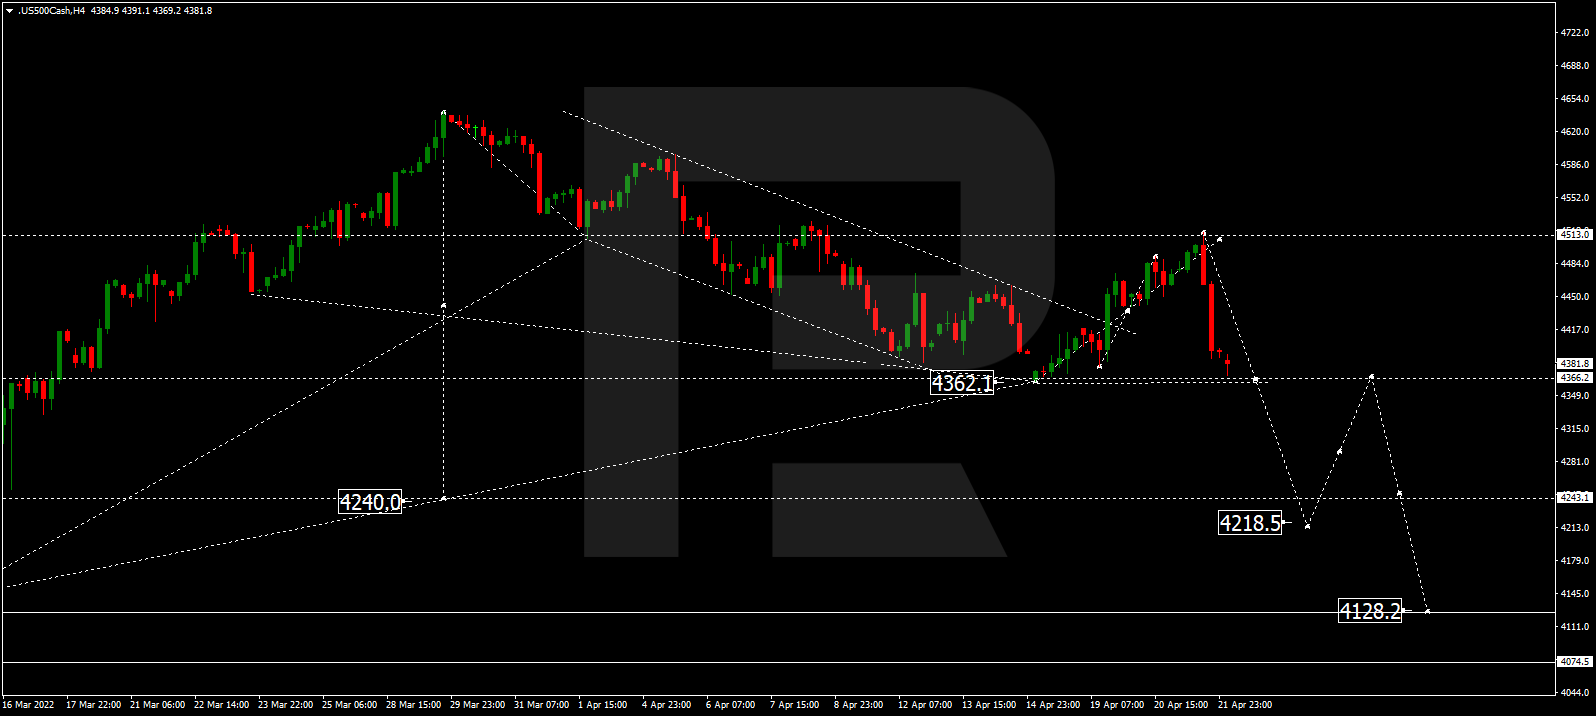
Having rebounded from 4513.0 and finished the descending wave at 4363.0, the S&P index is consolidating above this level. Possibly, the asset may break the range to the downside and resume trading downwards with the target at 4220.0 or even extend this structure down to 4139.0.

S&P 500

Article By RoboForex.com

Attention!
Forecasts presented in this section only reflect the author’s private opinion and should not be considered as guidance for trading. RoboForex LP bears no responsibility for trading results based on trading recommendations described in these analytical reviews.

The cryptocurrency market digest (BTC). Overview for 22.04.2022

Article By RoboForex.com

Not too much good news from the BTC. On Friday, the major cryptocurrency is trading at $40,492 and remains under pressure for the third consecutive trading session.

Negative vibes are coming from the stock markets – yesterday American investors were selling and the overall situation was rather sad. The US Fed is ready to boost its monetary policy tightening and market players are expecting the regulator to raise the interest rate in May by 50 basis points or even more.

Attempts of stock bulls to break the downtrend didn’t get anywhere – they didn’t stand a chance. The downtrend in the NASDAQ, which has a strong correlation with the BTC, proves that bears now have an advantage.

If so, the “local growth” scenario is off. One should monitor $37,000 as bears will definitely try to attack it. However, if the miracle happens and the BTC closes the week above $41,200, there will be opportunities to capture the moment.

Algorand: carbon-free smart contracts

Algorand announced its intentions to start smart contracts that can offset minimal carbon emissions. The system will charge fees for transactions and use them to buy carbon contracts. What for? Because being environmentally responsible is trending in today’s civilized world.

Binance US: a path to Puerto Rico

Binance US got a licence for performing financial transactions in Puerto Rico. This country is one of the global cryptocurrency centres and the opportunity to get there was a matter of honour. Binance can offer access to a great number of tokens and count on the client base growth, although the company might have to fight for users.

Article By RoboForex.com

Attention!
Forecasts presented in this section only reflect the author’s private opinion and should not be considered as guidance for trading. RoboForex LP bears no responsibility for trading results based on trading recommendations described in these analytical reviews.

The Analytical Overview of the Main Currency Pairs on 2022.04.22

by JustForex

The EUR/USD currency pair

Technical indicators of the currency pair:
  • Prev Open: 1.0847
  • Prev Close: 1.0831
  • % chg. over the last day: -0.15%

The annual consumer price index in Europe unexpectedly declined in April from 7.5% to 7.4%. At the same time, the core inflation rate, which excludes food and energy prices, fell from 3.0% to 2.9%. The euro jumped sharply yesterday on this data. But after Jerome Powell’s speech, the euro fell again. Analysts believe that the ongoing war in Ukraine will continue to cause energy and food prices to rise, which will eventually lead to higher inflation in the region. European Central Bank President Christine Lagarde said the ECB may have to cut its growth forecast even further as the effects of Russia’s invasion of Ukraine take a toll on households and businesses.

Trading recommendations
  • Support levels: 1.0835, 1.0800, 1.0772
  • Resistance levels: 1.0870, 1.0907, 1.0958, 1.1027, 1.1196, 1.1291

From the technical point of view, EUR/USD currency pair trend on the hourly time frame is bearish. But against the backdrop of a decrease in the rate of inflation, buyers of the European currency appeared. The MACD indicator has become inactive. Under such market conditions, it is possible consider buy trades on intraday timeframes from the support level of 1.0800, but only with short targets and confirmation. Sell trades should be considered from the resistance level of 1.0870 or 1.0907, but only after the additional confirmation.

Alternative scenario: if the price breaks out through the 1.0958 resistance level and fixes above, the uptrend will likely resume.

EUR/USD
News feed for 2022.04.22:
  • – German Manufacturing PMI (m/m) at 10:30 (GMT+3);
  • – Eurozone Manufacturing PMI (m/m) at 11:00 (GMT+3);
  • – Eurozone ECB President Lagarde Speaks at 16:00 (GMT+3);
  • – US Manufacturing PMI (m/m) at 16:45 (GMT+3).

The GBP/USD currency pair

Technical indicators of the currency pair:
  • Prev Open: 1.3049
  • Prev Close: 1.3026
  • % chg. over the last day: -0.17%

According to Bank of England Governor Andrew Bailey, governments should be prepared to accept economic hardship as payment for forcing Russia to end the war in Ukraine. Skyrocketing energy prices and supply chain problems since the war began in February are exacerbating declining incomes and threatening the deepest cost-of-living crisis in Britain since the 1950s. According to Bailey, the Bank of England is balancing between fighting inflation and preventing economic growth from falling. The governor also expressed concern about rising food prices and wondered if the UK labor market would slow in the event of a recession, as staff shortages are still very acute.

Trading recommendations
  • Support levels: 1.3011, 1.2993
  • Resistance levels: 1.3094, 1.3115, 1.3147, 1.3244, 1.3274

On the hourly time frame, the GBP/USD currency pair trend is still bearish. The MACD indicator has become inactive, the price pullback to the moving averages. Under such market conditions, sell trades should be looked for from the resistance level of 1.3094, but with confirmation. For buy deals, traders may consider the level of 1.3011, but only after the appearance of a bullish initiative and with short targets.

Alternative scenario: if the price breaks down through the 1.3147 resistance level and fixes above, the mid-term uptrend will likely be resumed.

GBP/USD
News feed for 2022.04.22:
  • – UK Retail Sales (m/m) at 09:00 (GMT+3);
  • – UK Manufacturing PMI (m/m) at 11:30 (GMT+3);
  • – UK BoE Gov Bailey Speaks at 17:30 (GMT+3).

The USD/JPY currency pair

Technical indicators of the currency pair:
  • Prev Open: 127.93
  • Prev Close: 128.38
  • % chg. over the last day: +0.35%

Japan’s nationwide consumer price index was 0.8% y/y (previous 0.6%). The ultra-soft policy of the Bank of Japan contributes to the growth of inflation towards the target of 2%, but the growth rate is extremely low. At the moment many analysts believe that a sharp decline in the yen will have a far more negative impact on the economy than the country’s low inflation rate. The Bank of Japan on Wednesday entered the government bond market and carried out a number of operations to prevent the yield from rising above the 0.1% mark. Thus, a technical correction in USD/JPY can be expected in the near future.

Trading recommendations
  • Support levels: 126.69, 125.72, 124.66, 124.24, 122.97, 122.63, 121.81
  • Resistance levels: 128.84, 129.36

The medium-term trend on the USD/JPY currency pair is bullish. The MACD indicator has become inactive, but the divergence is still visible on the higher timeframes. The price is trading in a narrow corridor. Under such market conditions, it is best to look for buy deals, expecting the continuation of the uptrend, but after the price makes a pullback to the average lines and the nearest support levels. First of all, it is worth considering the support level of 126.69, but with additional confirmation. A resistance level of 128.84 may be considered for sell deals, but only with short targets.

Alternative scenario: If the price fixes below 124.66, the uptrend will likely be broken.

USD/JPY
News feed for 2022.04.22:
  • – Japan National Core Consumer Price Index at 02:30 (GMT+3).

The USD/CAD currency pair

Technical indicators of the currency pair:
  • Prev Open: 1.2498
  • Prev Close: 1.2582
  • % chg. over the last day: +0.67%

The Canadian dollar is a commodity currency, and is highly dependent on the dynamics of oil prices and the dollar index. The dollar index jumped sharply yesterday in the background of the statements of the Federal Reserve System officials, while oil prices remained at the same level. As a result, the USD/CAD currency pair rose sharply. At the moment, there are no fundamental prerequisites for a medium-term trend.

Trading recommendations
  • Support levels: 1.2509, 1.2467
  • Resistance levels: 1.2600, 1.2644, 1.2713, 1.2754, 1.2851

The USD/CAD currency pair is bullish in terms of technical analysis. The price rebounded sharply from the priority change level, the buyers defended their positions. The MACD indicator has become positive, with no signs of reversal. Trade is worth it only with short targets. Under such market conditions, it is better to look for buy trades on the lower timeframes from the support level of 1.2509, but it is better with additional confirmation. For sell deals, it is better to consider the resistance level of 1.2600 or 1.2645, but it is also better with confirmation.

Alternative scenario: if the price breaks through and consolidates below 1.2467, the downtrend will likely be resumed.

USD/CAD
News feed for 2022.04.22:
  • – Canada Retail Sales (m/m) at 15:30 (GMT+3).

by JustForex


This article reflects a personal opinion and should not be interpreted as an investment advice, and/or offer, and/or a persistent request for carrying out financial transactions, and/or a guarantee, and/or a forecast of future events.

Aggressive FED policy forces investors to sell stocks

by JustForex

The US stock indices opened yesterday with gains thanks to corporate earnings and strong unemployment data but began to decline in anticipation of statements by Federal Reserve Chairman Jerome Powell. Powell confirmed a 0.5% interest rate hike at next month’s policy meeting. Growing fears over increasingly aggressive FED policy have hit Treasuries, especially in the short term, leading to a stock sell-off at the end of the day. As the stock market closed yesterday, the Dow Jones index (US30) decreased by 1.05% and the S&P 500 index (US500) lost 1.48%. The NASDAQ Technology Index (US100) fell by 2.07%.

The Snap company forecast bright prospects for user growth on Thursday but said supply chain disruptions and high inflation could further dampen demand for advertising.

The main European indices were mainly rising yesterday. Germany’s DAX (DE30) gained 0.98%, France’s CAC 40 (FR 40) jumped by 1.36%, Spain’s IBEX 35 (ES35) added 0.51%, and Britain’s FTSE 100 (UK100) fell by 0.02%. The annual consumer price index in Europe decreased unexpectedly in April from 7.5% to 7.4%. At the same time, the core inflation rate, which excludes food and energy prices, declined from 3.0% to 2.9%. European Central Bank President Christine Lagarde said the ECB may have to cut its growth forecast even further as the effects of Russia’s invasion of Ukraine take a toll on households and businesses. Joachim Nagel, president of Germany’s Bundesbank said the ECB may raise interest rates early in the third quarter. UK retail sales fell for the third time in the past four months as the cost of living crisis further hit consumer confidence.

French President Emmanuel Macron gave an excellent performance in the televised debate against the right-wing candidate Marine Le Pen. The second round of presidential elections in France will be held this Sunday. Analysts predict the victory of the incumbent president.

The oil prices were falling in the previous sessions mainly because the IMF reduced the estimates of the global economic growth in 2022/23 and concerns about the growth of mortality from Covid in China, the second-biggest oil consumer in the world. But yesterday, oil prices started rising again as concerns about a possible European Union ban on Russian oil came to the fore.

The US oil company ExxonMobil is considering completely shutting down its operations in Russia by June 24. In March ExxonMobil announced plans to withdraw from the Sakhalin-1 project.

The looming rate hike also affected gold, which hit its lowest level in two weeks. Gold and silver are inversely correlated to the dollar index and especially to US Treasury bond yields. Therefore, when bond yields rise, gold and silver prices fall.

Asian stock markets traded flat yesterday. Japan’s Nikkei 225 (JP225) jumped by 1.23%, Hong Kong’s Hang Seng (HK50) fell by 1.25%, and Australia’s S P/ASX 200 (AU200) added 0.31%. Chinese stocks rebounded slightly yesterday, with blue chips recouping early losses and rising 1% on hopes for political support, but price pressure persists as a Shanghai lockdown holds back gains. The yuan has fallen to a seven-month low. Analysts at HSBC expect China to need a comprehensive easing package on all fronts, both monetary and fiscal, including easing measures in the real estate sector, which has been hit hard by restrictions on access to credit.

Australia’s business activity index (PMI) showed growth in both manufacturing and services sectors. Values are above the 56 mark. Anything above 50 is considered economic growth and stability.

Main market quotes:

S&P 500 (F) (US500) 4,393.66 −65.79 (−1.48%)

Dow Jones (US30) 34,792.76 −368.03 (−1.05%)

DAX (DE40) 14,502.41 +140.38 (+0.98%)

FTSE 100 (UK100) 7,627.95 −1.27 (−0.017%)

USD Index 100.63 +0.24 (+0.24%)

Important events for today:
  • – Australia Manufacturing PMI (m/m) at 02:00 (GMT+3);
  • – Japan National Core Consumer Price Index at 02:30 (GMT+3);
  • – UK Retail Sales (m/m) at 09:00 (GMT+3);
  • – German Manufacturing PMI (m/m) at 10:30 (GMT+3);
  • – Eurozone Manufacturing PMI (m/m) at 11:00 (GMT+3);
  • – UK Manufacturing PMI (m/m) at 11:30 (GMT+3);
  • – Canada Retail Sales (m/m) at 15:30 (GMT+3);
  • – Eurozone ECB President Lagarde Speaks at 16:00 (GMT+3);
  • – US Manufacturing PMI (m/m) at 16:45 (GMT+3);
  • – UK BoE Gov Bailey Speaks at 17:30 (GMT+3).

by JustForex


This article reflects a personal opinion and should not be interpreted as an investment advice, and/or offer, and/or a persistent request for carrying out financial transactions, and/or a guarantee, and/or a forecast of future events.

Why is the Yen so weak?

By Han Tan Chief Market Analyst at Exinity Group

– Two words: policy divergence (read on to find out more).

But first, let’s take a look at just how dismal the Yen’s performance has been so far in 2022.

The Japanese Yen is now trading around a 20-year low against the US dollar.

Last Tuesday, USDJPY posted its biggest single-day climb since November 2020, only to then take a breather for the time being.

(Note: weaker Yen versus the US dollar = USDJPY climbs higher).

FUN FACT: The last time USDJPY traded at these levels just below 130, Eminem had just released his hit 2002 track, “Without Me”.

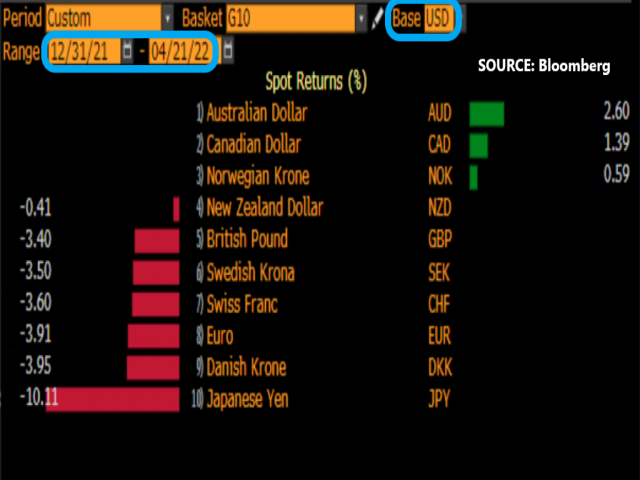
In fact, JPY is the worst performer against the US dollar amongst all G10 currencies … by far.

And the Yen’s woes aren’t just limited to its performance against the US dollar alone.

Consider how the JPY Index has weakened by almost 9% so far this year.

Note that the index shown above comprises a basket of currency pairs measuring the Yen against its G10 peers, all in equal weights:

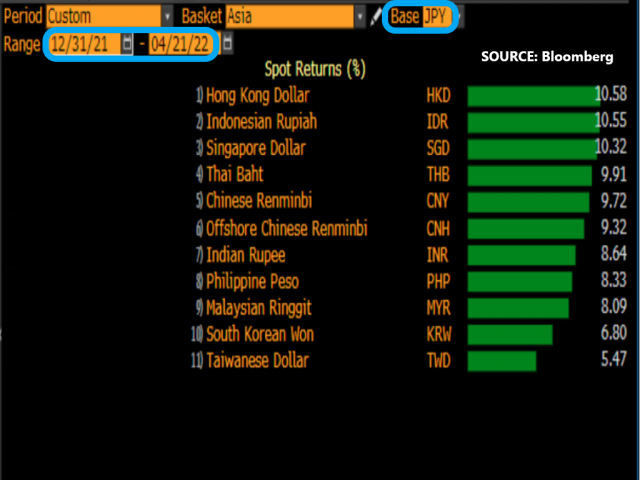
The Yen also has a year-to-date decline against all its major Asian counterparts as well.

So why is the Yen so weak?

The main reason is because of monetary policy divergence.

Let’s break it down.

Firstly, monetary policy is the way a central bank achieves its goals for the economy (e.g. maximum employment, stable prices, etc.), using tools like interest rates, money supply, and even currency levels.

And where’s the divergence?

The Bank of Japan is still using its monetary policy to support its economy.

This is in stark contrast to what most other central banks around the world are doing = pulling back that support. They do this by raising interest rates/easing back on bond purchases.

The goal of such policy-tightening (not what the BOJ is doing) is to reduce money supply and demand levels in an economy = less money chasing after scarce goods = to lower consumer prices/inflation.

Monetary policy: Comfort food vs. a regular diet

Consider when a child is feeling down, his/her parents may have no qualms treating the child to some ice cream, candy, or chocolate bars.

Such sweet indulgences are meant to make the child feel better in a jiffy, but is (hopefully) just a short-term fix and also (again, hopefully) far different from the regular diet the child consumes as part of the daily routine.

Similarly, when the economy was suffering during the pandemic, central banks rolled out record-low interest rates and printed money out of thin air to keep financial markets supported.

Low interest rates = cheaper for households/businesses to borrow money = they have money to spend in the economy = the economy gets better

But now that economies are recovering and even posting red-hot inflation numbers, they no longer need record-low interest rates and unlimited bond purchases

Hence, central banks are returning to their economy’s “regular diet” by tightening policy = paring down bond purchases/reducing the supply of money in the economy/raising interest rates.

Who’s already hiking rates?

Within the G10 space alone:

  • Bank of New Zealand – raised its benchmark rate by 125 basis points (1.25%) since Q3 2021
  • Bank of Canada – raised its benchmark rate by 75 basis points so far this year
  • Bank of England – raised its benchmark rate by 65 basis points since December
  • US Federal Reserve – raised rates by 25 basis points in March, perhaps another 50-basis point hike in May

But not so the Bank of Japan.

It’s keeping Japan’s benchmark interest rate at a record low of negative 0.1%, while buying up even more bonds.

Hence, the divergence in monetary policy.

How is policy divergence playing out in markets?

This divergence is evident in the widening gap in yields between Japanese bonds and its global counterparts.

Firstly, what are yields? 

Yields are a way to measure how much money you could earn on an investment over a set period of time.

In the case for bonds, it’s calculated in terms of how much interest one would get paid if they held on to that bond till it matures/reaches the end of its tenure.

For context, bond yields have been climbing around the world.

This is because investors are selling off bonds in tandem with central banks that are reducing their balance sheets.

And when bond prices drop, their yields rise.

Here are the benchmark 10-year yields for these other countries (at the time of writing):

  • US = 2.88%
  • Canada = 2.87%
  • China = 2.82%
  • UK = 1.95%
  • Germany = 0.89%

Contrast the numbers above with Japan’s 10-year yields, which are capped at 0.25%.

As a policy, the Bank of Japan is buying even more bonds to keep bond prices elevated and limit its benchmark 10-year yields to no higher than 0.25% (this process is also known as “yield curve control”).

The goal for capping those yields is to keep borrowing costs low in Japan so that households/businesses can still borrow to stimulate the economy.

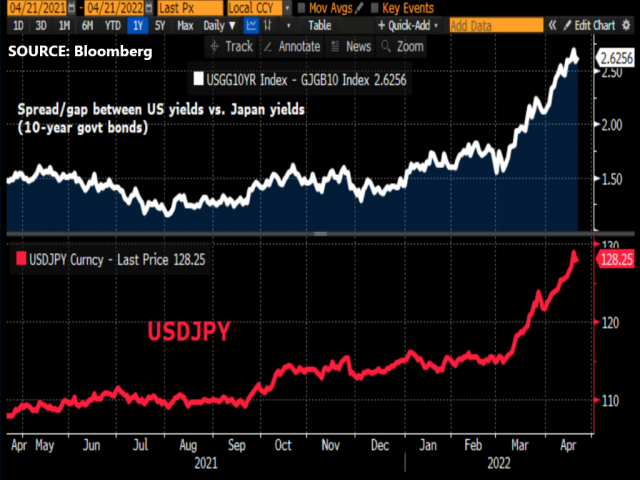
Government bond yields are often used as the benchmark by which other banks/financial institutions calculate the interest to charge the customers who borrow money.Here are two charts that show how the widening gap/spread between US benchmark yields vs. Japan’s benchmark yields (10-year government bonds) correspond with the USDJPY’s performance:

See how those two lines are moving in sync with one another?

In essence, the wider the gap between US and Japan’s yields, the higher USDJPY goes (the weaker the Japanese Yen against the US dollar).

How are Japan’s capped yields affecting the yen?

The lower yields on offer in Japan suggests that investors would get more bang for their buck by buying bonds in other countries that are now posting higher yields (again, yields in this case are a measure of how much one could earn from investing in that particular bond).

At risk of oversimplifying matters:

  • Less demand for Japanese assets = less demand for the Japanese yen.
  • And when there’s lower demand = prices fall (all else equal).

Hence, the Yen has been falling as investors shun Japanese bonds.

From a fundamental perspective, markets are getting the sense that the Japanese economy is still too fragile – or at least the Bank of Japan thinks so of its own economy – and is nowhere near strong enough to be able to do without the ‘comfort food’ from the central bank.

But of course all that could change, as the BOJ faces increasing pressure to follow suit with other central banks in tightening policy … or perhaps even just to stem the Yen’s weakness.

Which brings us to this final point …

Will the Yen eventually rebound?

As a market cliche goes … nothing lasts forever.

So yes, theoretically the Yen could eventually rebound.

But one of two things may need to happen first:

1) The Bank of Japan has to signal that its willing to abandon its ultra-loose monetary policies.

Policymakers need to be convicted that Japan’s economic recovery is sustainable, and that inflation is being fuelled by robust demand (a.k.a. demand-pull inflation) as opposed to cost-push inflation.

To be clear, this seems unlikely for a while more, at least through the end of 2022.

Still, look out for the Bank of Japan policy meeting next week (April 28th).

The slightest clue that the BOJ is ready to tweak its policy stance could trigger a big move in the Yen.

2) Policymakers intervene to curb Yen weakness

This has been done before, but not for quite some time.

The last time the Japanse government propped up the yen was back in 1998, when USDJPY traded above 140 and peaked at 147.66 in September 1998.

However, back in 2002 even when USDJPY surpassed 135, the government sat on its hands and didn’t intervene.

So it remains to be seen at what level Japanese policymakers will tolerate before trying to stop the Yen from weakening further.

Keep in mind that a drastically-weaker Yen causes its own problems for the economy.

Japan is a net importer of energy, which are widely denominated in US dollars. The weaker Yen forces Japan to spend more of its currency to buy the same amount of fuel, not to mention the other imported goods (e.g. food) and services that it now has to spend more money on. If the imported costs become too great and weigh on businesses/households, then the Japanese government may be forced to pay for subsidies to ease the pain. That’s money out of the Japanese government’s pocket that could be spent on other things.

So until either of the above scenarios happen, shorting the Yen has remained a popular bet.

Last week, asset managers raised their short bets on the Yen to the most ever on record, according to CFTC data.

Overall, as long as this policy and yields divergence continues to play out between Japan and other major economies, that’s likely to keep the Yen on its weakening path for longer.

That is, unless the BOJ or Japan’s Finance Ministry switches tact and, in intervening to halt the Yen’s weakness, might do so while dropping bars from Eminem’s monster hit from 2002 …

“Now this looks like a job for me
So everybody, just follow me
‘Cause we need a little, controversy
‘Cause it feels so empty, without me”


Disclaimer: The content in this article comprises personal opinions and should not be construed as containing personal and/or other investment advice and/or an offer of and/or solicitation for any transactions in financial instruments and/or a guarantee and/or prediction of future performance. ForexTime (FXTM), its affiliates, agents, directors, officers or employees do not guarantee the accuracy, validity, timeliness or completeness, of any information or data made available and assume no liability as to any loss arising from any investment based on the same.


Forex-Time-LogoArticle by ForexTime

ForexTime Ltd (FXTM) is an award winning international online forex broker regulated by CySEC 185/12 www.forextime.com

IMF is right: cryptocurrencies are ushering in a changing world order

By George Prior

The IMF report is both right and wrong on cryptocurrencies. Bitcoin and crypto are indeed shaking-up the current world order; but doing so for the better, affirms the CEO of one of the world’s largest independent financial advisory, asset management and fintech organisations.

The analysis from Nigel Green of deVere Group comes as the International Monetary Fund publishes the Global Financial Stability Report, which assessed Bitcoin and other cryptocurrencies disrupting the global monetary system.

The IMF says that “strengthening macroeconomic policies is necessary” to fend off “cryptoization risks.”

Nigel Green says: “The IMF is correct – cryptocurrencies are indeed ushering in a changing world order.

“The times ahead are destined to be radically different from what we have all experienced in our lifetimes so far.

“One way in which we will see this each day is with currencies, which are mediums of exchange and store holders of value.

“Increasingly, there will be a mixed system. Some will be currencies from governments, including digital and non-digital, and some will be digital and decentralised, such as Bitcoin.

He continues: “The U.S. dollar has reigned supreme for around 75 years. But there’s no doubt that the world is shifting away from a dollar-dominated system.

“This is because astronomic levels of debt, and the enormous, ongoing amount of money printing to monetise these debts, have caused the considerable drop in the long-term value of the global reserve currency.

“Investors – including individuals and governments – are therefore looking for alternative currencies, such as cryptocurrencies.

“Moving forward, these will increasingly compete with traditional, fiat ones and this will help trigger the decreasing dominance of currently leading international currencies.”

However, the deVere CEO says that the IMF should embrace Bitcoin, which will “inevitably play a critical future role” in the global monetary system.

“Bitcoin can also be a force for social good as it can offer a way out of both financial and political repression,” he notes.
“It’s estimated that more than one billion people live in countries that are suffering from out-of-control inflation, where the money they earn depreciates fast against the goods and services they need to buy.

“But Bitcoin can offer a ‘get-out’ for those whose national currency is plummeting in value in this way.”

Bitcoin can also serve those who face political suppression. There are countless examples around the world where those who are dissenting against ruling authoritarian regimes have their accounts shuttered and/or funds stolen. This means they are then trapped, possibly forever.

“This is where Bitcoin can play a hugely beneficial role as they can receive and send it safely, securely, without censorship.”

The deVere CEO goes on to add: “As a global, decentralised system, it affords anybody, anywhere, regardless of their political beliefs, nationality, ethnicity, religion, gender, or sexuality, the same level playing field. It can’t discriminate.

“This is helping not only the politically repressed but the 1.7 billion global ‘unbanked’ population.  That’s almost two billion people worldwide who cannot access financial services because their data is not held on ‘traditional’ sources, largely due to legacy biases.”

Nigel Green concludes: “Bitcoin has the potential to provide enhanced financial and political freedom.  It has the power to create a better tomorrow.

“Why the IMF, an organisation whose remit is to ‘achieve sustainable growth and prosperity’ is scared of a future-focused solution, is baffling.

“Clearly, past methods, in poorer countries haven’t been as successful as they should have been. As such, we need to look forward, not back.”

About:

deVere Group is one of the world’s largest independent advisors of specialist global financial solutions to international, local mass affluent, and high-net-worth clients.  It has a network of more than 70 offices across the world, over 80,000 clients and $12bn under advisement.