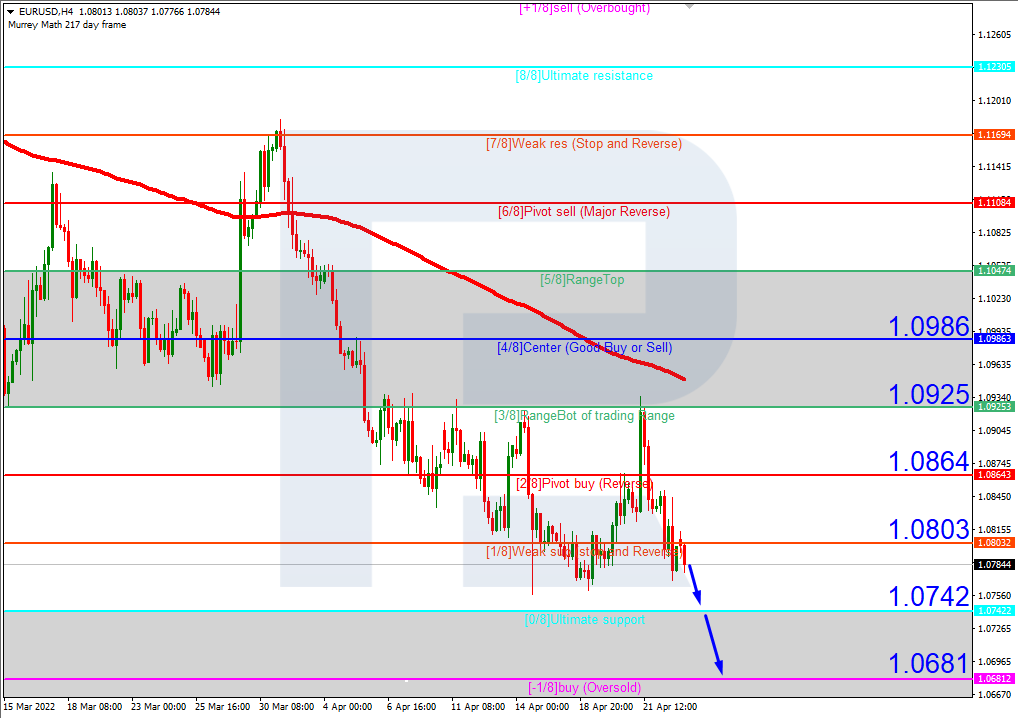
In the H4 chart, EURUSD is trading below the 200-day Moving Average to indicate a possible descending tendency. In this case, the price is expected to continue falling to reach the support at -1/8. Still, this scenario may no longer be valid if the price breaks the resistance at 1/8 to the upside. After that, the instrument may reverse and correct up to 3/8.
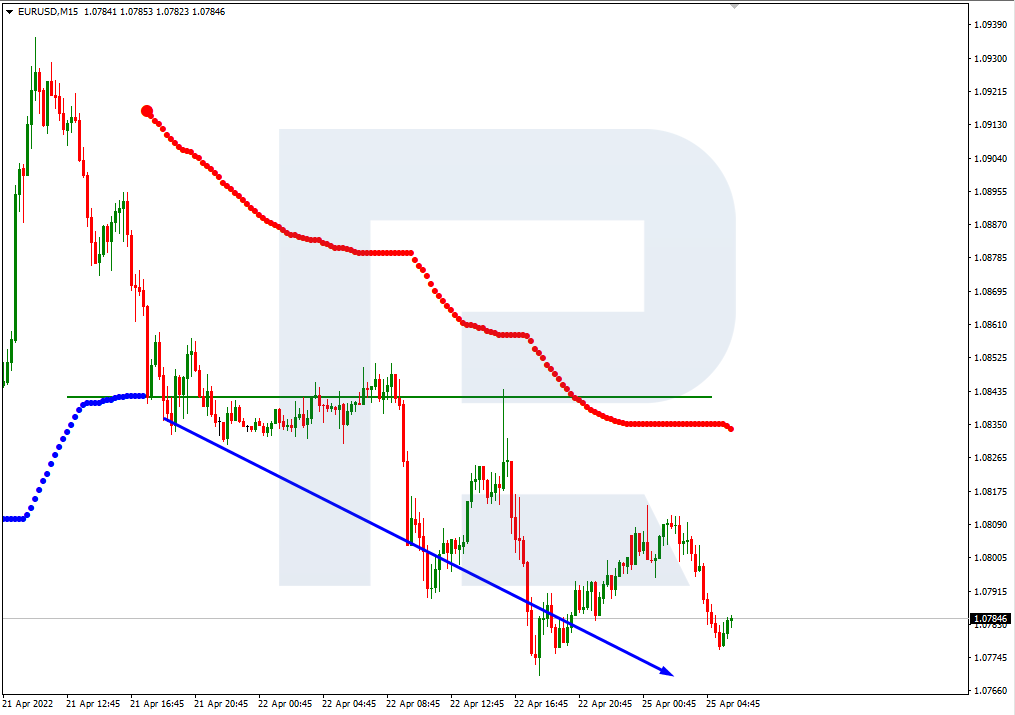
As we can see in the M15 chart, the pair has broken the downside line of the VoltyChannel indicator and, as a result, may continue trading downwards.
GBPUSD, “Great Britain Pound vs US Dollar”
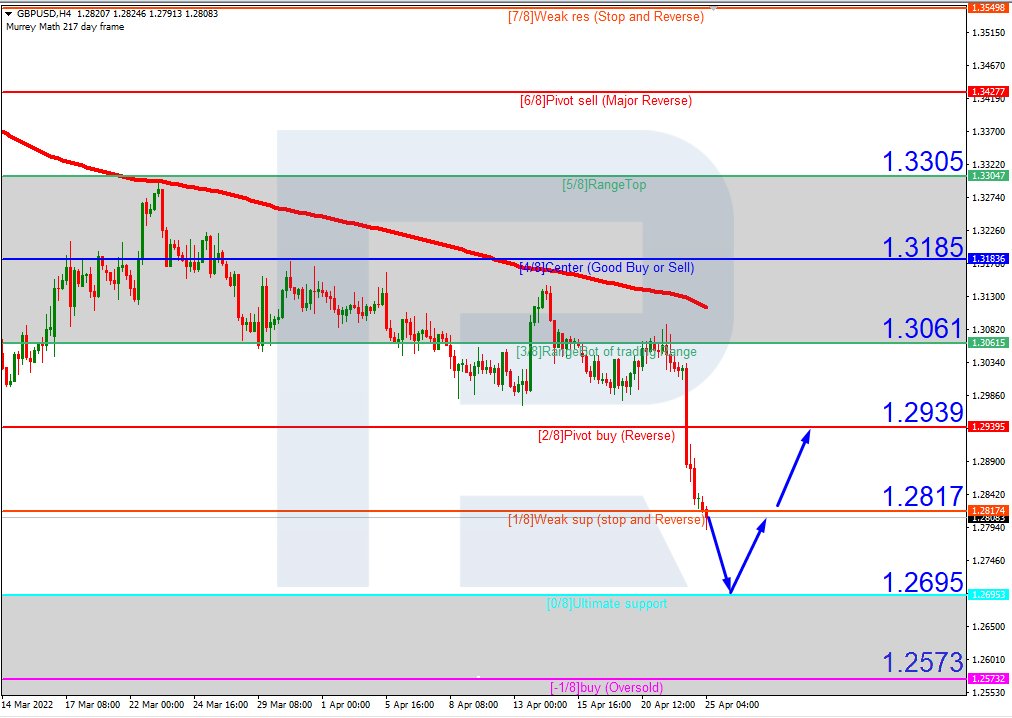
As we can see in the H4 chart, GBPUSD is approaching the “oversold area”. In this case, the price is expected to test 0/8, rebound from it, and then resume growing to reach the resistance at 2/8. However, this scenario may no longer be valid if the price breaks the resistance 1/8 to the upside. After that, the instrument may correct towards the resistance at 2/8 without testing the support at 0/8.
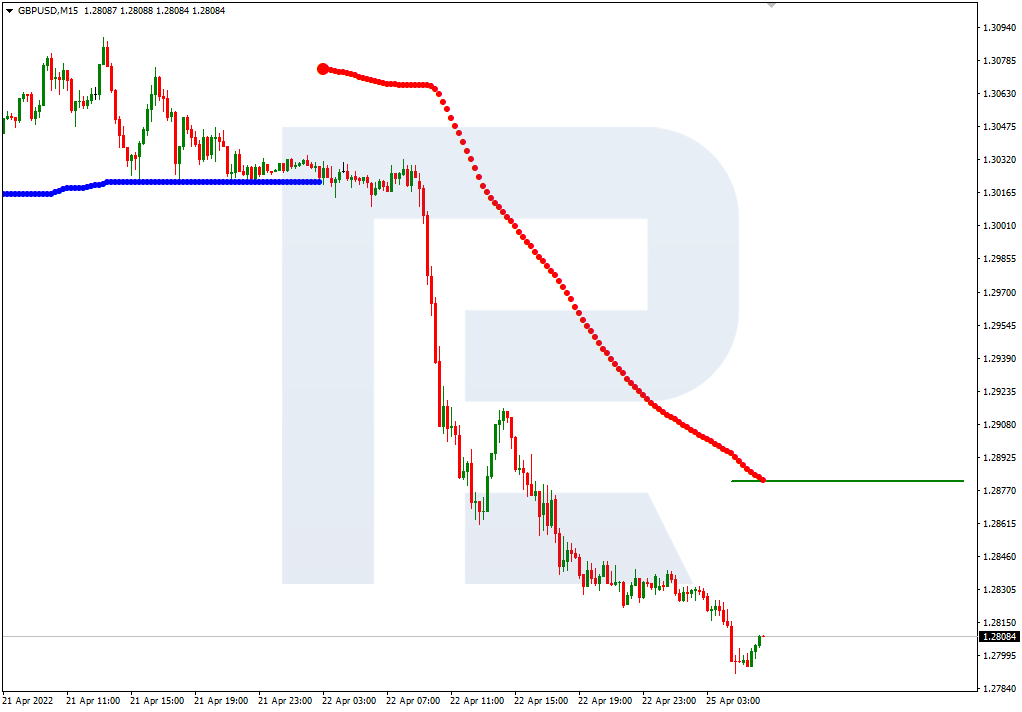
In the M15 chart, the pair may break the upside line of the VoltyChannel indicator and, as a result, continue its growth.
Attention! Forecasts presented in this section only reflect the author’s private opinion and should not be considered as guidance for trading. RoboForex LP bears no responsibility for trading results based on trading recommendations described in these analytical reviews.
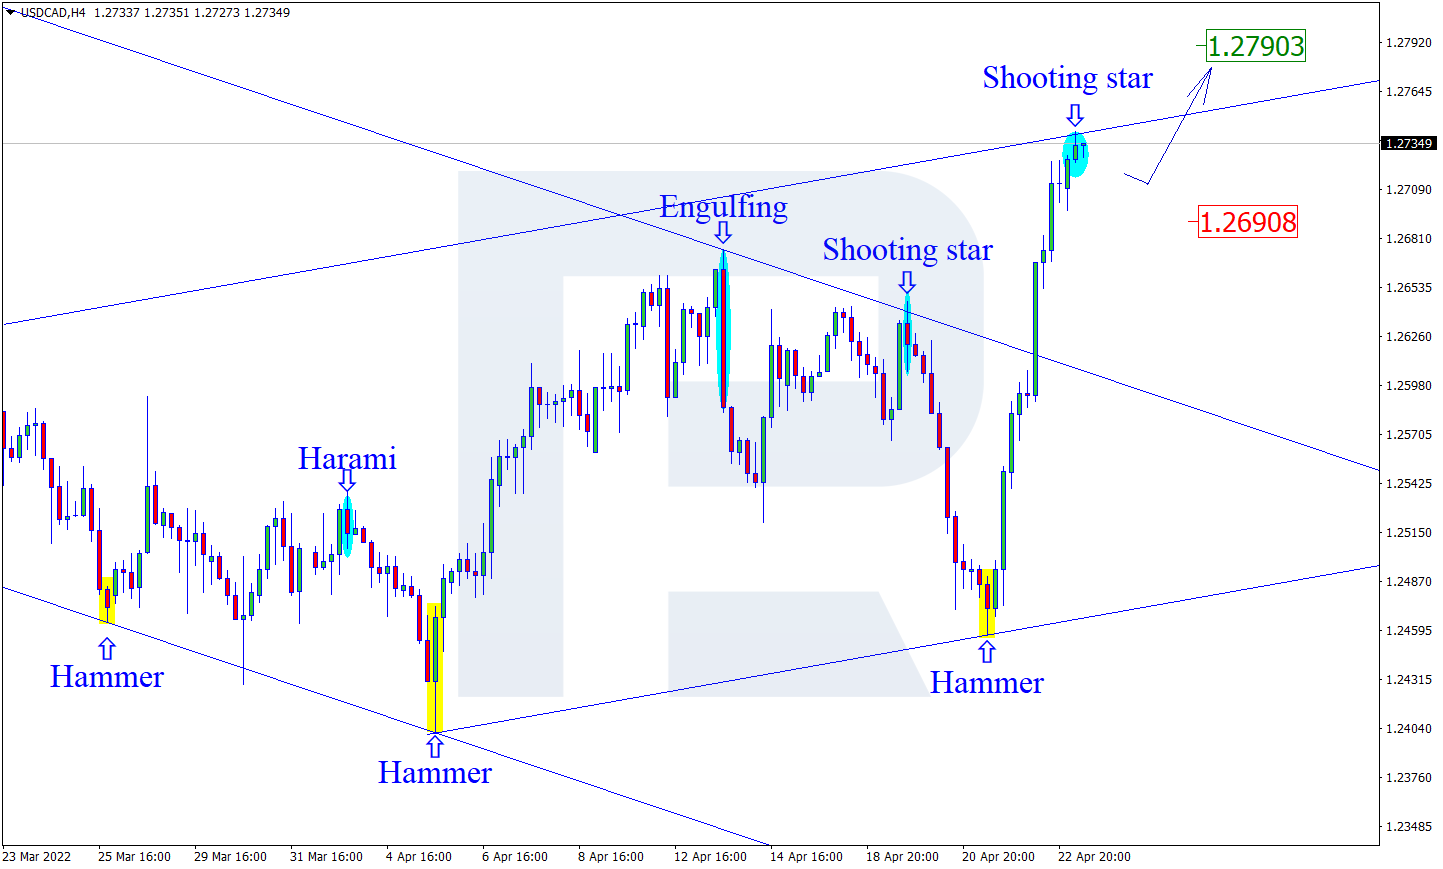
As we can see in the H4 chart, after forming a Shooting Star reversal pattern close to the resistance level, USDCAD is reversing in the form of a new correctional impulse. In this case, the downside correctional target may be at 1.2690. However, an alternative scenario implies that the asset may grow to break the resistance level at 1.2790 and then continue the uptrend without any pullbacks.
AUDUSD, “Australian Dollar vs US Dollar”
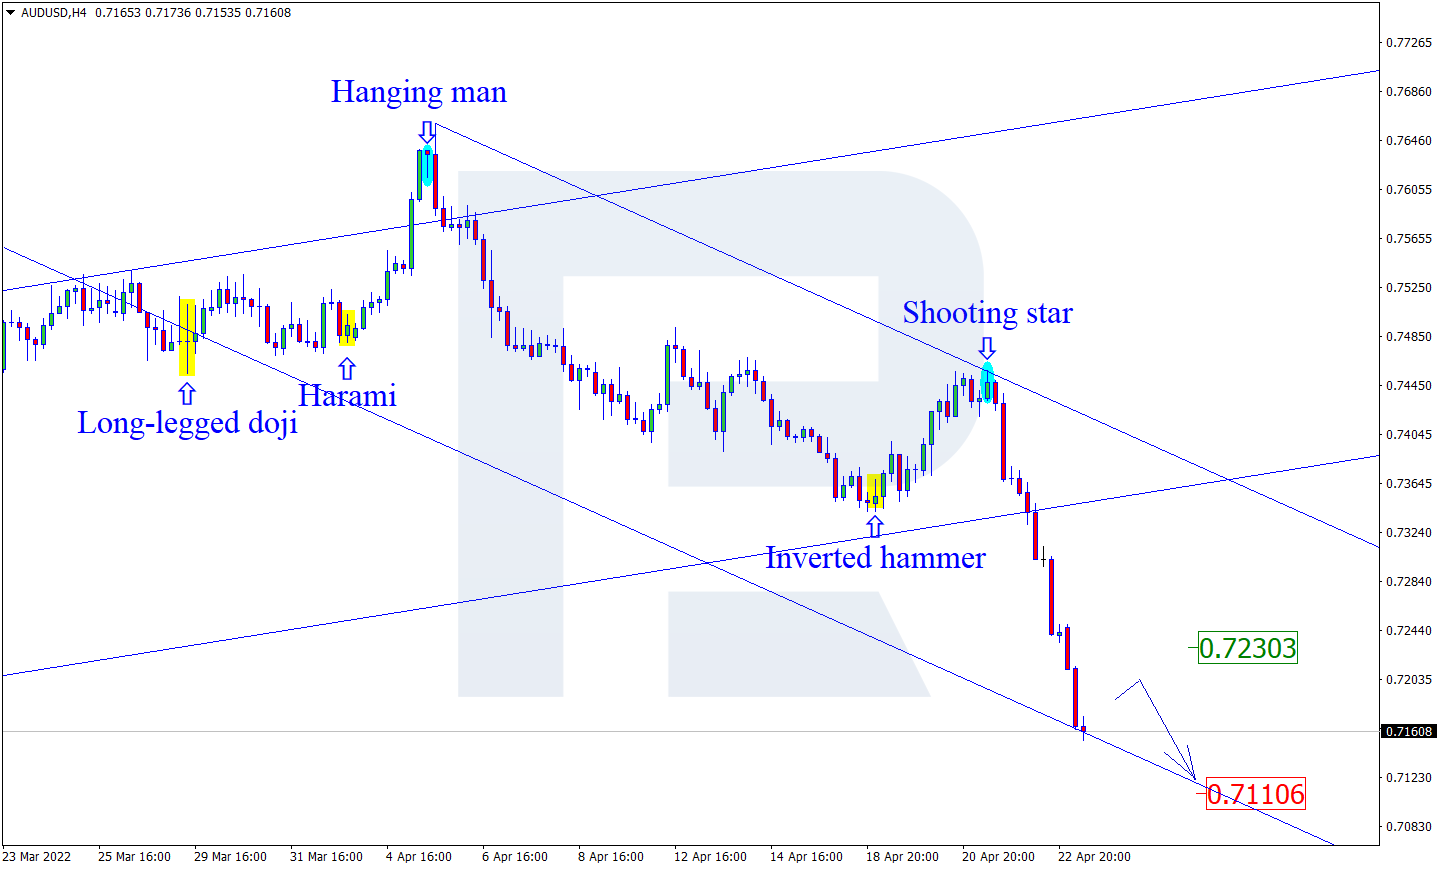
As we can see in the H4 chart, AUDUSD has formed several reversal patterns, such as Shooting Star, near the resistance area. At the moment, the asset is reversing and starting a new descending impulse. In this case, the downside target may be the support level at 0.7110. After testing the level, the price may break it and continue the descending tendency. At the same time, an opposite scenario implies that the price may correct to reach 0.7230 before resuming the downtrend.
USDCHF, “US Dollar vs Swiss Franc”
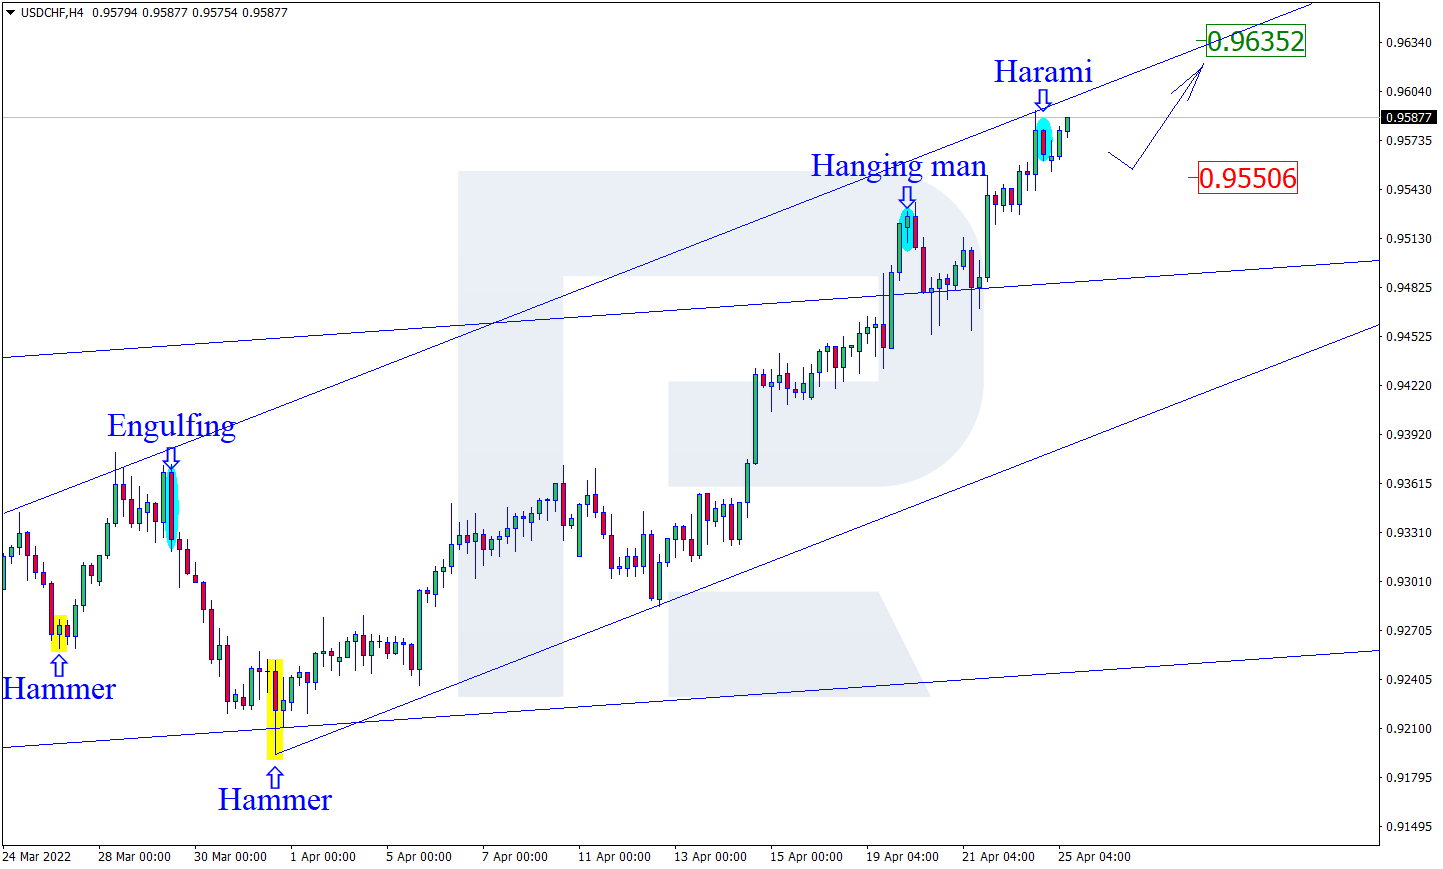
As we can see in the H4 chart, after testing the resistance area, the pair has formed a Harami reversal pattern. At the moment, USDCHF may reverse in the form of a new descending impulse. In this case, the downside target may be at 0.9550. After testing the support level, the price may rebound from it and resume trading upwards. Still, there might be an alternative scenario, according to which the asset may grow to reach 0.9635 without any pullbacks.
Attention! Forecasts presented in this section only reflect the author’s private opinion and should not be considered as guidance for trading. RoboForex LP bears no responsibility for trading results based on trading recommendations described in these analytical reviews.
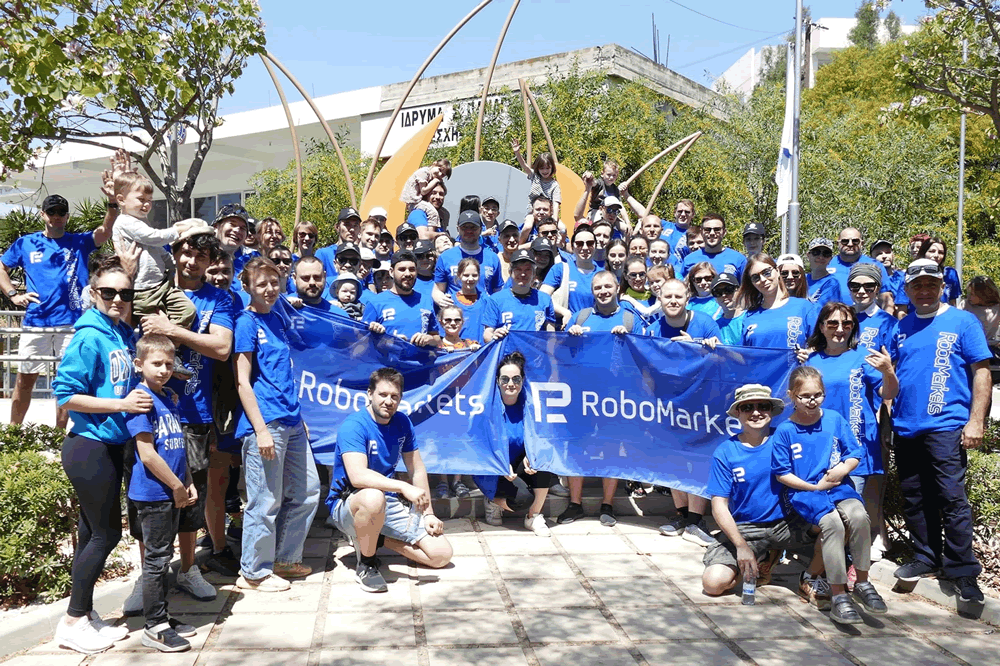
RoboMarkets, a European broker working with European clients, announces the holding of an ecological event that took place on Saturday 16 April 2022. The initiative group of the RoboMarkets team went outside to clear out the Garyllis River Linear Park. The event was held with the support of the local authorities and featured the mayor of Limassol.
Last weekend, over a hundred of RoboMarkets employees and their family members gathered at the Monument of the Volunteer in Limassol to clear out one of the biggest green areas in the city, the Garyllis River Linear Park. The company team got into several groups and in three and a half hours cleared out the 5-kilometre park grounds, collecting over 300 bags of rubbish. After the event, the company staff and their loved ones had a photoshoot with municipal officials and the mayor of Limassol and then went to a special brunch to summarise the results of their work.
Denis Golomedov, Chief Marketing Officer at RoboMarkets comments on the event: “We at RoboMarkets believe that preserving the environment is a great and responsible initiative for the benefit of the city where we live and work. No matter how big or small the area you’ve cleared out is, you do your part and it’s a really big deal”.
“It’s really important for us to contribute, to do something beneficial to society – it’s one of the company’s values. We’re very happy to be here today and I think RoboMarkets will hold such events more often. It’s a great opportunity for our employees to have a good time outside work and, at the same time, take part in preserving the environment of the city we all live in”. – adds Konstantin Rashap, Chief Business Officer at RoboMarkets.
Limassol’s local authorities expressed their gratitude to RoboMarkets for this initiative. They especially focused on teamwork and commitment, which is quite rare when it comes to the involvement of businesses in social activities. They also expressed interest in further cooperation on social events important for the nature and people of Cyprus.
About RoboMarkets
RoboMarkets is an investment company with the CySEC license No. 191/13. RoboMarkets offers investment services in many European countries by providing traders, who work on financial market, with access to its proprietary trading platforms. More detailed information about the Company’s products and activities can be found on the official website at www.robomarkets.com.
US manufacturing growth accelerated in March as robust demand and improved forecast countered negative cost pressures. Economic growth in the Eurozone accelerated in April as a rebound in the services sector helped offset stagnant manufacturing output. Business expectations in Europe for next year increased from a 17-month low. However, confidence remains low as fears of the war in Ukraine, rising prices, and the lingering effects of the pandemic are not optimistic.
From the technical point of view, the trend on the EUR/USD currency pair on the hourly time frame is bearish. Growth in the dollar index led to the fall of the European currency. The MACD indicator has become negative, and the selling pressure has increased. Under such market conditions, it is possible to look for buy trades on intraday timeframes from the support level of 1.0727, but only with short targets and confirmation. Sell trades should be considered from the resistance level of 1.0870 or 1.0908, but only after the additional confirmation.
Alternative scenario: if the price breaks out through the 1.0958 resistance level and fixes above, the uptrend will likely resume.
News feed for 2022.04.23:
– Eurozone Germany Ifo Business Climate (m/m) at 11:00 (GMT+2).
The GBP/USD currency pair
Technical indicators of the currency pair:
Prev Open: 1.3028
Prev Close: 1.2832
% chg. over the last day: -1.52%
UK PMI data showed steady growth in March as further recovery from COVID-19 restraint helped offset the downside. Yet the war in Ukraine has led to unprecedented price increases and reduced business confidence to a year-and-a-half low. The largest increase in selling prices of goods and services in the survey’s history took place in March, and consumer price inflation will continue to rise in the coming months. Analysts predict an undesirable pattern of “stagflation” for the UK economy.
On the hourly time frame, the GBP/USD currency pair trend is still bearish. The price fell sharply on Friday amid a likely “stagflationary” scenario for the UK. The MACD indicator has become negative, with no signs of a reversal. Under such market conditions, sell trades should be looked for from the resistance level of 1.2918, but with confirmation. For buy deals, traders may consider the level of 1.2719, but only after the appearance of a bullish initiative and with short targets.
Alternative scenario: if the price breaks down through the 1.3083 resistance level and fixes above, the mid-term uptrend will likely be resumed.
There is no news feed for today.
The USD/JPY currency pair
Technical indicators of the currency pair:
Prev Open: 128.33
Prev Close: 128.46
% chg. over the last day: +0.10%
The monetary policy of the Bank of Japan remains unchanged. The central bank uses an ultra-soft approach to push the inflation rate closer to the 2% target. The Bank of Japan will hold its next monetary policy meeting this week, but analysts do not expect changes. Thus, fundamentally, USD/JPY quotes tend to rise as the Fed tightens monetary policy, which leads to a rise in the dollar index. But traders should not forget that the Bank of Japan will enter the debt market and sell government bonds to prevent a significant depreciation of the yen in a short period of time. Therefore, a correction might occur soon.
Trading recommendations
Support levels: 126.69, 125.72, 124.66, 124.24, 122.97, 122.63, 121.81
Resistance levels: 128.83, 129.36
The medium-term trend on the USD/JPY currency pair is bullish. The MACD indicator has become inactive, but the divergence is still visible on the higher timeframes. The price is trading in a narrow corridor. Under such market conditions, it is best to look for buy deals, expecting the continuation of the uptrend, but after the price makes a pullback to the average lines and the nearest support levels. First of all, it is worth considering the support level of 126.69, but with additional confirmation. A resistance level of 128.83 may be considered for sell deals, but only with short targets.
Alternative scenario: If the price fixes below 124.66, the uptrend will likely be broken.
There is no news feed for today.
The USD/CAD currency pair
Technical indicators of the currency pair:
Prev Open: 1.2579
Prev Close: 1.2708
% chg. over the last day: +1.02%
The Canadian dollar is a commodity currency, highly dependent on oil price dynamics and the dollar index. The dollar index on Friday continued to grow amid statements by the Fed officials, while oil prices remained at the same level. As a result, the USD/CAD currency pair also increased. Fundamentally, there are currently no prerequisites for a medium-term trend in USD/CAD.
Trading recommendations
Support levels: 1.2644, 1.2607, 1.2521
Resistance levels: 1.2714, 1.2849
The USD/CAD currency pair is bullish in terms of technical analysis. Buying pressure is still high, but the price has deviated strongly from the average values. The MACD indicator has become positive, with no signs of reversal. Trade is worth it only with short targets. Under such market conditions, it is better to look for buy trades on the lower timeframes from the support level of 1.2607 or 1.2644, but it is better with additional confirmation. For sell deals, it is better to consider the resistance level of 1.2849, but it is also better with confirmation and short targets.
Alternative scenario: if the price breaks through and consolidates below 1.2521, the downtrend will likely be resumed.
This article reflects a personal opinion and should not be interpreted as an investment advice, and/or offer, and/or a persistent request for carrying out financial transactions, and/or a guarantee, and/or a forecast of future events.
After Powell’s hawkish speech last week, analysts predict an almost 100% chance of a double interest rate hike in May, June, and July. At the same time, Powell has raised doubts that the Fed will be able to overcome inflation without throwing the economy into recession. This situation frightened investors, who began to sell-off at the end of last week. At the closing of the stock exchange on Friday, the Dow Jones index (US30) decreased by 2.82% (-1.74% for the week), and S&P 500 (US500) lost 2.77% (-2.60% for the week). The NASDAQ Technology Index (US100) fell by 2.55% on Friday and ended the week with a loss of -3.60%.
Now the big question is: can the earnings season pick up indices based on this recessionary sentiment? That’s where analysts disagree. It should be noted that markets set future scenarios at the current price. Therefore, the main indices fall only from rumors. But the real data will not show a decline, and any dovish forecast will be considered positive by the market. So, if the Fed officials don’t say about an aggressive rate hike this week and the corporate earnings are better than expected, the indices might jump impulsively. Nearly 180 companies in the S&P 500, which are worth about half the market value of the benchmark index, are expected to release their results this week, including the four largest US companies by market capitalization: Apple, Microsoft, Amazon, and Google.
Major European indices were trading lower on Friday. German DAX (DE30) lost 2.48% on Friday (+0.31% for the week), French CAC 40 (FR 40) fell by 1.99% (+0.36% for the week), Spanish IBEX 35 (ES35) decreased by 1.84% (+0.29% for the week), British FTSE 100 (UK100) lost 1.39% and ended the week as the leader of falling with -0.78%. UK PMI data showed steady growth in March as further recovery from the COVID-19 restraint helped offset the negative factors. However, the war in Ukraine led to an unprecedented price increase and drove business confidence to a year-and-a-half low. Contrary to the consensus forecast, the Eurozone economy started the second quarter stronger than expected. Nevertheless, weakness in the manufacturing sector is a major concern, as it indicates that the economy is not operating at full capacity. In addition, the ever-increasing cost of living indicates that service sector growth may decline sharply once the initial boost caused by the economic opening fades, especially if business confidence is not restored. Business expectations in Europe for next year have risen from a 17-month low. However, confidence remains low as fears of war in Ukraine, rising prices, and the lingering effects of the pandemic do not inspire optimism. All these factors directly and indirectly put pressure on ECB policymakers, who are increasingly inclined to a more hawkish stance.
The second round of presidential elections took place in France yesterday. Incumbent President Macron (58.54%) won the election against Le Pen (41.46%), who gained record votes for the far-right. After the election of Emanuel Macron as President of France for a second term, protests erupted in France, and police used tear gas in Paris.
The situation in the oil market remains very uncertain. On the one hand, Russia’s invasion of Ukraine, with all that entails, including a possible ban of Russian oil to Europe, suggests that oil prices should only rise. On the other hand, the restrictions imposed in Shanghai and the plans of the US and allies to release strategic reserves to the market prevent oil prices from rising. It is difficult to answer how the situation will develop further. Most analysts believe that oil prices and the energy sector will decrease shortly as the US Fed will tighten its monetary policy aggressively. This will increase the Dollar index, which will put negative pressure on oil quotes, as the main payment for oil supplies is made in US dollars.
Gold and silver, as well as platinum and palladium, were under price pressure late last week. That is not surprising, as any verbal intervention to raise interest rates more aggressively will cause the dollar index to spike and raise US Treasury yields, which is bad for precious metals. At this point, there are no fundamental factors indicating that precious metal prices will rise. And the general rule, “buy gold when inflation is high,” is only temporary speculative.
Asian markets traded flat last week. Japan’s Nikkei 225 (JP225) gained 1.02% over the week, Hong Kong’s Hang Seng (HK50) fell by 3.84% over the week, and Australia’s S&P/ASX 200 (AU200) closed with -0.08% over the week. Private sector output in Japan and Australia rose in April as the easing of COVID-19 supply disruptions domestically helped boost business activity. However, external events, such as the war in Ukraine and COVID-19 restrictions in China, have exacerbated supply chain problems, leading to longer lead times and increased price pressures for companies in both Japan and Australia. Companies in both countries also expressed concerns about rising inflationary pressures on business, leading to another drop in business confidence early in the second quarter. The annual inflation rate in Singapore increased from 4.7% to 5.4%. This is the highest value since 2012. The core consumer price index, excluding food and gasoline prices, increased to 2.9% in March from 2.2% in February.
In the commodities market, by the end of the week futures on lumber (+5.55%), gasoline (+5.49%), orange juice (+3.85%), WTI oil (+3.55%), Brent oil (+3.33%), natural gas (+2.98), corn (+2.47%) and wheat (+2.09%) showed the biggest gains at the end of the week. Sugar (-6.08%), platinum (-5.39%), cocoa (-4.94%), copper (-2.99%) and silver (-2.55%) futures showed the biggest drops.
Main market quotes:
S&P 500 (F) (US500) 4,271.78 −121.88 (−2.77%)
Dow Jones (US30) 33,811.40 −981.36 (−2.82%)
DAX (DE40) 14,142.09 −360.32 (−2.48%)
FTSE 100 (UK100) 7,521.68 −106.27 (−1.39%)
USD Index 101.12 +0.54 (+0.54%)
Important events for today:
– Singapore Consumer Price Index (m/m) at 08:00 (GMT+2);
– Eurozone Germany Ifo Business Climate (m/m) at 11:00 (GMT+2);
This article reflects a personal opinion and should not be interpreted as an investment advice, and/or offer, and/or a persistent request for carrying out financial transactions, and/or a guarantee, and/or a forecast of future events.
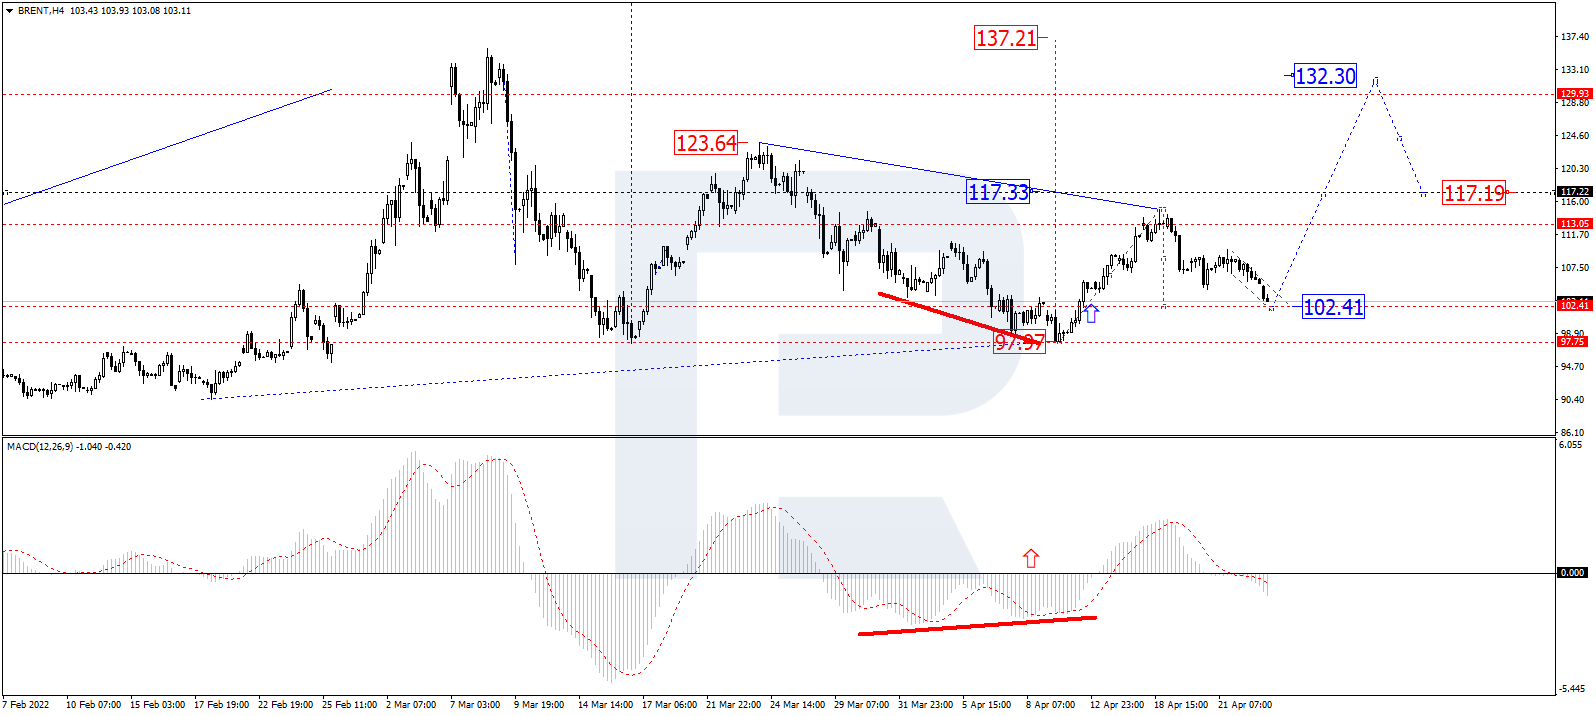
Early in the final April week, oil prices are declining; Brent has reached $103.40.
The key reason for this is a new coronavirus outbreak in Shanghai, China. Earlier, Shanghai authorities started slowly removing social restrictions – about 70% of the companies got back to their normal working routine. However, the population’s mobility is still very restricted because the rising tendency in the number of new cases returned last weekend. The Chinese lockdown limits the demand for fuel, thus having a serious impact on energy prices.
The influence of the lockdown in China on global oil prices is pretty strong but it’s early to assess how much time it might continue.
Last Friday’s report from Baker Hughes didn’t show anything positive. The Oil Rig Count in the US gained 1 unit, up to 549. At the same time, Canada’s indicator lost 1 unit. Market players can’t find signals that high energy prices boost the US shale industry, that’s why this aspect is moving to the back burner.
In the H4 chart, having completed the ascending impulse at 114.96, Brent is finishing the correction towards 102.40 and may later consolidate there. If the price breaks this range to the upside, the market may form one more ascending structure to break 117.22 and then continue moving within the uptrend with the short-term target at 132.30. From the technical point of view, this scenario is confirmed by MACD Oscillator: after breaking 0 to the downside, its signal line is falling within the histogram area, which means that the correction in the price chart may continue.
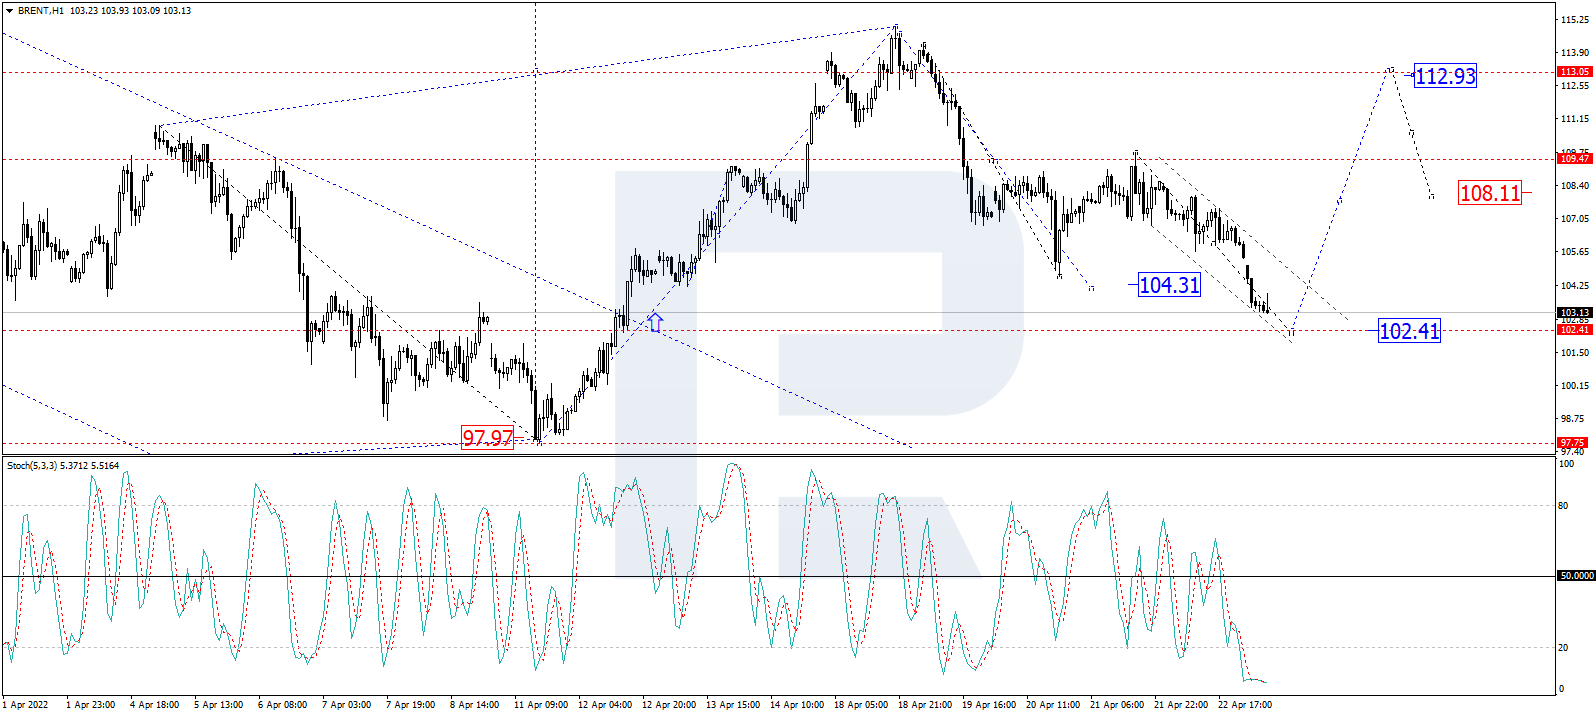
As we can see in the H1 chart, after reaching the correctional target at 104.30, Brent is expected to consolidate there. Later, the market may resume growing to break 114.80 and then continue trading upwards with the short-term target at 132.20. From the technical point of view, this idea is confirmed by the Stochastic Oscillator: its signal line is moving above 20 and may grow to break 50. After that, the line is expected to continue moving upwards and reach 80.
Disclaimer
Any forecasts contained herein are based on the author’s particular opinion. This analysis may not be treated as trading advice. RoboForex bears no responsibility for trading results based on trading recommendations and reviews contained herein.
But did it? It turns out that legal ownership in the metaverse is not that simple.
The prevailing but legally problematic narrative among crypto enthusiasts is that NFTs allow true ownership of digital items in the metaverse for two reasons: decentralization and interoperability. These two technological features have led some to claim that tokens provide indisputable proof of ownership, which can be used across various metaverse apps, environments and games. Because of this decentralization, some also claim that buying and selling virtual items can be done on the blockchain itself for whatever price you want, without any person or any company’s permission.
Despite these claims, the legal status of virtual “owners” is significantly more complicated. In fact, the current ownership of metaverse assets is not governed by property law at all, but rather by contract law. As a legal scholar who studies property law, tech policy and legal ownership, I believe that what many companies are calling “ownership” in the metaverse is not the same as ownership in the physical world, and consumers are at risk of being swindled.
Purchasing in the metaverse
When you buy an item in the metaverse, your purchase is recorded in a transaction on a blockchain, which is a digital ledger under nobody’s control and in which transaction records cannot be deleted or altered. Your purchase assigns you ownership of an NFT, which is simply a unique string of bits. You store the NFT in a crypto wallet that only you can open, and which you “carry” with you wherever you go in the metaverse. Each NFT is linked to a particular virtual item.
It is easy to think that because your NFT is in your crypto wallet, no one can take your NFT-backed virtual apartment, outfit or magic wand away from you without access to your wallet’s private key. Because of this, many people think that the NFT and the digital item are one and the same. Even experts conflate NFTs with their respective digital goods, noting that because NFTs are personal property, they allow you to own digital goods in a virtual world.
NFTs and the hype about the metaverse have sparked a virtual land rush.
However, when you join a metaverse platform you must first agree to the platform’s terms of service, terms of use or end user license agreement. These are legally binding documents that define the rights and duties of the users and the metaverse platform. Unfortunately and unsurprisingly, almost no one actually reads the terms of service. In one study, only 1.7% of users found and questioned a “child assignment clause” embedded in a terms of service document. Everyone else unwittingly gave away their first-born child to the fictional online service provider.
It is in these lengthy and sometimes incomprehensible documents where metaverse platforms spell out the legal nuances of virtual ownership. Unlike the blockchain itself, the terms of service for each metaverse platform are centralized and are under the complete control of a single company. This is extremely problematic for legal ownership.
Interoperability and portability are defining features of the metaverse, meaning you should be able to carry your non-real-estate virtual property – your avatar, your digital art, your magic wand – from one virtual world to another. But today’s virtual worlds are not connected to one another, and there is nothing in an NFT itself that labels it as, say, a magic wand. As it stands, each platform needs to link NFTs to their own proprietary digital assets.
Virtual fine print
Under the terms of service, the NFTs purchased and the digital goods received are almost never one and the same. NFTs exist on the blockchain. The land, goods and characters in the metaverse, on the other hand, exist on private servers running proprietary code with secured, inaccessible databases.
This means that all visual and functional aspects of digital assets – the very features that give them any value – are not on the blockchain at all. These features are completely controlled by the private metaverse platforms and are subject to their unilateral control.
Because of their terms of service, platforms can even legally delete or give your items away by delinking the digital assets from their original NFT identification codes. Ultimately, even though you may own the NFT that came with your digital purchase, you do not legally own or possess the digital assets themselves. Instead, the platforms merely grant you access to the digital assets and only for the length of time they want.
For example, on one day you might own a $200,000 digital painting for your apartment in the metaverse, and the next day you may find yourself banned from the metaverse platform, and your painting, which was originally stored in its proprietary databases, deleted. Strictly speaking, you would still own the NFT on the blockchain with its original identification code, but it is now functionally useless and financially worthless.
While admittedly jarring, this is not a far-fetched scenario. It might not be a wise business move for the platform company, but there’s nothing in the law to prevent it. Under the terms of use and premium NFT terms of use governing the $4 million’s worth of virtual real estate purchased on The Sandbox, the metaverse company – like many other NFT and metaverse platforms – reserves the right at its sole discretion to terminate your ability to use or even access your purchased digital assets.
If The Sandbox “reasonably believes” you engaged in any of the platform’s prohibited activities, which require subjective judgments about whether you interfered with others’ “enjoyment” of the platform, it may immediately suspend or terminate your user account and delete your NFT’s images and descriptions from its platform. It can do this without any notice or liability to you.
In fact, The Sandbox even claims the right in these cases to immediately confiscate any NFTs it deems you acquired as a result of the prohibited activities. How it would successfully confiscate blockchain-based NFTs is a technological mystery, but this raises further questions about the validity of what it calls virtual ownership.
The Conversation reached out to The Sandbox for comment but did not receive a response.
Legally binding
As if these clauses weren’t alarming enough, many metaverse platforms reserve the right to amend their terms of service at any time with little to no actual notice. This means that users would need to constantly refresh and reread the terms to ensure they do not engage in any recently banned behavior that could result in the deletion of their “purchased” assets or even their entire accounts.
Technology alone will not pave the way for true ownership of digital assets in the metaverse. NFTs cannot bypass the centralized control that metaverse platforms currently have and will continue to have under their contractual terms of service. Ultimately, legal reform alongside technological innovation is needed before the metaverse can mature into what it promises to become.
“The crypto sisterhood makes the Beardstown Ladies look like pikers”
By Elliott Wave International
Both genders have long participated in financial markets but investing and trading had long been considered to mainly be the province of men.
There are notable exceptions — like Hetty Green. Around the turn of the last century, she was thought to be the richest woman in the U.S. and her miserly ways earned her the nickname of the “Witch of Wall Street.”
As society evolved, many more women have become prominent in the field of investing, especially in recent decades.
Yet, even today, when a woman gains prominence in finance, the fact that she’s a “she” gets special mention.
For example, here’s a March 22 news item from The Street:
Crypto Queen Raises $1.5 Billion in Largest Ever Female VC Fund
Relatedly, a female social movement of sorts has developed around crypto investing.
Here’s another recent news item — this one from the Wall Street Journal (March 11):
Reese Witherspoon and Gwyneth Paltrow Push for Crypto Sisterhood
They are among a wave of female celebrities pitching cryptocurrencies and NFTs to women, saying the unregulated, volatile market is a boys’ club that they can breach.
Of course, it’s perfectly OK for anyone to invest, whether they’re tall or short, rich or of moderate means, experienced or inexperienced and so on.
A point to make, however, is that “social movement” investing rarely ends well. Indeed, the April Global Market Perspective, a monthly Elliott Wave International publication which covers 50-plus worldwide financial markets, mentions what it generally means when an asset class becomes the focus of a cause:
The crypto sisterhood makes the Beardstown Ladies look like pikers: The “cryptocurrency social community targeting women” doesn’t just plan “to make money by issuing its own NFTs.” Its goal is to “right gender imbalances in investing and shape the next chapter of the internet.” Making money in the market is hard by itself. When alternate aspirations get blended in, it almost never works out.
As you might imagine, while the “push for crypto sisterhood” appears to be serving as a contrarian indicator, that doesn’t mean Bitcoin and other cryptos will nosedive tomorrow or next week.
However, this social movement may suggest that the overall mania surrounding cryptos may be closer to an end rather than its beginning.
The message of the Elliott wave structure for major cryptocurrencies is revealing.
You’ll find our Elliott wave analysis of Bitcoin, Ethereum, Cardano, Solana and Polkadot in the “Cryptocurrency” section of the April Global Market Perspective.
If you’d like to learn how to analyze financial markets using the Elliott wave model, you are encouraged to read Frost & Prechter’s Elliott Wave Principle: Key to Market Behavior.
Here’s a quote from this Wall Street classic:
It is our practice to try to determine in advance where the next move will likely take the market. One advantage of setting a target is that it gives a sort of backdrop against which to monitor the market’s actual path. This way, you are alerted quickly when something is wrong and can shift your interpretation to a more appropriate one if the market does not do what you expect. The second advantage of choosing a target well in advance is that it prepares you psychologically for buying when others are selling out in despair, and selling when others are buying confidently in a euphoric environment.
You may be interested in knowing that you can read the entire online version for free once you become a Club EWI member. Club EWI is the world’s largest Elliott wave educational community and is free to join. Members enjoy free access to a wealth of Elliott wave resources on investing and trading without any obligation.
This article was syndicated by Elliott Wave International and was originally published under the headline The New “Social Movement” Surrounding Cryptos — and What It May Mean. EWI is the world’s largest market forecasting firm. Its staff of full-time analysts led by Chartered Market Technician Robert Prechter provides 24-hour-a-day market analysis to institutional and private investors around the world.
5 Elliott waves up signaled a turn for this stock’s steep upward climb
By Elliott Wave International
The first part of the Cambridge dictionary’s definition of “parabolic” is: “having a type of curve like that made by an object that is thrown up in the air … .”
It’s not straight up vertical but the trajectory is steep. Many investors have seen charts of financial markets which show such a parabolic rise.
Now, let’s add the second part of the Cambridge dictionary’s definition to the first part: “having a type of curve like that made by an object that is thrown up in the air and falls to the ground in a different place.” [emphasis added]
Indeed, many investors have seen how this second part also applies to the price charts of financial markets at times.
The September 2019 Global Market Perspective, an Elliott Wave International monthly publication which covers 50-plus worldwide financial markets, called attention to a parabolic rise in the stock price of the London Stock Exchange Group (LSE). Here’s the chart and commentary:
The London Stock Exchange Group has been riding along an upward parabolic curve that has generated a 20-fold increase in the stock price since the late 2000s. Parabolic advances are inherently unsustainable, and this one is even more precarious given that we can count five waves up since the LSE’s public debut.
As you may know, the completion of five-waves — up or down — signals the start of a new trend, which, in this case, would be down.
Well, here’s an update on the price path of LSE from the April Global Market Perspective:
The cited fifth wave turned out to be Minor wave 5 of Intermediate wave (3), one degree smaller than we originally anticipated. Intermediate wave (4), the ensuing decline, initially bounced off support, and [Intermediate] wave (5) completed an ending diagonal at 10,010 on February 16, 2021. [Afterwards], LSE Group dropped 30% in six weeks, and a countertrend rally peaked in June 2021.
As noted, sometimes an Elliott wave practitioner must adjust the wave count as a market’s action unfolds. After all, the Wave Principle is an “exercise in probability.” Having said that, the Wave Principle can sometimes offer amazingly “precise results.”
You can delve into the details of how to apply the Wave Principle to your analysis of financial markets by reading Frost & Prechter’s Wall Street classic, Elliott Wave Principle: Key to Market Behavior. Here’s a quote from the book:
After you have acquired an Elliott “touch,” it will be forever with you, just as a child who learns to ride a bicycle never forgets. Thereafter, catching a turn becomes a fairly common experience and not really too difficult. Furthermore, by giving you a feeling of confidence as to where you are in the progress of the market, a knowledge of Elliott can prepare you psychologically for the fluctuating nature of price movement and free you from sharing the widely practiced analytical error of forever projecting today’s trends linearly into the future. Most important, the Wave Principle often indicates in advance the relative magnitude of the next period of market progress or regress. Living in harmony with those trends can make the difference between success and failure in financial affairs.
Here’s the good news: You can read the entire online version of the book for free once you become a Club EWI member.
In case you’re unfamiliar with Club EWI, it’s the world’s largest Elliott wave educational community and is free to join. More than that, members enjoy free access to a wealth of Elliott wave resources on investing and trading.
This article was syndicated by Elliott Wave International and was originally published under the headline London Stock Exchange… Stock: Predicting the Collapse of a “Parabolic Rise”. EWI is the world’s largest market forecasting firm. Its staff of full-time analysts led by Chartered Market Technician Robert Prechter provides 24-hour-a-day market analysis to institutional and private investors around the world.
Sri Lanka recorded the first casualties from its spiralling economic crisis several days ago, with one protester dead and 24 more injured. This was from police firing gunshots into a crowd who were demanding the removal of a government they hold responsible for the country’s predicament. At present:
Citizens cannot access essentials such as fuel, medicines and food, with some even dying while queuing for fuel.
Protesters of all classes are taking to the streets – members of the middle class face a potentially irreversible decline in living standards, while the masses are being pushed into absolute poverty.
Sri Lanka has formally (apparently temporarily) defaulted on its debts. India and China, jostling for influence and power, are providing emergency funding and the IMF is considering a bailout under its Rapid Financing Initiative.
An apologist could put much of Sri Lanka’s problems down to bad luck: the pandemic and the conflict between Russia and Ukraine are partly to blame, and neither could have been anticipated. On the other hand, poor policy choices by a corrupt, authoritarian governing elite have made Sri Lanka uniquely vulnerable. This has been a disaster in slow motion, entirely predictable, a textbook case of how a government can cause a debt crisis.
Before 2019, Sri Lanka was self-sufficient in food. The government elected that year banned pesticides so that only organic farming was allowed, resulting in the shutting of tea plantations (a source of export revenue) and shrinking the country’s ability to feed itself (Sri Lanka now imports grains). Together with the damage to tourism from the COVID pandemic and rising global commodity prices, this has reduced tax revenues and put more pressure on the Sri Lankan rupee.
The public finances have been further damaged by unsustainable subsidies and unaffordable tax cuts. Equally, there have been futile attempts to maintain an unviable currency peg to the US dollar and bad decisions around debt management. Public debt has near-tripled as a percentage of GDP to 104% in three years, while the rupee has jumped from about 200 to the US dollar in early March to almost 330 today.
Deja vu
Sri Lanka’s governing elites are not alone in making these kinds of poor policy choices. For example, in the run up to the crisis that engulfed Lebanon in late 2019, the central bank swapped debt held in Lebanese pounds into debt in euros and US dollars while maintaining an unviable currency peg.
The fees from these activities generated huge profits for major banks but made the country vulnerable to negative external shocks, such as nervous foreign investors dumping government bonds. This helped to drive down the value of the currency and made debts priced in foreign currency harder to pay back. Just like Sri Lanka, there were protesters on the streets, governing elites waxing eloquently about the need to maintain national unity, and a middle class facing the prospect of being wiped out while millions were pushed into poverty.
What can be done to prevent these situations? One common thread is international bailouts from the IMF and other bodies, in which the money is conditional on reining in the state through severe cuts to public spending, privatisations and so on. After a gap of a few years, provided the state meets these conditions, borrowing in international capital markets is permitted to resume and the whole cycle can repeat. These interventions teach elites elsewhere that reckless policies will be bailed out, making it inevitable that similar debt crises will occur in apparently different circumstances in other countries.
Fairer bailouts
Perhaps it is time to consider a different approach, which puts the needs of citizens first and ensures that political elites aren’t rewarded for poor policy choices. Various academics make a distinction between two types of creditors in these situations: “formal creditors”, such as a western European pension fund buying sovereign bonds, and “informal creditors” within the state itself, such as pensioners who have contributed to the state social security fund, or workers who have paid into the public insurance system.
There’s a social contract that these informal creditors will benefit from the money they pay in, yet in a bailout situation, they bear the brunt of austerity, including cuts to social security programmes. Meanwhile, foreign creditors get their money back – albeit with a “haircut” where they lose a proportion (though this risk is usually already reflected in the interest rate at which their money is lent in the first place).
We argue in an upcoming paper that when informal creditors have an explicit say in how a debt crisis is resolved, as in Iceland in the early 2010s, both austerity and the power of governing elites will be limited. Instead, policy choices are tailored to ensuring that the economy recovers faster and a future debt crisis becomes less likely.
The UN Conference on Trade and Development (UNCTAD) published a debt workout guide in 2015 that offers a road map for such a process. It proposes referendums at key points in the lead-up to a bailout to ensure that the public see the options and get a chance to vote on them.
Sri Lanka presents an ideal opportunity to put this into practice. The suffering of ordinary citizens, pensioners, students and the impact on future generations is neither inevitable nor bad luck. Citizens’ views must be taken into account in determining how the crisis is resolved.
This would be a blueprint for future economic crises – and these could well be looming in view of slow post-COVID recovery, the strong US dollar and high commodity prices. In south Asia alone, Pakistan is similarly vulnerable to not having adequate foreign exchange reserves to service its sovereign debts, and despite strenuous official denials, so is Nepal.
The political elites in these countries may already have made the poor financial decisions that have created these vulnerabilities. But there is a good opportunity to send a message that the consequences will be different when politicians and bankers take similar decisions in future.