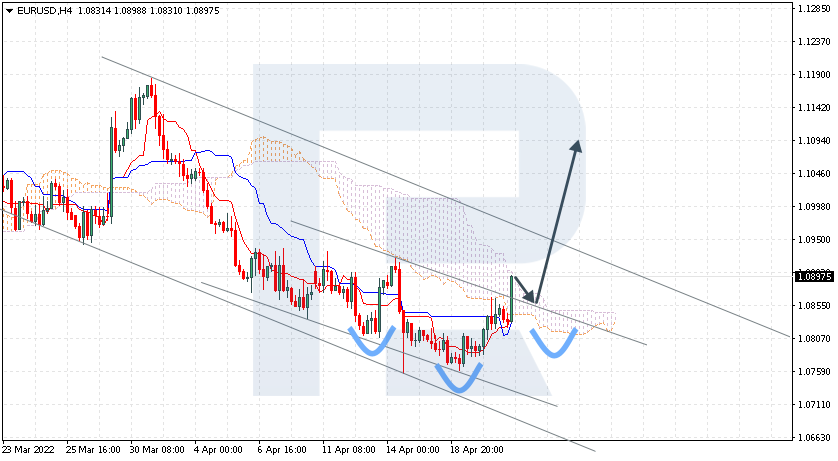
EURUSD is rebounding from the cloud’s upside border at 1.0897; bears have failed to fix the price below the support area at 1.0805. The instrument is currently moving inside Ichimoku Cloud, thus indicating a sideways tendency. The markets could indicate that the price may test the cloud’s downside border at 1.0855 and then resume moving upwards to reach 1.1095. Another signal in favour of a further uptrend will be a rebound from the descending channel’s upside border. However, the bullish scenario may no longer be valid if the price breaks the cloud’s downside border and fixes below 1.0780. In this case, the pair may continue falling towards 1.0690. Also, there is a potential for the formation of an upside-down Head & Shoulders reversal pattern with the target at 1.1065. While forming the pattern, the asset may fall to test 1.0820 and complete the pattern’s right “shoulder” there.
BRENT
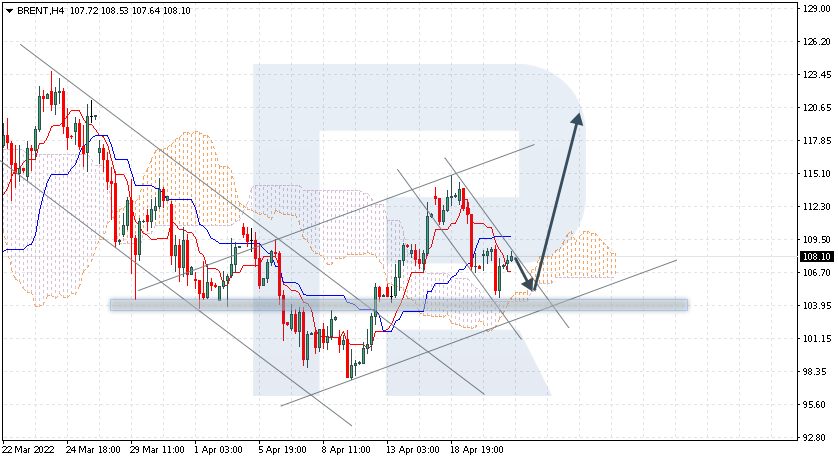
Brent is still testing Tenkan-Sen and Kijun-Sen at 108.10. The instrument is currently moving above Ichimoku Cloud, thus indicating an ascending tendency. The markets could indicate that the price may test the cloud’s upside border at 105.45 and then resume moving upwards to reach 120.65. Another signal in favour of a further uptrend will be a rebound from the rising channel’s downside border. However, the bullish scenario may no longer be valid if the price breaks the cloud’s downside border and fixes below 100.00. In this case, the pair may continue falling towards 90.00. To confirm a further uptrend, the price must break the descending channel’s upside border and fix above 109.55.
GBPUSD, “Great Britain Pound vs US Dollar”
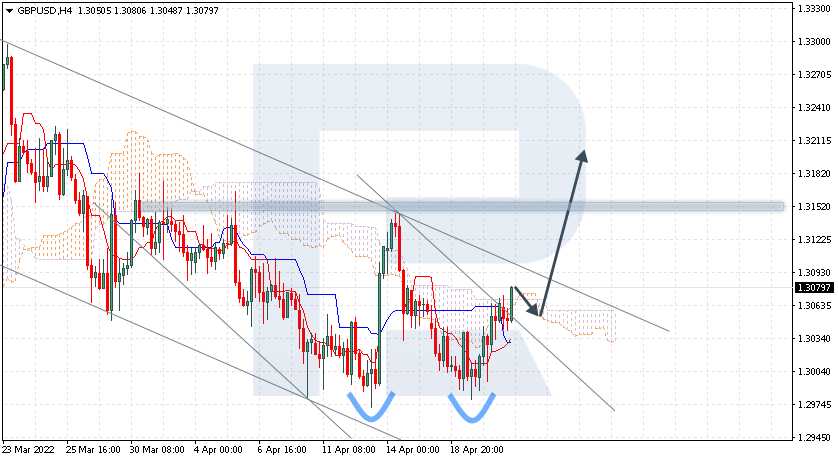
Having rebounded from the support level, GBPUSD is growing at 1.3079; the daily chart has the potential for the completion of a Double Bottom reversal pattern. To complete the pattern, the price must break 1.3155, and the pattern materialisation target will be at 1.3300. The instrument is currently moving above Ichimoku Cloud, thus indicating an ascending tendency. The markets could indicate that the price may test the cloud’s downside border at 1.3050 and then resume moving upwards to reach 1.3270. Another signal in favour of a further uptrend will be a rebound from the descending channel’s upside border. However, the bullish scenario may no longer be valid if the price breaks the cloud’s downside border and fixes below 1.3005. In this case, the pair may continue falling towards 1.2910. To confirm a further uptrend, the price must break the descending trendline and fix above 1.3115.
Attention! Forecasts presented in this section only reflect the author’s private opinion and should not be considered as guidance for trading. RoboForex LP bears no responsibility for trading results based on trading recommendations described in these analytical reviews.
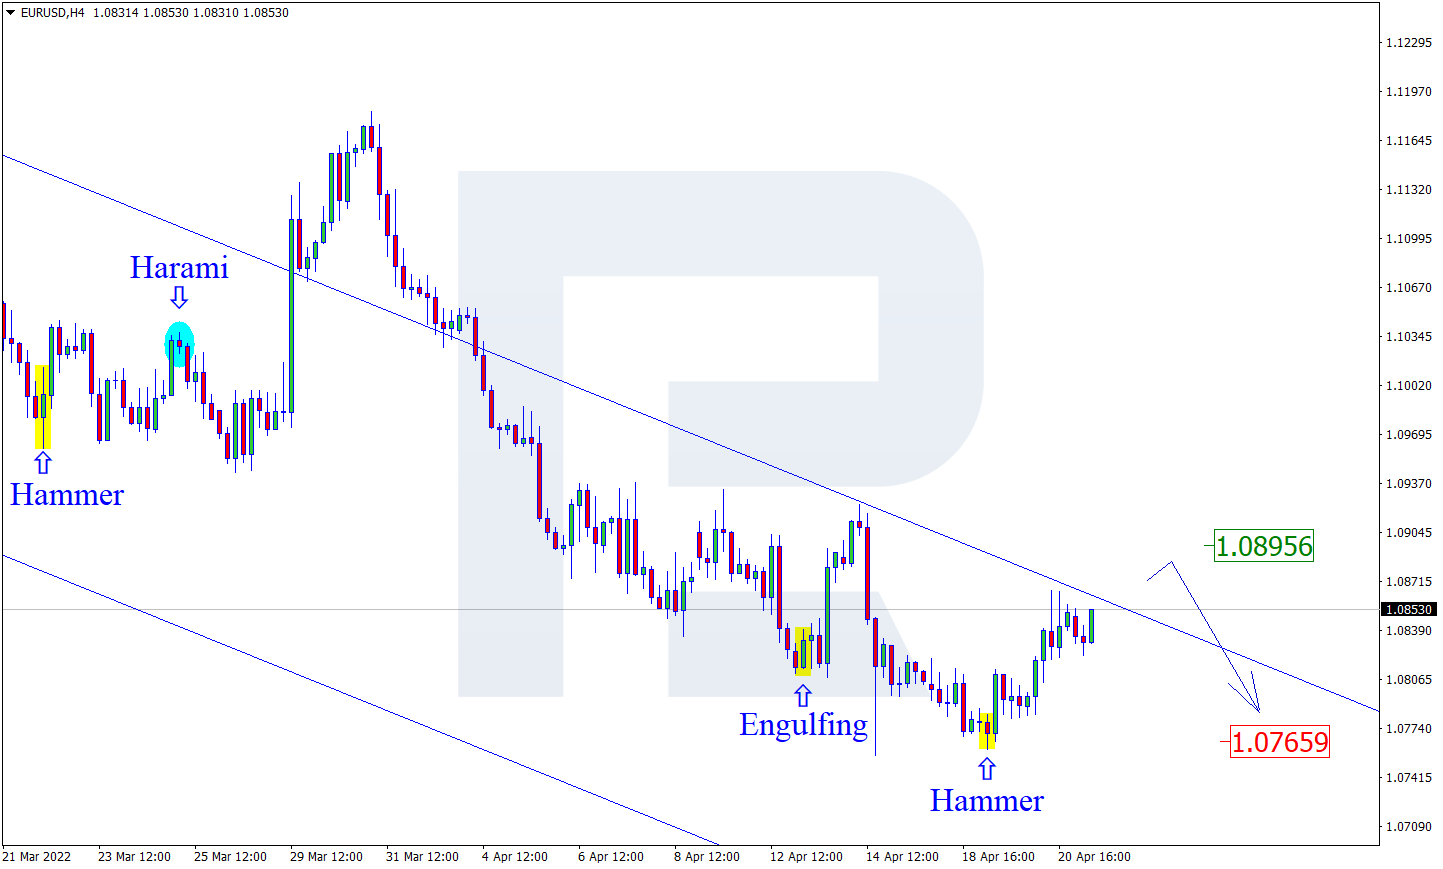
As we can see in the H4 chart, the asset has formed a Hammer reversal pattern close to the support area. At the moment, EURUSD is reversing in the form of a new correctional impulse. In this case, the upside correctional target may be at 1.0895. However, an alternative scenario implies that the price may fall to reach 1.0765 and continue the descending tendency without any corrections towards the resistance level.
USDJPY, “US Dollar vs Japanese Yen”
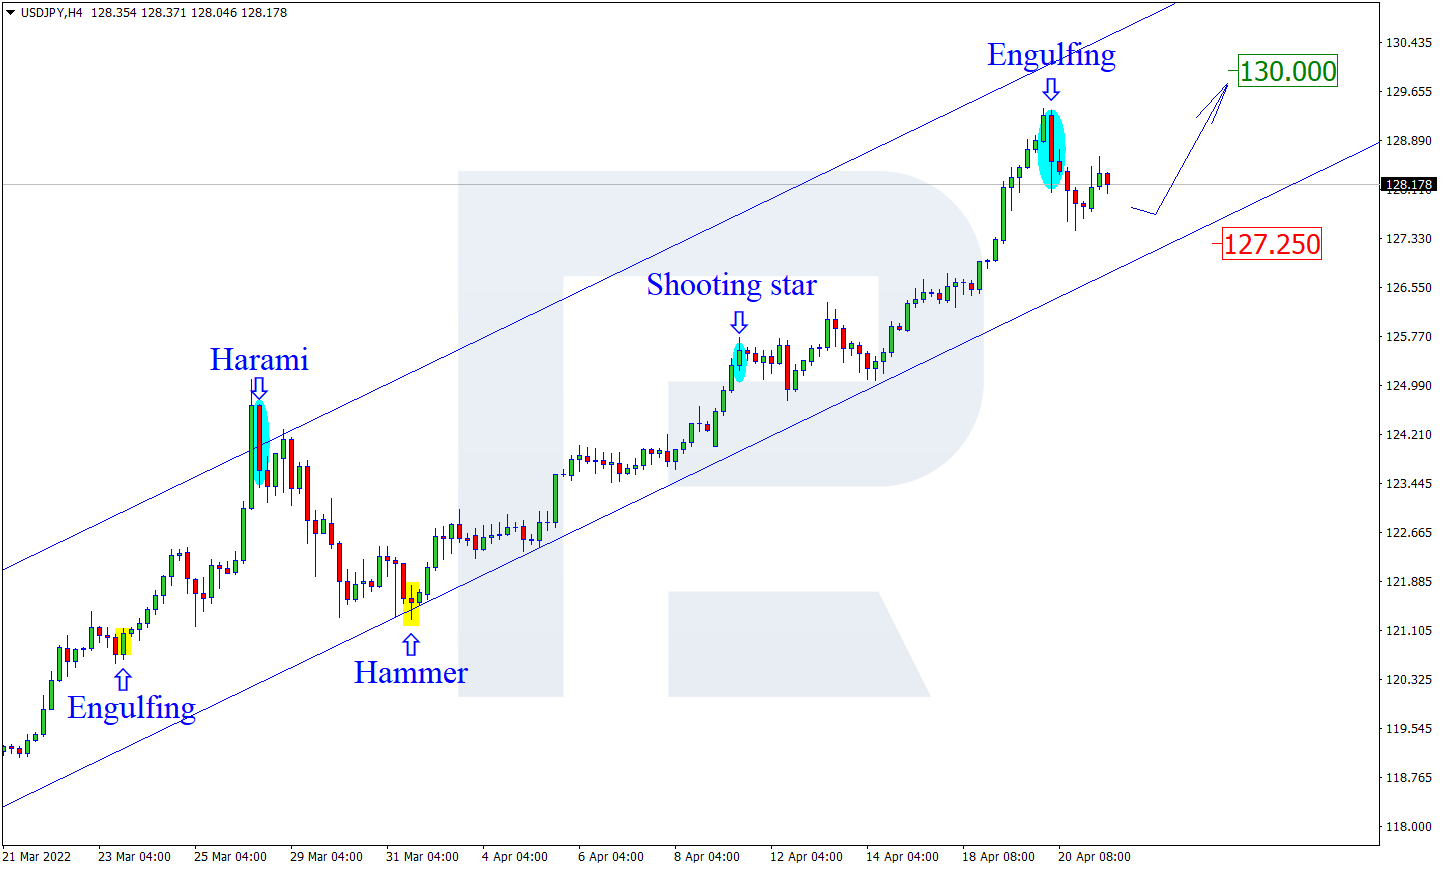
As we can see in the H4 chart, USDJPY has formed an Engulfing pattern not far from the resistance level. At the moment, the asset is reversing in the form of a new correctional impulse. In this case, the downside correctional target may be at 127.25. At the same time, an opposite scenario implies that the price may grow to reach 130.00 and continue the uptrend without any pullbacks.
EURGBP, “Euro vs Great Britain Pound”
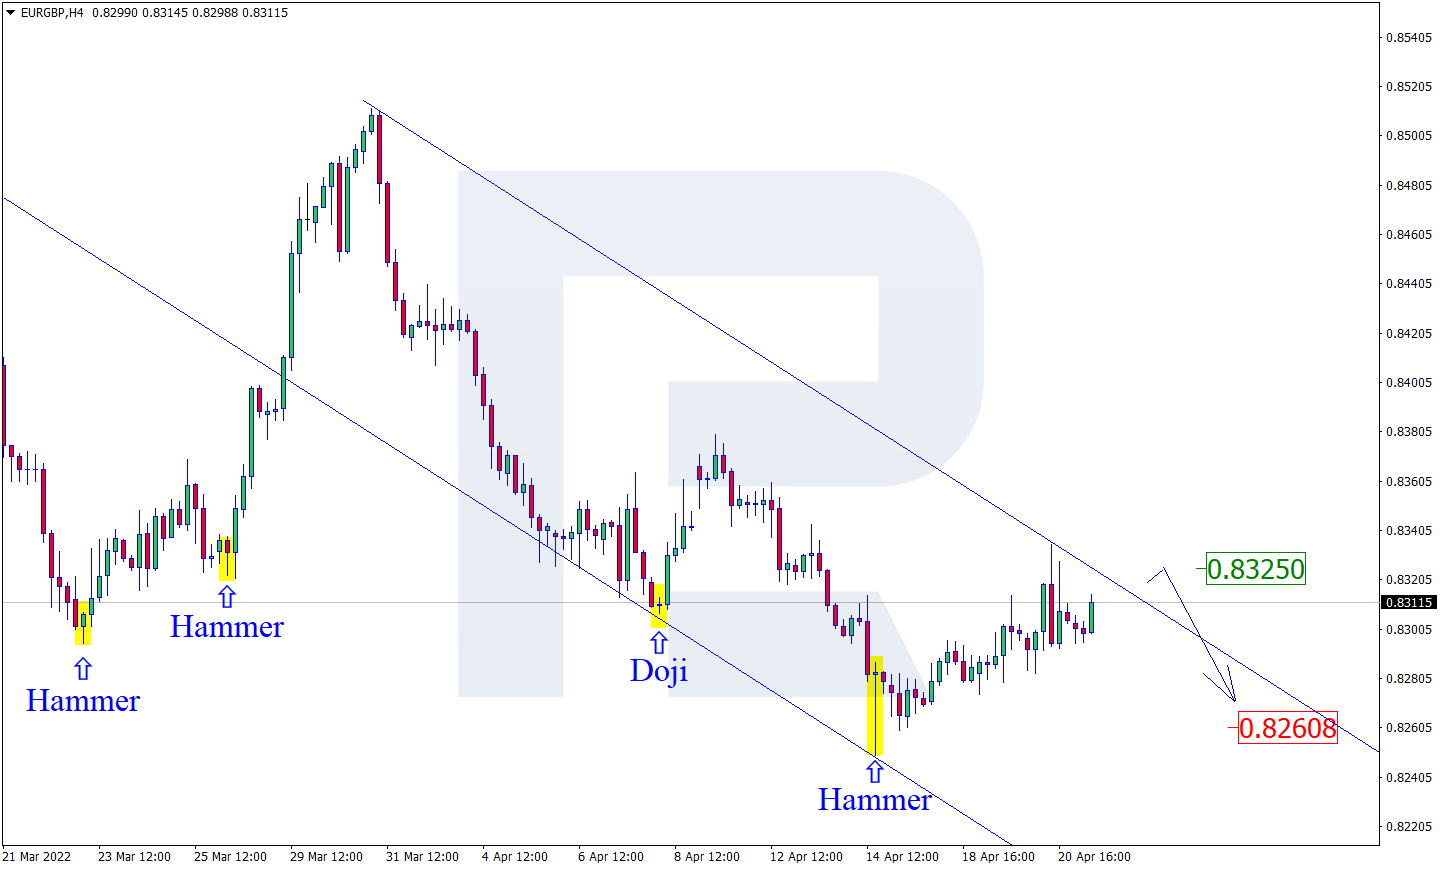
As we can see in the H4 chart, after forming a Hammer reversal pattern near the support area, EURGBP is reversing and may start another ascending wave. In this case, the upside target may be at 0.8325. Later, the market may test the resistance level, rebound from it, and resume the descending impulse. Still, there might be an alternative scenario, according to which the asset may fall to reach 0.8260 and continue the downtrend without testing the resistance level.
Attention! Forecasts presented in this section only reflect the author’s private opinion and should not be considered as guidance for trading. RoboForex LP bears no responsibility for trading results based on trading recommendations described in these analytical reviews.
Yesterday ECB officials said that the bond-buying program will be completed soon and the interest rate hike will depend on economic data. This is not the first time officials have said such a thing but they do not give any specific date or figure. This once again emphasizes the uncertainty of the ECB in terms of monetary policy. The producer price index, which shows inflation between factories, reached 30.9% in annual terms in Germany. It is a record figure that will undoubtedly affect consumer prices’ growth.
From the technical point of view, the trend on the EUR/USD currency pair on the hourly time frame is bearish. The price has taken a more flat structure. The MACD indicator has become inactive. Under such market conditions, it is possible to look for buy trades on intraday timeframes from the support level of 1.0800, but only with short targets and confirmation. Sell trades should be considered from the resistance level 1.0889, but only after the additional confirmation.
Alternative scenario: if the price breaks out through the 1.0958 resistance level and fixes above, the uptrend will likely resume.
News feed for 2022.04.21:
– Eurozone Consumer Price Index (m/m) at 12:00 (GMT+3);
– US Initial Jobless Claims (w/w) at 15:30 (GMT+3);
– US Philadelphia Fed Manufacturing Index (m/m) at 15:30 (GMT+3);
– Eurozone ECB President Lagarde Speaks at 20:00 (GMT+3);
– US Fed Chair Powell Speaks at 20:00 (GMT+3).
The GBP/USD currency pair
Technical indicators of the currency pair:
Prev Open: 1.2995
Prev Close: 1.3067
% chg. over the last day: +0.55%
The situation in the debt market has stabilized a bit, thanks to which the British pound has slightly recovered its position against the dollar index. Despite the fact that the UK economy is showing some stability (compared to other European countries and the US), the discontent with Boris Johnson’s government policy is growing inside the country, which caused a steep rise in the prices of food, fuel, and utilities.
On the hourly time frame, the GBP/USD currency pair trend is still bearish. The MACD indicator has become inactive, the price pullback to the moving averages. Under such market conditions, sell trades should be looked for from the resistance level of 1.3094, but with confirmation. For buy deals, traders may consider the level of 1.3022, but only after the appearance of a bullish initiative and with short targets.
Alternative scenario: if the price breaks down through the 1.3147 resistance level and fixes above, the mid-term uptrend will likely be resumed.
News feed for 2022.04.21:
– UK BoE Gov Bailey Speaks at 19:30 (GMT+3).
The USD/JPY currency pair
Technical indicators of the currency pair:
Prev Open: 128.86
Prev Close: 127.87
% chg. over the last day: -0.77%
The Bank of Japan entered the foreign exchange market and slightly strengthened the Japanese Yen yesterday. The central bank again offered to buy an unlimited amount of Japanese government bonds. The drop in the dollar against the yen also coincided with a decline in US Treasury yields. Nevertheless, the medium-term trend remains bullish as the central banks in Japan and the US now have opposite monetary policies.
Trading recommendations
Support levels: 126.69, 125.72, 124.66, 124.24, 122.97, 122.63, 121.81
Resistance levels: 128.84, 129.36
The medium-term trend on the USD/JPY currency pair is bullish. The MACD indicator has become inactive, but the divergence is still visible on the higher timeframes. Under such market conditions, it is best to look for buy deals, expecting the continuation of the uptrend, but after the price makes a pullback to the average lines. First of all, it is worth considering the support level of 126.69, but with additional confirmation. A resistance level of 128.84 may be considered for sell deals, but only with short targets.
Alternative scenario: If the price fixes below 124.66, the uptrend will likely be broken.
There is no news feed for today.
The USD/CAD currency pair
Technical indicators of the currency pair:
Prev Open: 1.2614
Prev Close: 1.2493
% chg. over the last day: -0.96%
Canada’s consumer price index increased by 1.4% last month to 6.7% in annual terms. This is the highest value since January 1991. Prices rose on all major components. Analysts attributed the price increases to persistent price pressures in the Canadian housing market, significant supply constraints, and geopolitical conflict that has affected energy, commodities, and agricultural markets. The rise in inflation is usually accompanied by the strengthening of the national currency, as investors are laying the future scenario of raising interest rates to fight inflation.
The USD/CAD currency pair is bullish in terms of technical analysis. But the price has corrected deeply, to the priority change level. The MACD indicator has become negative, with no signs of reversal. It is worth tradingvonly with short targets because, fundamentally, there are no prerequisites for the medium-term trend on the USD/CAD currency pair. Under such market conditions, it is better to look for buy trades on the lower timeframes from the support level of 1.2467, but it is better with additional confirmation. For sell deals, it is better to consider the resistance level of 1.2567, but it is also better with confirmation.
Alternative scenario: if the price breaks through and consolidates below 1.2467, the downtrend will likely be resumed.
This article reflects a personal opinion and should not be interpreted as an investment advice, and/or offer, and/or a persistent request for carrying out financial transactions, and/or a guarantee, and/or a forecast of future events.
A Fed survey shows that US firms are facing a labour shortage. “Supply chain delays, labour market tensions, and elevated production costs continue to pose challenges to firms’ ability to meet demand,” the Fed survey says. Along with record inflation, this situation could lead to a significant slowdown in economic growth if the Fed fails to make a “soft landing” of the economy. The US stock indices traded mixed yesterday. At the close of the stock market yesterday the Dow Jones index (US30) increased by 0.71%, while the S&P 500 index (US500) decreased by 0.06%. The technology index NASDAQ (US100) fell by 1.22%.
Wall Street analysts abandon their optimistic expectations as more companies show weak quarterly reports. The weakness refers to a drop in revenue and net income as well as a decline in forecasts for the next quarter.
Tesla beats Wall Street estimates for quarterly revenue. The company’s two new plants in Texas and Berlin are increasing production, and Musk delivered the first Tesla Model Y cars made in Texas earlier this month. The company’s stock jumped in the post-market session.
Procter & Gamble, the US manufacturer of household and personal care products, which owns brands such as Ariel, Tide, Lenor, Fairy, Pampers, Always, Gillette, Head & Shoulders, Pantene, and Blend-a-med, is likely to be unable to continue operating in Russia due to sanctions, supply problems and monetary controls, Reuters reported, citing a company statement. Earlier, the company stopped investing in Russia and reduced its product range.
Major European indices closed yesterday in the green zone. Germany’s DAX (DE30) gained 1.47%, France’s CAC 40 (FR 40) jumped by 1.38%, Spain’s IBEX 35 (ES35) gained 0.87%, Britain’s FTSE 100 (UK100) added 0.37%. European Union auto sales fell by 20.5% in March compared to the same month in 2021. ECB officials said yesterday that the bond-buying program will end soon and that interest rate hikes will depend on economic data. This is not the first time officials have said such a thing, but they do not give specific dates or numbers. This once again emphasizes the uncertainty of the ECB in terms of monetary policy. The producer price index, which shows inflation between factories, reached3 0.9% in the annual term in Germany. This is a record figure, which will undoubtedly be reflected in the growth of consumer prices as well.
High-ranking officials from the UK, US, and Canada left Wednesday’s G20 meeting before Russia’s speech. The UK Finance Minister Sunack wrote the following: “We are united in our condemnation of Russia’s war against Ukraine and will push for stronger international coordination to punish Russia”. German Finance Minister Christian Lindner said Russia is to blame for slow global growth, high inflation, and supply chain problems and should be isolated.
Germany will stop importing Russian oil by the end of 2022, Reuters reported citing German Foreign Affairs Minister Annalena Berbock. According to Bloomberg, Britain’s new sanctions against Russia will affect defence companies, the military, and businessmen.
The US oil inventories fell by 8 million barrels over the week. But oil prices were little changed yesterday as the Shanghai lockdown continues, significantly reducing demand for oil.
Asian stock markets traded flat yesterday. Japan’s Nikkei 225 (JP225) jumped by 0.86% yesterday, Hong Kong’s Hang Seng (HK50) fell by 0.40% and Australia’s S&P/ASX 200 (AU200) added 0.05%. Mainland Chinese and Hong Kong stock indices fell yesterday due to concerns about the Chinese economy, but a sharp drop in US long-term bond yields supported other benchmark indices. COVID-related deaths in Shanghai (three reported on Monday and seven more on Tuesday) heightened fears that the pandemic could return on a broader scale to China’s second-largest city, which has been in lockdown for weeks. The International Monetary Fund on Tuesday cut its growth forecast for China this year to 4.4%, well below Beijing’s target of about 5.5%.
Consumer prices in New Zealand increased at their fastest pace in three decades last quarter, underscoring the need for the central bank to stay on its hawkish course to keep price pressures in check without plunging the economy into recession. Inflation jumped by 1.8% in the last quarter to an annualized rate of 6.9%.
Main market quotes:
S&P 500 (F) (US500) 4,459.45 −2.76 (−0.062%)
Dow Jones (US30) 35,160.79 +249.59 (+0.71%)
DAX (DE40) 14,362.03 +208.57 (+1.47%)
FTSE 100 (UK100) 7,629.22 +27.94 (+0.37%)
USD Index 100.31 −0.65 (−0.64%)
Important events for today:
– New Zealand Consumer Price Index (q/q) at 01:45 (GMT+3);
– Australia Retail Sales (m/m) at 04:30 (GMT+3);
– Eurozone Consumer Price Index (m/m) at 12:00 (GMT+3);
– US Initial Jobless Claims (w/w) at 15:30 (GMT+3);
– US Philadelphia Fed Manufacturing Index (m/m) at 15:30 (GMT+3);
– US Natural Gas Storage (w/w) at 17:30 (GMT+3);
– UK BoE Gov Bailey Speaks at 19:30 (GMT+3);
– Eurozone ECB President Lagarde Speaks at 20:00 (GMT+3);
This article reflects a personal opinion and should not be interpreted as an investment advice, and/or offer, and/or a persistent request for carrying out financial transactions, and/or a guarantee, and/or a forecast of future events.
Currency markets exploded to life this week as global growth concerns, inflation worries, and geopolitical tensions rocked global risk sentiment.
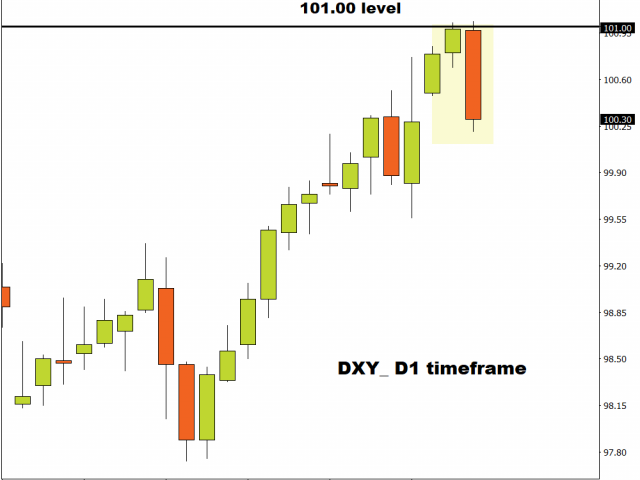
The mighty dollar jumped to a fresh two-year high yesterday only to tumble like a house of cards this morning.
There was no love for the Yen, which collapsed to a 20-year low below 129.00 before clawing back some losses. Even the Aussie made some noise by appreciating against most G10 currencies since the start of the trading week. With so much going on across the FX arena, this presents fresh opportunities and trading setups.
Our primary focus will be on yen crosses, complemented by other movers and shakers.
As stated earlier, the past few days have not been kind to the yen…
It has weakened against every single G10 currency since the start of the week.
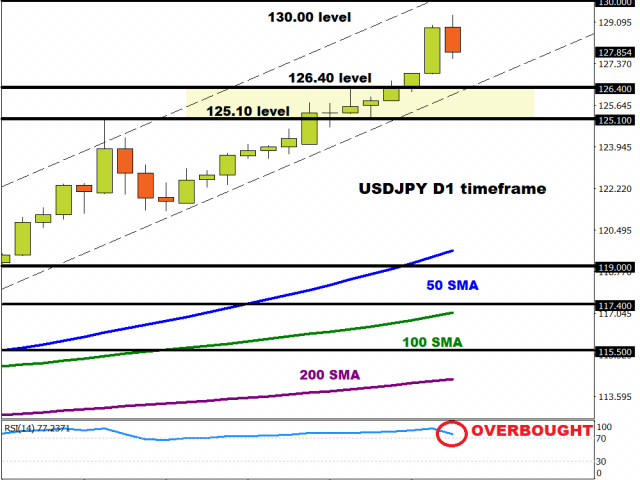
In recent weeks, after prices broke to the upside above the March high at 125.10 who would have thought that the USDJPY would test 130.00? As the fundamentals drag the yen lower and lower, 130.00 could become reality this month. Looking at the technical picture, the currency pair is heavily bullish. According to the RSI, prices are extremely overbought and have been since mid-March. A technical throwback could be in the making before the USDJPY challenges 130.00.
It may be worth keeping a close eye on how prices behave around 126.40 and 125.10 over the next few days. Should these levels prove to be reliable support, this could encourage a rebound back towards 129.00 and 130.00 respectively. A breakdown below 125.10 may invite bears back into the scene.
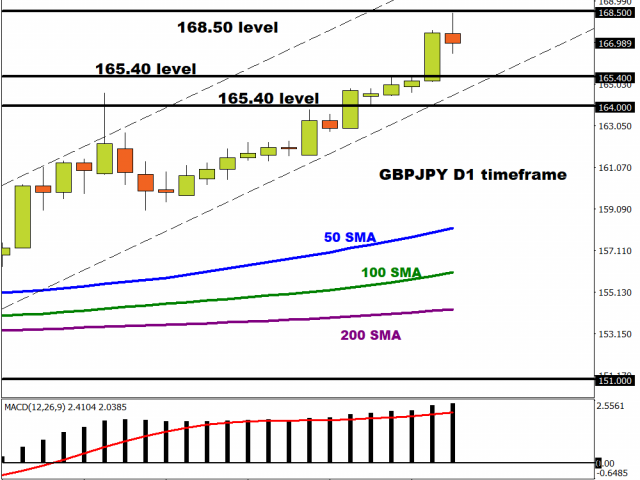
It looks like the GBPJPY could be experiencing a minor decline lower before bulls return to the scene.
Prices remain bullish on the daily charts as there have been consistently higher highs and higher lows. The MACD trades above zero while the 50, 100, and 200-day Simple Moving Averages have been left in the dust. Should 165.40 prove to be reliable support, a move back towards 168.50 could be on the cards. Alternatively, a decline below 165.40 could trigger a selloff to 165.40 and lower.
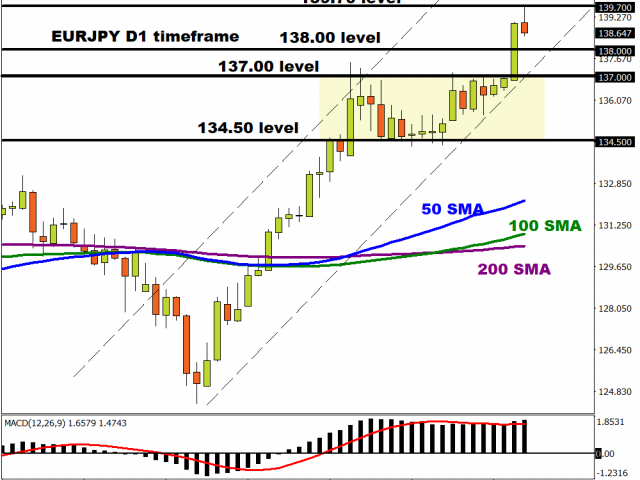
A weakening yen continues to drive the EURJPY higher. Prices remain heavily bullish as there have been consistently higher highs and higher lows. A technical bounce from 138.00 could encourage a move towards 139.70 and 140.00. Should 138.00 prove to be unreliable support, prices could slip back towards 137.00. Weakness below 137.00 may drag the EURJPY back within the 250-pip range.
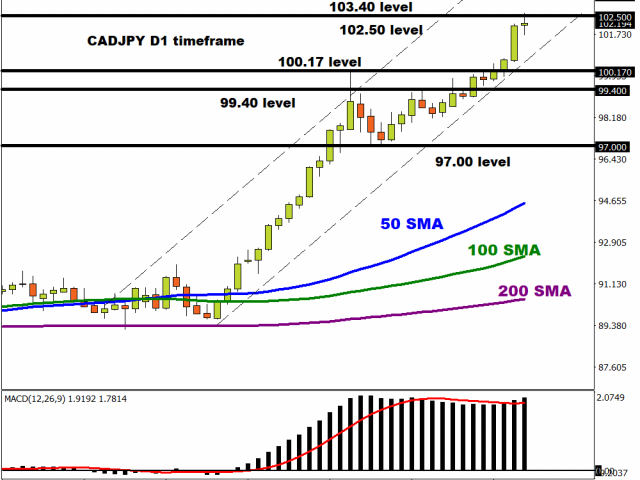
The trend is certainly a traders friend on the CADJPY. Prices are moving higher with bulls in the driving seat. A strong daily close above 102.50 could inspire an incline towards 103.40. Should 102.50 prove to be reliable resistance, a throwback towards 100.17 could be on the table before prices push higher. Weakness below 100.17 may trigger a selloff towards 99.40 and 97.00.
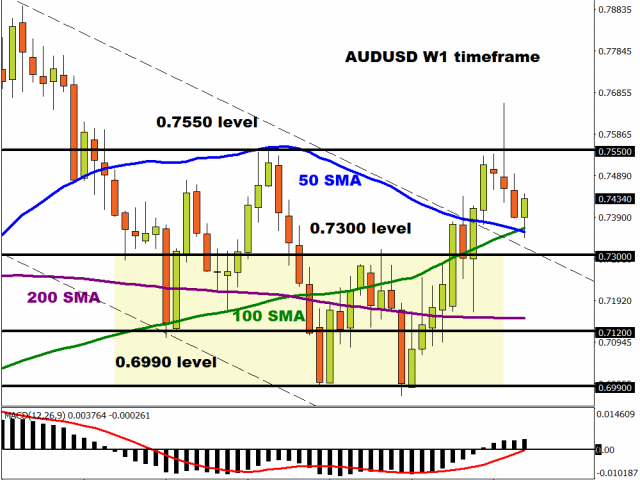
After experiencing three consecutive weeks of losses, the AUDUSD is attempting to stage a rebound. Prices are trading around 0.7430 as of writing while the MACD on the weekly timeframe trades above zero. A strong move above last week’s high of 0.7492 could signal an incline back towards the 0.7550 resistance level. If 0.7550 is conquered, this may open doors towards 0.7600 and beyond. Alternatively, weakness below 0.7300 may result in a selloff towards 0.7120.
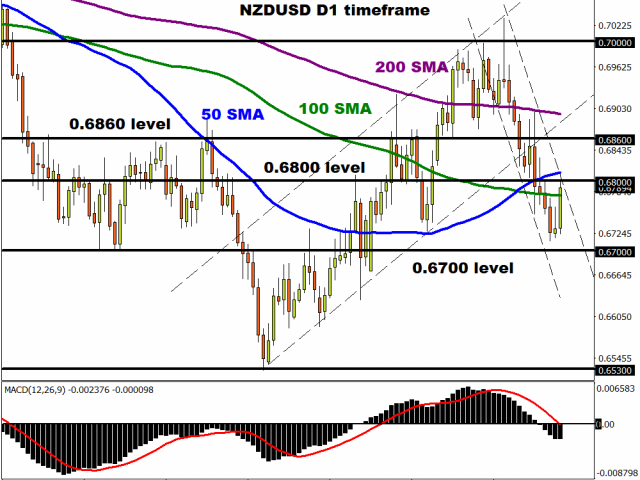
The NZDUSD remains bearish on the daily charts. However, today’s rebound could throw the spanner in the works for bulls. If the 0.6800 level proves to be reliable resistance, a decline back towards 0.6700 is likely. Alternatively, a strong move and daily close above 0.6800 could trigger a move higher to 0.6860 and 0.7000.
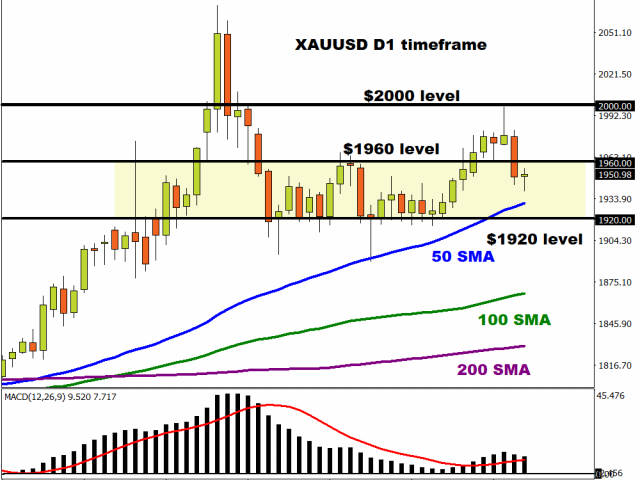
After experiencing a heavy selloff yesterday, gold has found itself back within a range with support at $1920 and resistance at $1960. The precious metal may need a fresh fundamental spark to experience another breakout/down. In the meantime, it may be wise to sit back and enjoy the view.
Disclaimer: The content in this article comprises personal opinions and should not be construed as containing personal and/or other investment advice and/or an offer of and/or solicitation for any transactions in financial instruments and/or a guarantee and/or prediction of future performance. ForexTime (FXTM), its affiliates, agents, directors, officers or employees do not guarantee the accuracy, validity, timeliness or completeness, of any information or data made available and assume no liability as to any loss arising from any investment based on the same.
Tomorrow we get European CPI figures, which usually don’t move the market. That’s because we get each constituent country’s CPI figures earlier, so there isn’t much of a surprise.
However, these are not “usual” times, particularly given the context of Europe’s exposure to the war in Ukraine. And, most importantly, March figures are the first to show the full impact of the war.
Normally, as the largest economy, German price variations set the tone for the markets. But given the current situation, the disparity of impacts on the economies could once again become an issue. Germany is the most exposed to the war in Russia because of natural gas, coal, and steel imports. Other countries could avoid some of the impact of price hikes, such as France. But, because both are in the eurozone, this would balance out the headline figure for inflation.
At the same time, it might motivate a change in the flow of goods, as consumers seek to find bargains in the common market. Meaning that countries already impacted by high prices, could also get a second hit by fleeing consumers.
Where are we going?
Yesterday, an opinion piece in Handelsblatt mentioned that Germany was already in stagflation. The release of GDP data later in the month could confirm this. Germany already has one quarter of negative growth, meaning it could be falling into a technical recession. And the latest data doesn’t help.
Earlier today, Germany reported that producer prices shot up 30.9% last month, above estimates. That’s the worst data since 1941 – in the middle of World War II.
Of course, producer prices aren’t the same as inflation. But if German companies are seeing their materials costs rise near hyperinflation levels, some of that will be passed on to consumers.
What data to focus on
Needless to say, the massive increase in raw material costs is driven by the need to shift away from Russian supplies.
The problem is that even if Russia brings the war to an end before May 9th, as some speculate, the move to divest from Russia won’t be over. Higher prices for energy in Germany are here to stay. That said, the “temporary” spike in non-core inflation from food and especially energy, will quickly bleed over into the core measure the ECB uses.
Economists project tomorrow’s core CPI for the eurozone will come in at an annual rate of 3.0%, up from 2.7% prior. But the headline rate (including food and energy) could accelerate to 7.5% from 5.9% prior.
The upcoming monetary policy problem
With inflation rising, the central bank will have to tighten its policy to get prices under control.
However, like the problem the Fed is facing, the rising prices in Europe aren’t due to something under ECB control. It’s a primarily political problem, given the geostrategic situation. If the ECB raises rates, it doesn’t mean that Germany can go back to buying Russian coal or stop the phase-out of Russian natural gas.
As core inflation picks up, the ECB might have to raise rates more than currently anticipated, which might help the euro in the short term.
Nonetheless, with higher costs, and higher capital costs, it will be hard for European businesses to make headway in the long term. In turn, the euro could subsequently weaken as we get GDP data.
Orbex is a fully licensed broker that was established in 2011. Founded with a mission to serve its traders responsibly and provides traders with access to the world’s largest and most liquid financial markets. www.orbex.com
The latest reports from the Intergovernmental Panel on Climate Change show that to avoid massive losses and damage from global warming, nations must act quickly to reduce their greenhouse gas emissions. The good news is that experts believe it’s possible to cut global greenhouse gas emissions in half by 2030 through steps such as using energy more efficiently, slowing deforestation and speeding up the adoption of renewable energy.
Many of those strategies require new laws, regulations or funding to move forward at the speed and scale that’s needed. But one strategy that’s increasingly feasible for many consumers is powering their homes and devices with electricity from clean sources. These four articles from our archives explain why electrifying homes is an important climate strategy and how consumers can get started.
1. Why go electric?
As of 2020, home energy use accounted for about one-sixth of total U.S. energy consumption. Nearly half (47%) of this energy came from electricity, followed by natural gas (42%), oil (8%) and renewable energy (7%). By far the largest home energy use is for heating and air conditioning, followed by lighting, refrigerators and other appliances.
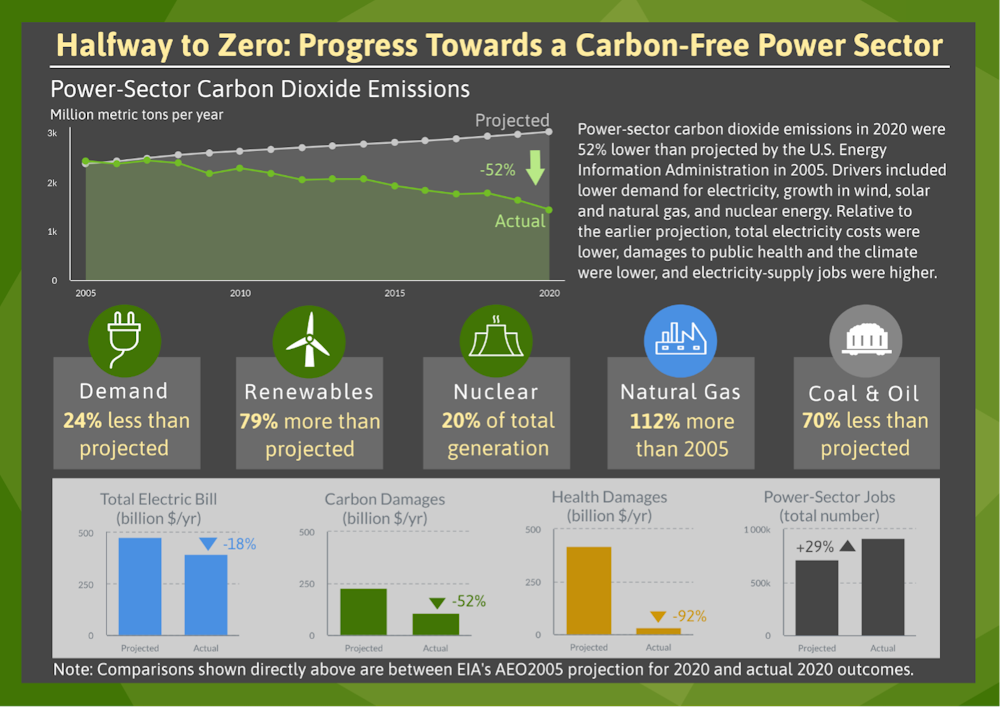
The most effective way to reduce greenhouse gas emissions from home energy consumption is to substitute electricity generated from low- and zero-carbon sources for oil and natural gas. And the power sector is rapidly moving that way: As a 2021 report from Lawrence Berkeley National Laboratory showed, power producers have reduced their carbon emissions by 50% from what energy experts predicted in 2005.
“This drop happened thanks to policy, market and technology drivers,” a team of Lawrence Berkeley lab analysts concluded. Wind and solar power have scaled up and cut their costs, so utilities are using more of them. Cheap natural gas has replaced generation from dirtier coal. And public policies have encouraged the use of energy-efficient technologies like LED light bulbs. These converging trends make electric power an increasingly climate-friendly energy choice.
The U.S. is using much more low-carbon and carbon-free electricity today than projected in 2005. Lawrence Berkeley Laboratory, CC BY-ND
2. Heat pumps for cold and hot days
Since heating and cooling use so much energy, switching from an oil- or gas-powered furnace to a heat pump can greatly reduce a home’s carbon footprint. As University of Dayton sustainability expert Robert Brecha explains, heat pumps work by moving heat in and out of buildings, not by burning fossil fuel.
“Extremely cold fluid circulates through coils of tubing in the heat pump’s outdoor unit,” Brecha writes. “That fluid absorbs energy in the form of heat from the surrounding air, which is warmer than the fluid. The fluid vaporizes and then circulates into a compressor. Compressing any gas heats it up, so this process generates heat. Then the vapor moves through coils of tubing in the indoor unit of the heat pump, heating the building.”
In summer, the process reverses: Heat pumps take energy from indoors and move that heat outdoors, just as a refrigerator removes heat from the chamber where it stores food and expels it into the air in the room where it sits.
Another option is a geothermal heat pump, which collects warmth from the earth and uses the same process as air source heat pumps to move it into buildings. These systems cost more, since installing them involves excavation to bury tubing below ground, but they also reduce electricity use.
3. Cooking without gas – or heat
For people who like to cook, the biggest sticking point of going electric is the prospect of using an electric stove. Many home chefs see gas flames as more responsive and precise than electric burners.
But magnetic induction, which cooks food by generating a magnetic field under the pot, eliminates the need to fire up a burner altogether.
“Instead of conventional burners, the cooking spots on induction cooktops are called hobs, and consist of wire coils embedded in the cooktop’s surface,” writes Binghamton University electrical engineering professor Kenneth McLeod.
Moving an electric charge through those wires creates a magnetic field, which in turn creates an electric field in the bottom of the cookware. “Because of resistance, the pan will heat up, even though the hob does not,” McLeod explains.
Induction cooktops warm up and cool down very quickly and offer highly accurate temperature control. They also are easy to clean, since they are made of glass, and safer than electric stoves since the hobs don’t stay hot when pans are lifted off them. Many utilities are offering rebates to cover the higher cost of induction cooktops.
4. Electric cars as backup power sources
Electrifying systems like home heating and cooking made residents even more vulnerable to power outages. Soon, however, a new backup system could become available: powering your home from your electric vehicle.
With interest in electric cars and light trucks rising in the U.S., auto makers are introducing many new EV models and designs. Some of these new rides will offer bidirectional charging – the ability to charge a car battery at home, then move that power back into the house, and eventually, into the grid.
Only a few models offer this capacity now, and it requires special equipment that can add several thousand dollars to the price of an EV. But Penn State energy expert Seth Blumsack sees value in this emerging technology.
“Enabling homeowners to use their vehicles as backup when the power goes down would reduce the social impacts of large-scale blackouts. It also would give utilities more time to restore service – especially when there is substantial damage to power poles and wires,” Blumsack explains. “Bidirectional charging is also an integral part of a broader vision for a next-generation electric grid in which millions of EVs are constantly taking power from the grid and giving it back – a key element of an electrified future.”
Editor’s note: This story is a roundup of articles from The Conversation’s archives.
The U.S. Federal Reserve is likely to fail on inflation again by hitting the brakes too hard at its meeting next month and this could send the world’s largest economy into recession, which would have global implications.
This is the stark warning from Nigel Green, chief executive and founder of deVere Group, one of the world’s largest independent financial advisory, asset management and fintech organisations.
It comes as Federal Reserve Bank of St. Louis President James Bullard said the U.S. central bank needs to move quickly to raise interest rates to around 3.5% this year with multiple half-point hikes and that it shouldn’t rule out rate increases of 75 basis points.
The deVere CEO comments: “After failing to act in time, and with any vigour, the Federal Reserve is now fighting inflation that runs hot at 8.5% – the fastest pace for 41 years.
“The Fed has already failed on inflation with its grand-scale inaction early on. It made a massive miscalculation by the most influential central bank.
“It must not now fail again by hitting the brakes too hard at its meeting next month, and future ones, with excessive rate hikes, which could push the world’s largest economy not only into a short-term but a longer-term recession.”
He continues: “This would not only be a huge issue for the U.S. but the global economy too. As the saying goes, ‘When America sneezes, the world catches a cold.’
“There’s a real risk that oversized interest rate hikes would cause a recession and they may not even slow inflation as the soaring prices are triggered by supply chain issues, the Russia-Ukraine war, and lockdowns in China causing new bottlenecks, amongst other issues, which the Fed’s hikes will not solve.”
This is all enough “to spook the Fed” into a “major policy mis-step” as it tries to “recover some of its credibility” after the previous lack of decisive action as inflation was beginning to take its stranglehold, says Nigel Green.
Against this worrying backdrop of a looming recession, investors typically move away from riskier assets towards perceived ‘safe haven’ assets, such as cash. But this also needs to be considered carefully in this environment.
“Red-hot inflation means excess cash in your bank accounts will lead to losses in real value. Hardly a safe haven then for those wanting to build long-term wealth.”
He goes on to add: “As the risks of a global recession ramp up, there remains one clear way for investors to maximise returns relative to risk: the practice of portfolio diversification.”
However, last week the deVere boss also warned that the 60/40 investment portfolio is not fit for purpose in today’s sky-high inflation environment.
“For about half a century, investors have been able to create, grow and protect their wealth using the 60/40 portfolio model. 60% stocks and 40% bonds were enough to hit both goals of capital appreciation and capital preservation. This is no longer the case.”
He suggested that investors should consider diversifying into less traditional, return-enhancing asset classes.
Nigel Green concludes: “Investors need to shore-up their portfolios to shield their wealth from another Fed policy mistake that could be enough to push the economy into a recession.”
About:
deVere Group is one of the world’s largest independent advisors of specialist global financial solutions to international, local mass affluent, and high-net-worth clients. It has a network of more than 70 offices across the world, over 80,000 clients and $12bn under advisement.
The BTC is sort of reviving: the major cryptocurrency has been slowly recovering for a couple of trading sessions and trying to fix above significant resistance levels. On Wednesday afternoon, the BTC is trading at $41,438. Technically, the asset must fix above $42,300 to confirm a reversal to the upside – two days ago it seemed impossible but now it’s quite real.
Chances for further growth improved because the BTC is taking any opportunity to break the resistance area at $41,200-$41,500. The current situation is unravelling just like we expected: the stock market reached stability and the crypto sector followed.
If these positive tendencies continue, the next upside target after $42,300 will be at $44,200. According to CoinMarketCap, all Top 10 coins managed to stay “in the black”.
The ADA is following major coins and demonstrates almost a 5% growth per day. Technically, the ADA continues moving within the sideways range between $0.8630 and $0.9950. if the asset breaks the upside border, the next upside target will be at $1.1000.
The BNB also gained some weight (+3.85%) since yesterday but not as much as other cryptocurrencies. If bulls are able to keep the asset between $430 and $440, the next upside target will be at $445.
In the nearest future, Binance is planning to burn $740 million worth of BNB, that’s about 1.8 million coins. The burn would be conducted at an average price of $403 per BNB. Binance uses this tool to reduce the total number of coins. This procedure will have a positive effect on the coins that remain in circulation.
Attention! Forecasts presented in this section only reflect the author’s private opinion and should not be considered as guidance for trading. RoboForex LP bears no responsibility for trading results based on trading recommendations described in these analytical reviews.
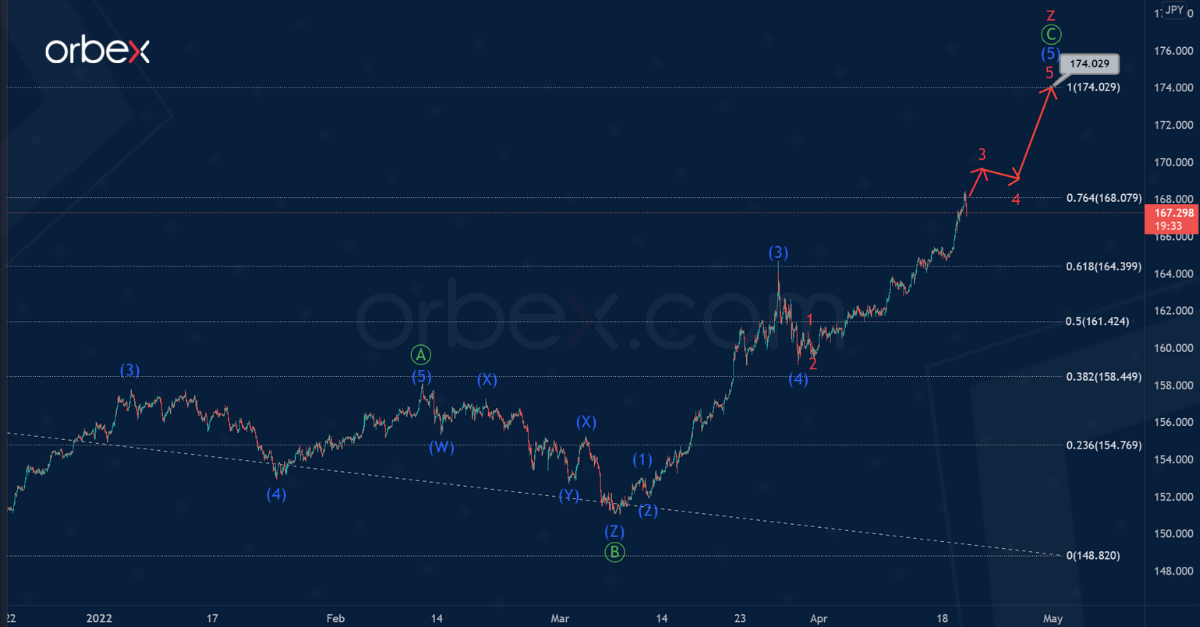
In the long term, the GBPJPY pair seems to be forming a large correction trend, taking the form of a triple zigzag. On the 1H timeframe, the final actionary wave z of the cycle degree is visible.
It is likely that the wave z takes the form of a simple zigzag Ⓐ-Ⓑ-Ⓒ of the primary degree. After the end of correction Ⓑ, which took the form of a triple combination, prices began to rise.
It is possible that the first four parts are complete as part of the potential impulse Ⓒ. The currency could now grow within the intermediate impulse (5).
The completion of the entire wave Ⓒ is possible near 174.02. At that level, wave z will be equal to wave y.
Alternatively, only the formation of the intermediate impulse (3), which is part of the primary wave Ⓒ, has come to an end.
Thus, a correction decline in the intermediate wave (4) could happen in the near future. It is possible that prices will fall to 159.74. At that level, correction (4) will be at 50% along the Fibonacci lines of impulse (3).
Orbex is a fully licensed broker that was established in 2011. Founded with a mission to serve its traders responsibly and provides traders with access to the world’s largest and most liquid financial markets. www.orbex.com








 Article by