
By InvestMacro | COT | Data Tables | COT Leaders | Downloads | COT Newsletter
Here are the latest charts and statistics for the Commitment of Traders (COT) data published by the Commodities Futures Trading Commission (CFTC).
The latest COT data is updated through Tuesday August 30th and shows a quick view of how large traders (for-profit speculators and commercial entities) were positioned in the futures markets.
Gold, Platinum and Copper lead the Weekly Speculator Changes Lower
The COT precious metals speculator bets were overall lower this week as just one out of the five metals markets we cover had higher positioning while the other four markets had lower contracts.
Free Reports:
 Get our Weekly Commitment of Traders Reports - See where the biggest traders (Hedge Funds and Commercial Hedgers) are positioned in the futures markets on a weekly basis.
 Sign Up for Our Stock Market Newsletter – Get updated on News, Charts & Rankings of Public Companies when you join our Stocks Newsletter
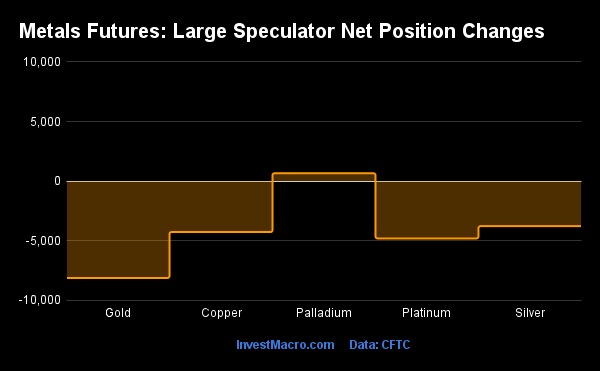
Leading the way for the precious metals markets this week was Palladium with a gain of 665 contracts.
The metals markets leading the declines in speculator bets this week was Gold (-8,113 contracts) with Platinum (-4,802 contracts), Copper (-4,265 contracts) and Silver (-3,771 contracts) also registering lower bets on the week.
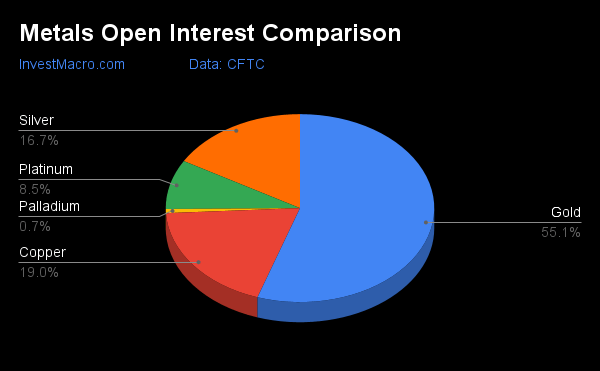
| Aug-30-2022 | OI | OI-Index | Spec-Net | Spec-Index | Com-Net | COM-Index | Smalls-Net | Smalls-Index |
|---|---|---|---|---|---|---|---|---|
| WTI Crude | 1,470,207 | 0 | 229,189 | 5 | -256,248 | 95 | 27,059 | 48 |
| Gold | 459,165 | 2 | 117,734 | 10 | -129,679 | 92 | 11,945 | 2 |
| Silver | 138,714 | 6 | -8,271 | 0 | 265 | 100 | 8,006 | 8 |
| Copper | 158,390 | 0 | -23,255 | 19 | 24,985 | 83 | -1,730 | 15 |
| Palladium | 5,875 | 0 | -1,129 | 16 | 1,323 | 82 | -194 | 33 |
| Platinum | 70,747 | 40 | -5,378 | 1 | 646 | 99 | 4,732 | 28 |
| Natural Gas | 978,881 | 4 | -128,765 | 40 | 92,463 | 60 | 36,302 | 66 |
| Brent | 180,952 | 24 | -40,013 | 44 | 36,585 | 54 | 3,428 | 56 |
| Heating Oil | 283,427 | 29 | 25,196 | 79 | -43,761 | 25 | 18,565 | 63 |
| Soybeans | 605,924 | 7 | 83,562 | 40 | -52,791 | 68 | -30,771 | 19 |
| Corn | 1,267,735 | 0 | 283,397 | 66 | -225,759 | 40 | -57,638 | 10 |
| Coffee | 193,889 | 7 | 48,687 | 81 | -50,983 | 23 | 2,296 | 21 |
| Sugar | 752,642 | 9 | 62,551 | 49 | -72,593 | 54 | 10,042 | 20 |
| Wheat | 288,545 | 0 | -11,499 | 4 | 14,914 | 81 | -3,415 | 93 |
All Metals Strength Scores are in Bearish Extreme Levels
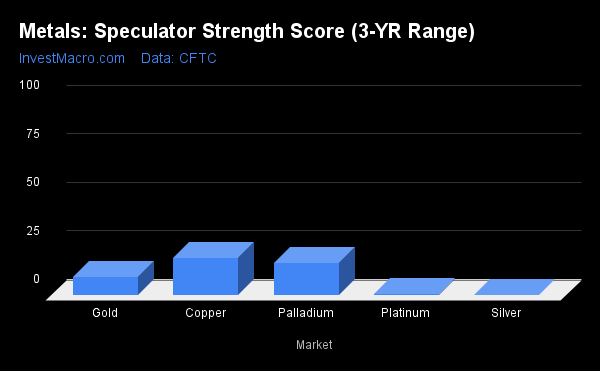
Strength scores (a measure of the 3-Year range of Speculator positions, from 0 to 100 where above 80 is extreme bullish and below 20 is extreme bearish) showed that all the metals markets continue to have very weak speculator sentiment. All markets currently have bearish extreme strength scores under 20 percent. Copper (19.4 percent) is the highest and is followed by Palladium (16.5 percent) and Gold (9.6 percent). Silver (0.0 percent) is at the absolute bottom of its 3-Year range followed by Platinum (0.7 percent) which is not far away.
Strength Statistics:
Gold (9.6 percent) vs Gold previous week (12.7 percent)
Silver (0.0 percent) vs Silver previous week (4.4 percent)
Copper (19.4 percent) vs Copper previous week (22.7 percent)
Platinum (0.7 percent) vs Platinum previous week (7.3 percent)
Palladium (16.5 percent) vs Palladium previous week (12.7 percent)
Strength Trends
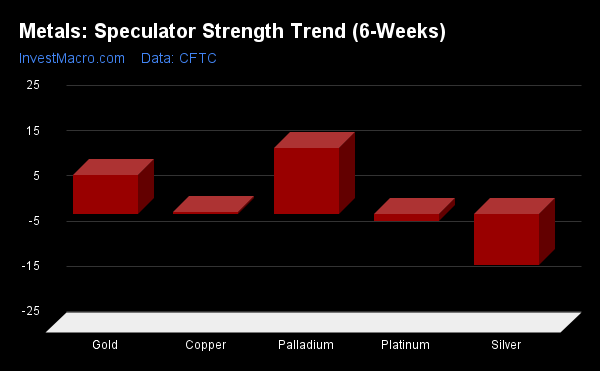
Strength Score Trends (or move index, calculates the 6-week changes in strength scores) show that Palladium (14.8 percent) leads the past six weeks trends for metals. Gold (8.7 percent) and Copper (0.5 percent) round out the other positive movers in the latest trends data.
Silver (-11.2 percent) leads the downside trend scores this week while the next market with a lower trend score was Platinum (-1.5 percent).
Move Statistics:
Gold (8.7 percent) vs Gold previous week (3.0 percent)
Silver (-11.2 percent) vs Silver previous week (-8.9 percent)
Copper (0.5 percent) vs Copper previous week (5.7 percent)
Platinum (-1.5 percent) vs Platinum previous week (7.3 percent)
Palladium (14.8 percent) vs Palladium previous week (5.7 percent)
Individual Markets:
Gold Comex Futures:
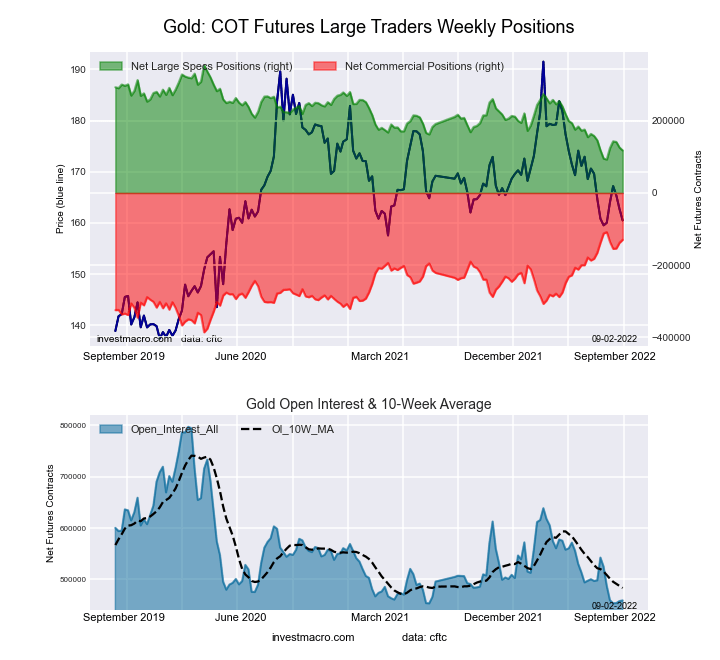 The Gold Comex Futures large speculator standing this week totaled a net position of 117,734 contracts in the data reported through Tuesday. This was a weekly decline of -8,113 contracts from the previous week which had a total of 125,847 net contracts.
This week’s current strength score (the trader positioning range over the past three years, measured from 0 to 100) shows the speculators are currently Bearish-Extreme with a score of 9.6 percent. The commercials are Bullish-Extreme with a score of 92.3 percent and the small traders (not shown in chart) are Bearish-Extreme with a score of 1.9 percent.
| Gold Futures Statistics | SPECULATORS | COMMERCIALS | SMALL TRADERS |
| – Percent of Open Interest Longs: | 51.2 | 27.6 | 8.5 |
| – Percent of Open Interest Shorts: | 25.6 | 55.8 | 5.9 |
| – Net Position: | 117,734 | -129,679 | 11,945 |
| – Gross Longs: | 235,314 | 126,535 | 38,918 |
| – Gross Shorts: | 117,580 | 256,214 | 26,973 |
| – Long to Short Ratio: | 2.0 to 1 | 0.5 to 1 | 1.4 to 1 |
| NET POSITION TREND: | |||
| – Strength Index Score (3 Year Range Pct): | 9.6 | 92.3 | 1.9 |
| – Strength Index Reading (3 Year Range): | Bearish-Extreme | Bullish-Extreme | Bearish-Extreme |
| NET POSITION MOVEMENT INDEX: | |||
| – 6-Week Change in Strength Index: | 8.7 | -6.3 | -14.7 |
Silver Comex Futures:
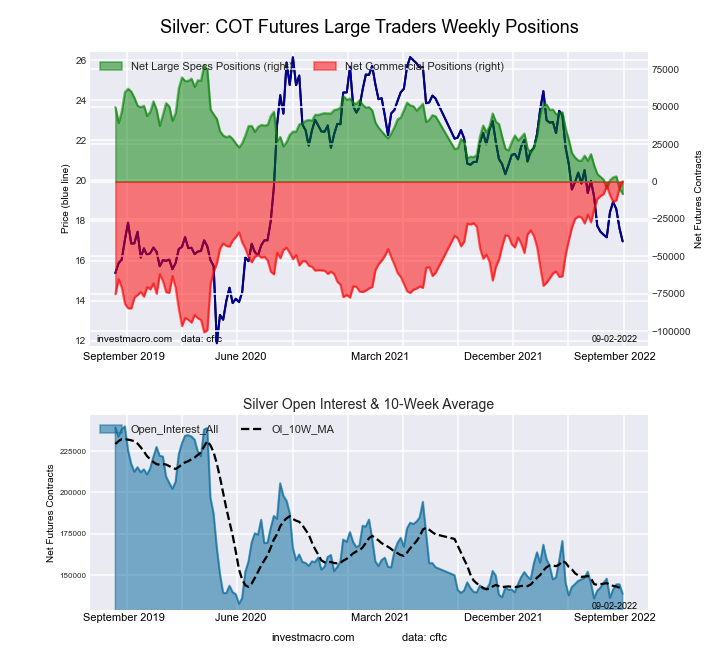 The Silver Comex Futures large speculator standing this week totaled a net position of -8,271 contracts in the data reported through Tuesday. This was a weekly lowering of -3,771 contracts from the previous week which had a total of -4,500 net contracts.
This week’s current strength score (the trader positioning range over the past three years, measured from 0 to 100) shows the speculators are currently Bearish-Extreme with a score of 0.0 percent. The commercials are Bullish-Extreme with a score of 100.0 percent and the small traders (not shown in chart) are Bearish-Extreme with a score of 7.8 percent.
| Silver Futures Statistics | SPECULATORS | COMMERCIALS | SMALL TRADERS |
| – Percent of Open Interest Longs: | 35.7 | 42.2 | 16.4 |
| – Percent of Open Interest Shorts: | 41.6 | 42.0 | 10.6 |
| – Net Position: | -8,271 | 265 | 8,006 |
| – Gross Longs: | 49,468 | 58,592 | 22,715 |
| – Gross Shorts: | 57,739 | 58,327 | 14,709 |
| – Long to Short Ratio: | 0.9 to 1 | 1.0 to 1 | 1.5 to 1 |
| NET POSITION TREND: | |||
| – Strength Index Score (3 Year Range Pct): | 0.0 | 100.0 | 7.8 |
| – Strength Index Reading (3 Year Range): | Bearish-Extreme | Bullish-Extreme | Bearish-Extreme |
| NET POSITION MOVEMENT INDEX: | |||
| – 6-Week Change in Strength Index: | -11.2 | 8.4 | 5.6 |
Copper Grade #1 Futures:
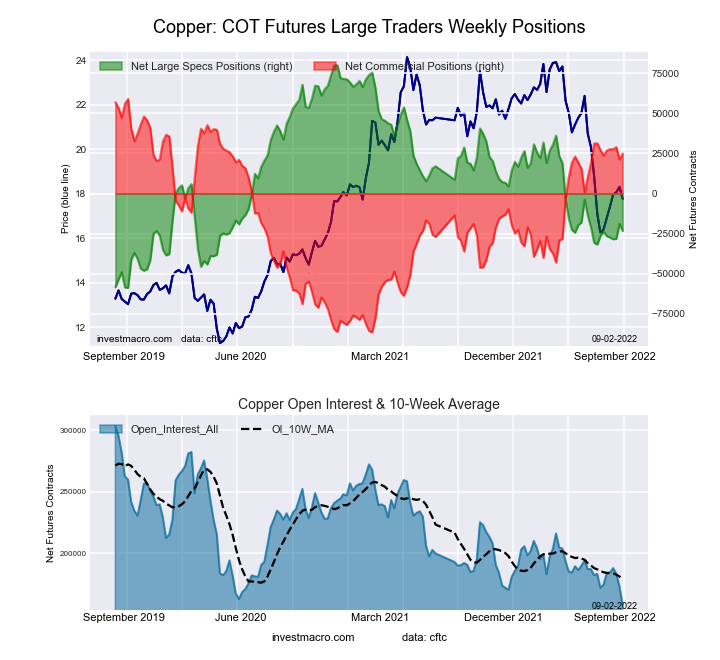 The Copper Grade #1 Futures large speculator standing this week totaled a net position of -23,255 contracts in the data reported through Tuesday. This was a weekly decrease of -4,265 contracts from the previous week which had a total of -18,990 net contracts.
This week’s current strength score (the trader positioning range over the past three years, measured from 0 to 100) shows the speculators are currently Bearish-Extreme with a score of 19.4 percent. The commercials are Bullish-Extreme with a score of 82.9 percent and the small traders (not shown in chart) are Bearish-Extreme with a score of 15.3 percent.
| Copper Futures Statistics | SPECULATORS | COMMERCIALS | SMALL TRADERS |
| – Percent of Open Interest Longs: | 29.1 | 51.8 | 8.4 |
| – Percent of Open Interest Shorts: | 43.8 | 36.0 | 9.5 |
| – Net Position: | -23,255 | 24,985 | -1,730 |
| – Gross Longs: | 46,105 | 82,023 | 13,256 |
| – Gross Shorts: | 69,360 | 57,038 | 14,986 |
| – Long to Short Ratio: | 0.7 to 1 | 1.4 to 1 | 0.9 to 1 |
| NET POSITION TREND: | |||
| – Strength Index Score (3 Year Range Pct): | 19.4 | 82.9 | 15.3 |
| – Strength Index Reading (3 Year Range): | Bearish-Extreme | Bullish-Extreme | Bearish-Extreme |
| NET POSITION MOVEMENT INDEX: | |||
| – 6-Week Change in Strength Index: | 0.5 | 0.9 | -10.5 |
Platinum Futures:
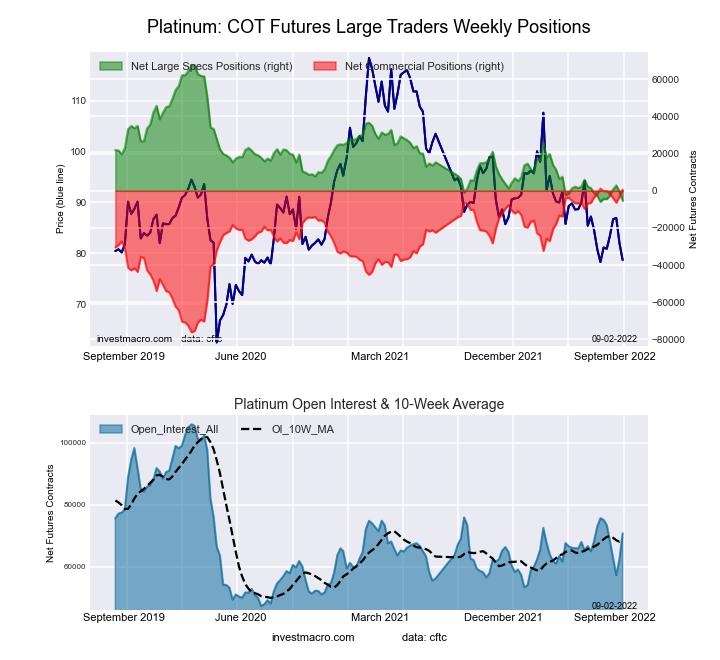 The Platinum Futures large speculator standing this week totaled a net position of -5,378 contracts in the data reported through Tuesday. This was a weekly reduction of -4,802 contracts from the previous week which had a total of -576 net contracts.
This week’s current strength score (the trader positioning range over the past three years, measured from 0 to 100) shows the speculators are currently Bearish-Extreme with a score of 0.7 percent. The commercials are Bullish-Extreme with a score of 99.2 percent and the small traders (not shown in chart) are Bearish with a score of 28.0 percent.
| Platinum Futures Statistics | SPECULATORS | COMMERCIALS | SMALL TRADERS |
| – Percent of Open Interest Longs: | 41.9 | 38.9 | 12.1 |
| – Percent of Open Interest Shorts: | 49.5 | 38.0 | 5.4 |
| – Net Position: | -5,378 | 646 | 4,732 |
| – Gross Longs: | 29,635 | 27,501 | 8,556 |
| – Gross Shorts: | 35,013 | 26,855 | 3,824 |
| – Long to Short Ratio: | 0.8 to 1 | 1.0 to 1 | 2.2 to 1 |
| NET POSITION TREND: | |||
| – Strength Index Score (3 Year Range Pct): | 0.7 | 99.2 | 28.0 |
| – Strength Index Reading (3 Year Range): | Bearish-Extreme | Bullish-Extreme | Bearish |
| NET POSITION MOVEMENT INDEX: | |||
| – 6-Week Change in Strength Index: | -1.5 | 1.2 | 2.5 |
Palladium Futures:
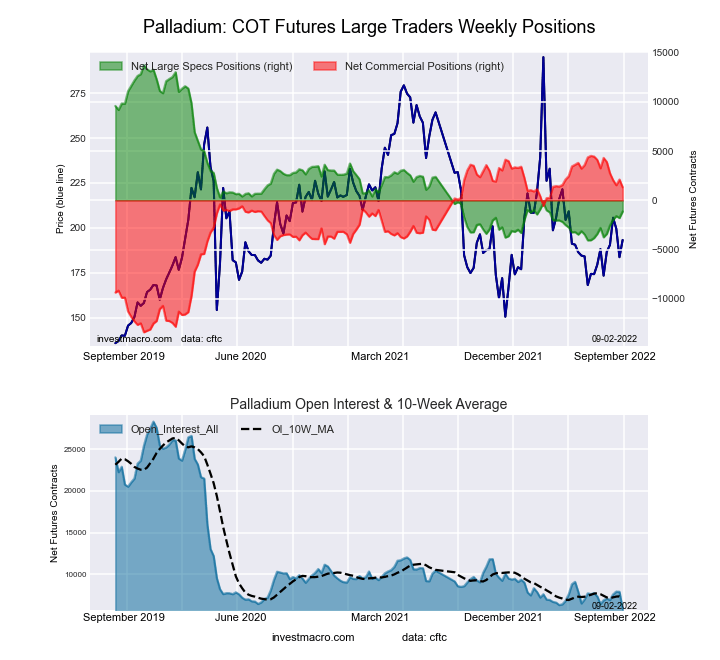 The Palladium Futures large speculator standing this week totaled a net position of -1,129 contracts in the data reported through Tuesday. This was a weekly increase of 665 contracts from the previous week which had a total of -1,794 net contracts.
This week’s current strength score (the trader positioning range over the past three years, measured from 0 to 100) shows the speculators are currently Bearish-Extreme with a score of 16.5 percent. The commercials are Bullish-Extreme with a score of 82.2 percent and the small traders (not shown in chart) are Bearish with a score of 32.6 percent.
| Palladium Futures Statistics | SPECULATORS | COMMERCIALS | SMALL TRADERS |
| – Percent of Open Interest Longs: | 24.2 | 59.1 | 15.9 |
| – Percent of Open Interest Shorts: | 43.5 | 36.6 | 19.2 |
| – Net Position: | -1,129 | 1,323 | -194 |
| – Gross Longs: | 1,424 | 3,475 | 932 |
| – Gross Shorts: | 2,553 | 2,152 | 1,126 |
| – Long to Short Ratio: | 0.6 to 1 | 1.6 to 1 | 0.8 to 1 |
| NET POSITION TREND: | |||
| – Strength Index Score (3 Year Range Pct): | 16.5 | 82.2 | 32.6 |
| – Strength Index Reading (3 Year Range): | Bearish-Extreme | Bullish-Extreme | Bearish |
| NET POSITION MOVEMENT INDEX: | |||
| – 6-Week Change in Strength Index: | 14.8 | -16.6 | 20.7 |
Article By InvestMacro – Receive our weekly COT Reports by Email
*COT Report: The COT data, released weekly to the public each Friday, is updated through the most recent Tuesday (data is 3 days old) and shows a quick view of how large speculators or non-commercials (for-profit traders) were positioned in the futures markets.
The CFTC categorizes trader positions according to commercial hedgers (traders who use futures contracts for hedging as part of the business), non-commercials (large traders who speculate to realize trading profits) and nonreportable traders (usually small traders/speculators) as well as their open interest (contracts open in the market at time of reporting). See CFTC criteria here.

- The US introduces new import tariffs for 60 countries. Brent crude surpasses $100 per barrel Jul 24, 2026
- USD/JPY Breaks Records: Nothing Slows the Yen’s Decline Jul 24, 2026
- Oil prices reached a 6‑week high. The AUD strengthened on the back of a strong labor‑market report Jul 23, 2026
- EUR/USD Recovers as Dollar Weakens Jul 23, 2026
- Bitcoin rose to $66,000. The New Zealand dollar continues to strengthen Jul 22, 2026
- Inflationary pressure is easing in Canada. In New Zealand, on the contrary, inflation is rising Jul 21, 2026
- GBP/USD Falls After Cabinet Changes Jul 21, 2026
- Geopolitical and macroeconomic conditions continue to pressure market sentiment Jul 20, 2026
- USD/JPY Poised to Continue Gains as Expensive Oil and Lack of Support Weigh on Yen Jul 20, 2026
- COT Metals Charts: Weekly Speculator Bets led by Copper & Steel Jul 18, 2026