By InvestMacro
Here are the latest charts and statistics for the Commitment of Traders (COT) data published by the Commodities Futures Trading Commission (CFTC). The COT release was delayed due to a Federal Holiday last week.
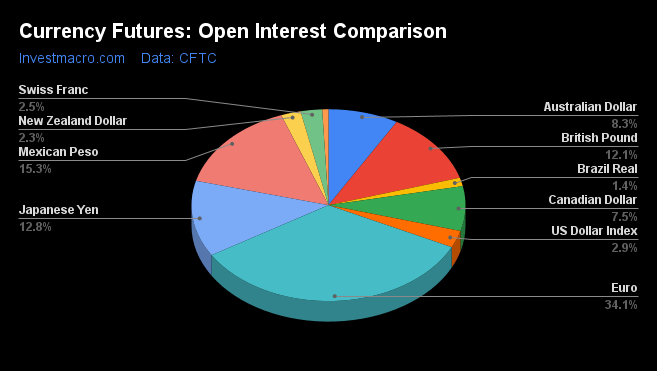
The latest COT data is updated through Tuesday November 8th and shows a quick view of how large market participants (for-profit speculators and commercial traders) were positioned in the futures markets. All currency positions are in direct relation to the US dollar where, for example, a bet for the euro is a bet that the euro will rise versus the dollar while a bet against the euro will be a bet that the euro will decline versus the dollar.
Weekly Speculator Changes led by Mexican peso & Pound Sterling
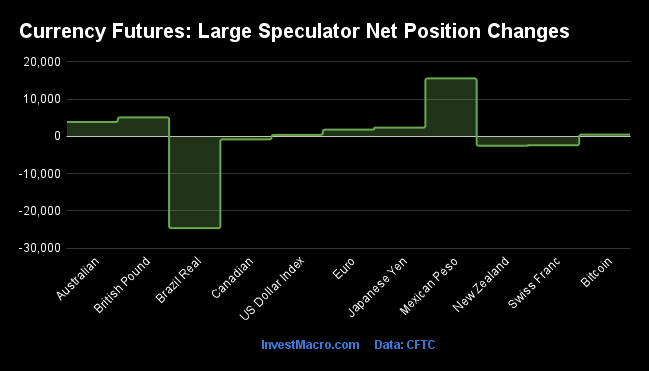
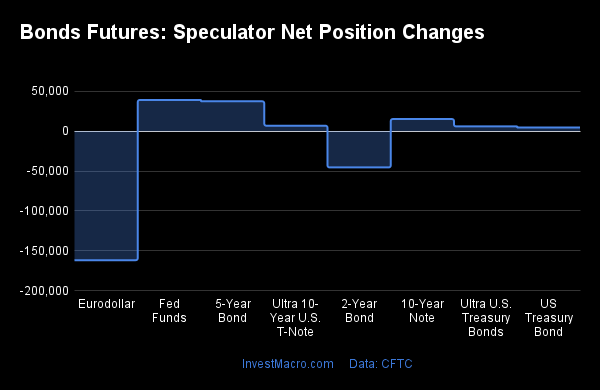
The COT currency market speculator bets were higher last week as seven out of the eleven currency markets we cover had higher positioning while the other four markets had lower speculator contracts.
Leading the gains for the currency markets was the Mexican peso (15,569 contracts) with the British pound sterling (5,101 contracts), the Australian dollar (3,849 contracts), the Japanese yen (2,362 contracts), the Euro (1,809 contracts), Bitcoin (470 contracts) and the US Dollar Index (405 contracts) also showing a positive week.
The currencies leading the declines in speculator bets last week were the Brazilian real (-24,656 contracts) with the New Zealand dollar (-2,520 contracts), the Swiss franc (-2,370 contracts) and the Canadian dollar (-815 contracts) also registering lower bets on the week.
Highlighting the COT currencies data last week was the strong gains for the Mexican peso. The large speculators raised their bullish bets for the peso by over +15,000 contracts and for the sixth consecutive week last week. These gains add up to a total rise of +100,936 net contracts over the latest six-week period and brought the overall peso positioning all the way from -41,322 contracts on September 27th to a total of +59,614 contracts on November 8th. This latest speculator level (+59,614 contracts) is the highest speculator standing since March 10th of 2020, a span of 139-weeks.
The peso’s sentiment has been boosted by the Bank of Mexico’s consistent interest rate hiking campaign to tame inflation. The Bank raised the interest rate by 75 basis points last week to a new level of 10 percent. These higher rates have helped the peso rise this year versus the US dollar as most other major currencies have been on the defensive versus the USD. The peso has climbed by over 6 percent (vs USD) while the Euro, GBP, AUD, CAD, JPY and the NZD have all declined sharply against the American currency over the year.
| Nov-08-2022 | OI | OI-Index | Spec-Net | Spec-Index | Com-Net | COM-Index | Smalls-Net | Smalls-Index |
|---|
| USD Index | 56,340 | 81 | 30,193 | 75 | -33,851 | 22 | 3,658 | 57 |
| EUR | 667,902 | 63 | 107,599 | 68 | -131,763 | 39 | 24,164 | 18 |
| GBP | 237,334 | 60 | -39,735 | 35 | 56,255 | 72 | -16,520 | 26 |
| JPY | 251,378 | 81 | -75,258 | 23 | 88,980 | 79 | -13,722 | 26 |
| CHF | 49,907 | 41 | -17,154 | 13 | 28,276 | 89 | -11,122 | 20 |
| CAD | 147,555 | 29 | -18,464 | 20 | 17,930 | 84 | 534 | 31 |
| AUD | 162,523 | 54 | -46,683 | 42 | 55,223 | 60 | -8,540 | 32 |
| NZD | 45,808 | 39 | -6,367 | 56 | 8,792 | 49 | -2,425 | 24 |
| MXN | 300,020 | 96 | 59,614 | 53 | -66,356 | 45 | 6,742 | 72 |
| RUB | 20,930 | 4 | 7,543 | 31 | -7,150 | 69 | -393 | 24 |
| BRL | 28,046 | 11 | 4,501 | 55 | -7,773 | 44 | 3,272 | 100 |
| Bitcoin | 14,439 | 84 | 18 | 77 | -449 | 0 | 431 | 23 |
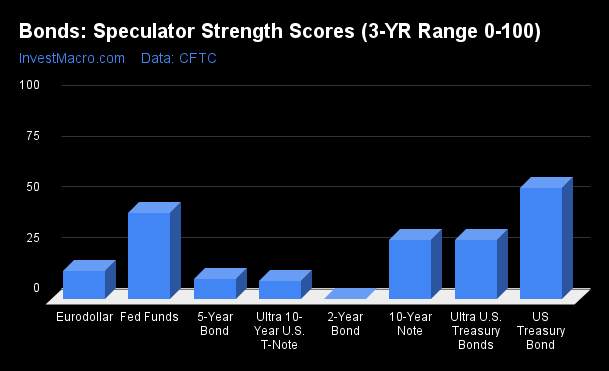
Strength Scores led by Bitcoin & US Dollar Index last week

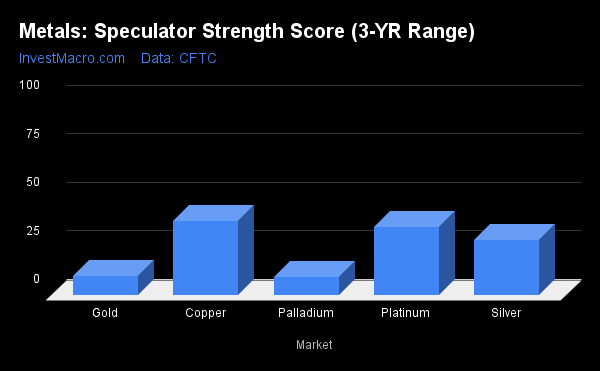
Strength Scores (a normalized measure of Speculator positions over a 3-Year range, from 0 to 100 where above 80 is extreme bullish and below 20 is extreme bearish) showed that Bitcoin (77.3 percent) and the US Dollar Index (75.3 percent) led the currency markets last week. The EuroFX (68.0 percent), the New Zealand Dollar (55.6 percent) and the Brazilian Real (54.8 percent) came in as the next highest in the currency markets for strength scores.
On the downside, the Swiss Franc (13.0 percent) and the Canadian Dollar (19.8 percent) were the lowest strength levels and were both in bearish extreme positions below 20 percent.
Strength Statistics:
US Dollar Index (75.3 percent) vs US Dollar Index previous week (74.6 percent)
EuroFX (68.0 percent) vs EuroFX previous week (67.5 percent)
British Pound Sterling (34.9 percent) vs British Pound Sterling previous week (30.5 percent)
Japanese Yen (22.5 percent) vs Japanese Yen previous week (21.1 percent)
Swiss Franc (13.0 percent) vs Swiss Franc previous week (19.0 percent)
Canadian Dollar (19.8 percent) vs Canadian Dollar previous week (20.8 percent)
Australian Dollar (41.6 percent) vs Australian Dollar previous week (38.0 percent)
New Zealand Dollar (55.6 percent) vs New Zealand Dollar previous week (60.4 percent)
Mexican Peso (52.8 percent) vs Mexican Peso previous week (46.1 percent)
Brazilian Real (54.8 percent) vs Brazilian Real previous week (79.0 percent)
Bitcoin (77.3 percent) vs Bitcoin previous week (69.1 percent)
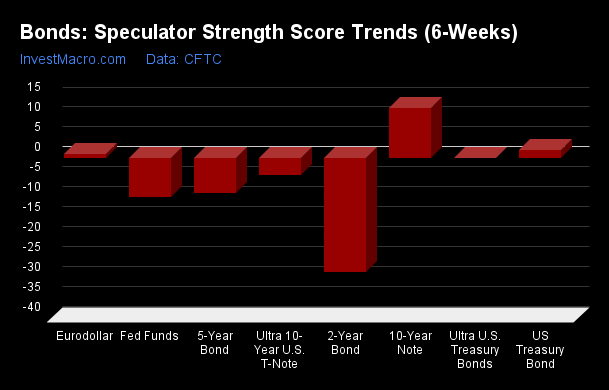
Mexican Peso topped the Strength Trends last week
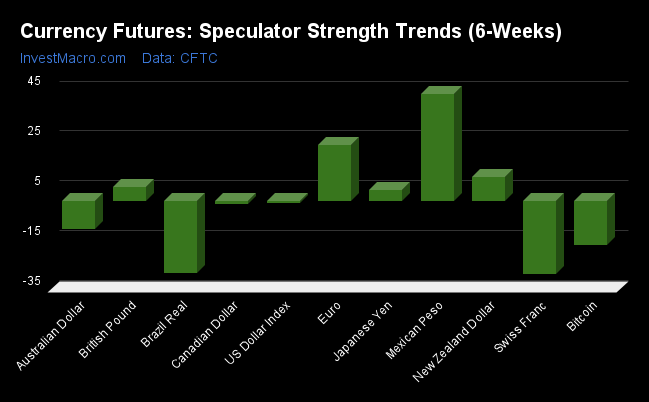
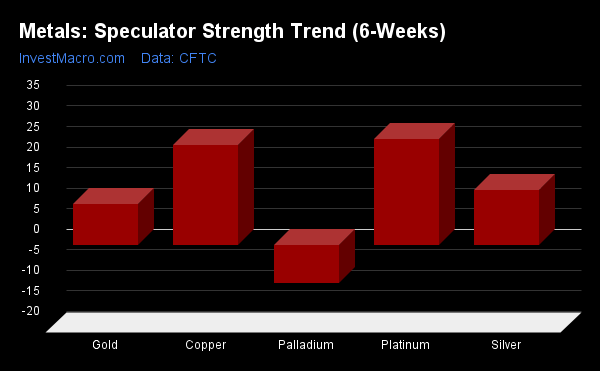
Strength Score Trends (or move index, calculates the 6-week changes in strength scores) showed that the Mexican Peso (43.0 percent) led the past six weeks trends for the currency markets. The EuroFX (22.7 percent), the New Zealand Dollar (9.6 percent) and the British Pound Sterling (5.7 percent) were the next top movers in the latest trends data.
The Swiss Franc (-29.0 percent) and the Brazilian Real (-28.8 percent) led the downside trend scores followed by Bitcoin (-17.5 percent) and the Australian Dollar (-11.2 percent).
Strength Trend Statistics:
US Dollar Index (-0.6 percent) vs US Dollar Index previous week (3.1 percent)
EuroFX (22.7 percent) vs EuroFX previous week (22.2 percent)
British Pound Sterling (5.7 percent) vs British Pound Sterling previous week (8.6 percent)
Japanese Yen (4.5 percent) vs Japanese Yen previous week (2.3 percent)
Swiss Franc (-29.0 percent) vs Swiss Franc previous week (-20.4 percent)
Canadian Dollar (-1.0 percent) vs Canadian Dollar previous week (-23.5 percent)
Australian Dollar (-11.2 percent) vs Australian Dollar previous week (-9.3 percent)
New Zealand Dollar (9.6 percent) vs New Zealand Dollar previous week (16.5 percent)
Mexican Peso (43.0 percent) vs Mexican Peso previous week (30.7 percent)
Brazilian Real (-28.8 percent) vs Brazilian Real previous week (-3.2 percent)
Bitcoin (-17.5 percent) vs Bitcoin previous week (-17.9 percent)
Individual COT Forex Markets:
US Dollar Index Futures:
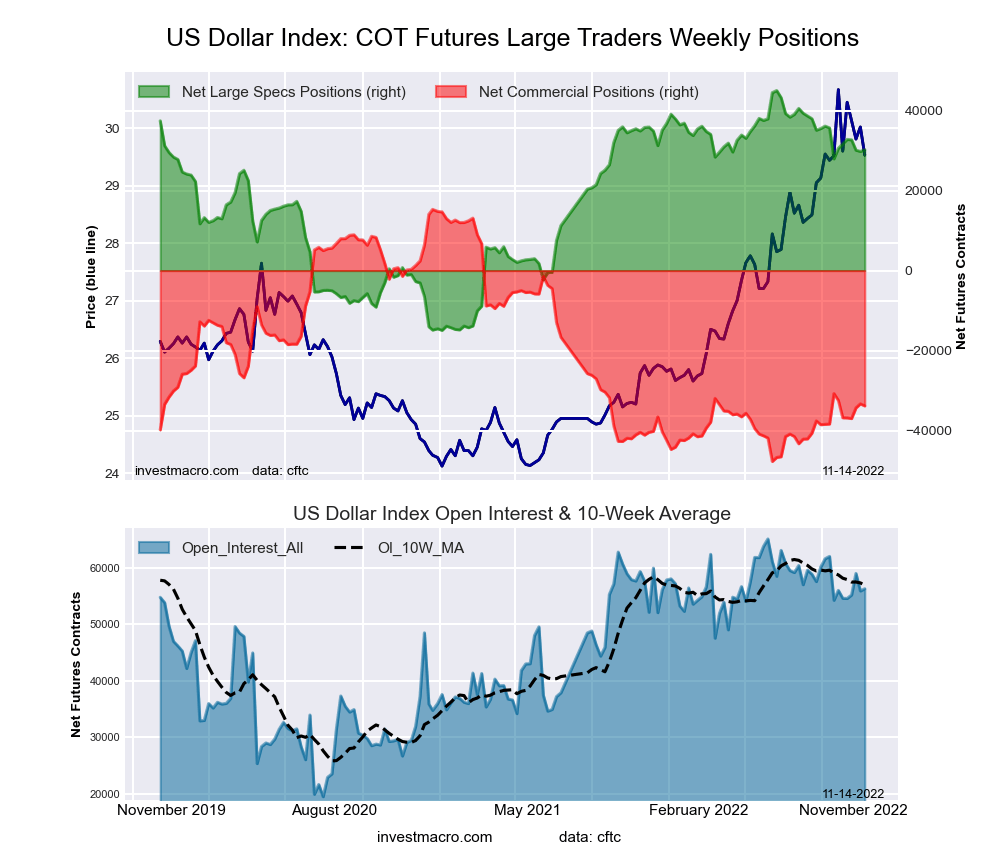 The US Dollar Index large speculator standing this week reached a net position of 30,193 contracts in the data reported through Tuesday. This was a weekly advance of 405 contracts from the previous week which had a total of 29,788 net contracts.
This week’s current strength score (the trader positioning range over the past three years, measured from 0 to 100) shows the speculators are currently Bullish with a score of 75.3 percent. The commercials are Bearish with a score of 22.0 percent and the small traders (not shown in chart) are Bullish with a score of 56.5 percent.
| US DOLLAR INDEX Statistics | SPECULATORS | COMMERCIALS | SMALL TRADERS |
| – Percent of Open Interest Longs: | 76.1 | 9.7 | 11.2 |
| – Percent of Open Interest Shorts: | 22.5 | 69.7 | 4.7 |
| – Net Position: | 30,193 | -33,851 | 3,658 |
| – Gross Longs: | 42,887 | 5,442 | 6,327 |
| – Gross Shorts: | 12,694 | 39,293 | 2,669 |
| – Long to Short Ratio: | 3.4 to 1 | 0.1 to 1 | 2.4 to 1 |
| NET POSITION TREND: | | | |
| – Strength Index Score (3 Year Range Pct): | 75.3 | 22.0 | 56.5 |
| – Strength Index Reading (3 Year Range): | Bullish | Bearish | Bullish |
| NET POSITION MOVEMENT INDEX: | | | |
| – 6-Week Change in Strength Index: | -0.6 | -2.2 | 19.0 |
Euro Currency Futures:
 The Euro Currency large speculator standing this week reached a net position of 107,599 contracts in the data reported through Tuesday. This was a weekly rise of 1,809 contracts from the previous week which had a total of 105,790 net contracts.
This week’s current strength score (the trader positioning range over the past three years, measured from 0 to 100) shows the speculators are currently Bullish with a score of 68.0 percent. The commercials are Bearish with a score of 38.6 percent and the small traders (not shown in chart) are Bearish-Extreme with a score of 17.5 percent.
| EURO Currency Statistics | SPECULATORS | COMMERCIALS | SMALL TRADERS |
| – Percent of Open Interest Longs: | 34.8 | 50.8 | 11.7 |
| – Percent of Open Interest Shorts: | 18.7 | 70.5 | 8.1 |
| – Net Position: | 107,599 | -131,763 | 24,164 |
| – Gross Longs: | 232,317 | 339,218 | 78,139 |
| – Gross Shorts: | 124,718 | 470,981 | 53,975 |
| – Long to Short Ratio: | 1.9 to 1 | 0.7 to 1 | 1.4 to 1 |
| NET POSITION TREND: | | | |
| – Strength Index Score (3 Year Range Pct): | 68.0 | 38.6 | 17.5 |
| – Strength Index Reading (3 Year Range): | Bullish | Bearish | Bearish-Extreme |
| NET POSITION MOVEMENT INDEX: | | | |
| – 6-Week Change in Strength Index: | 22.7 | -20.8 | -0.8 |
British Pound Sterling Futures:
 The British Pound Sterling large speculator standing this week reached a net position of -39,735 contracts in the data reported through Tuesday. This was a weekly lift of 5,101 contracts from the previous week which had a total of -44,836 net contracts.
This week’s current strength score (the trader positioning range over the past three years, measured from 0 to 100) shows the speculators are currently Bearish with a score of 34.9 percent. The commercials are Bullish with a score of 72.3 percent and the small traders (not shown in chart) are Bearish with a score of 25.6 percent.
| BRITISH POUND Statistics | SPECULATORS | COMMERCIALS | SMALL TRADERS |
| – Percent of Open Interest Longs: | 15.4 | 74.4 | 7.9 |
| – Percent of Open Interest Shorts: | 32.2 | 50.7 | 14.8 |
| – Net Position: | -39,735 | 56,255 | -16,520 |
| – Gross Longs: | 36,630 | 176,560 | 18,714 |
| – Gross Shorts: | 76,365 | 120,305 | 35,234 |
| – Long to Short Ratio: | 0.5 to 1 | 1.5 to 1 | 0.5 to 1 |
| NET POSITION TREND: | | | |
| – Strength Index Score (3 Year Range Pct): | 34.9 | 72.3 | 25.6 |
| – Strength Index Reading (3 Year Range): | Bearish | Bullish | Bearish |
| NET POSITION MOVEMENT INDEX: | | | |
| – 6-Week Change in Strength Index: | 5.7 | -6.1 | 4.5 |
Japanese Yen Futures:
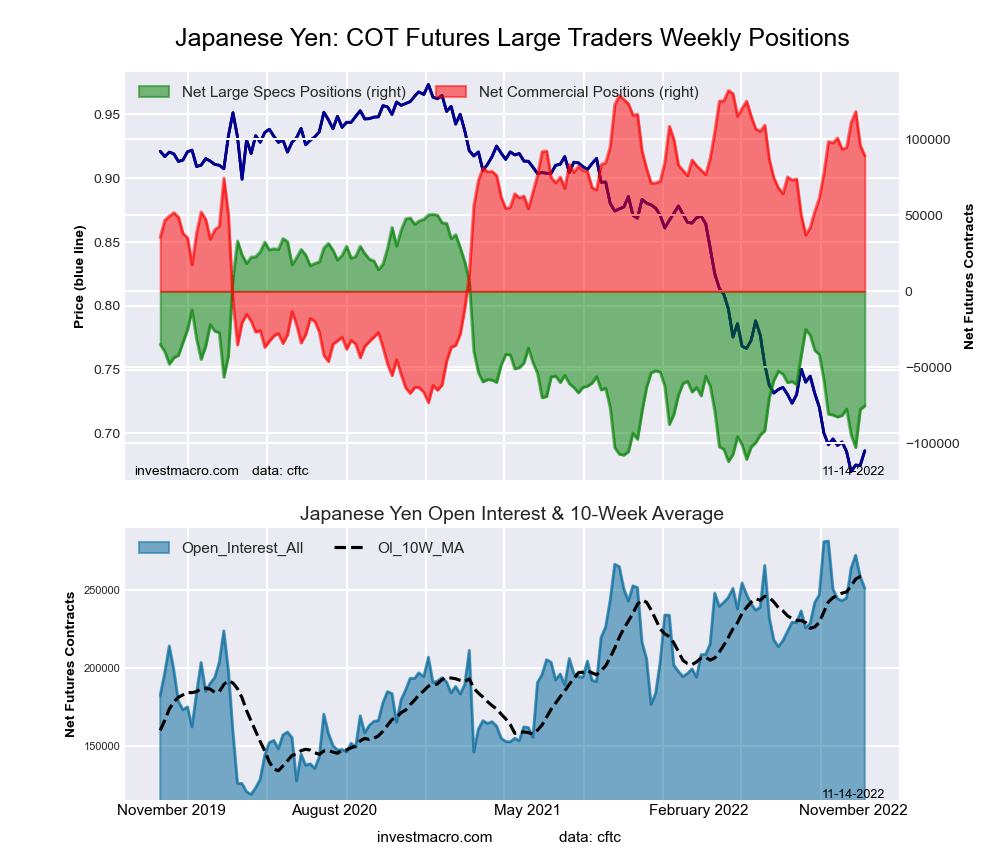 The Japanese Yen large speculator standing this week reached a net position of -75,258 contracts in the data reported through Tuesday. This was a weekly boost of 2,362 contracts from the previous week which had a total of -77,620 net contracts.
This week’s current strength score (the trader positioning range over the past three years, measured from 0 to 100) shows the speculators are currently Bearish with a score of 22.5 percent. The commercials are Bullish with a score of 79.1 percent and the small traders (not shown in chart) are Bearish with a score of 25.6 percent.
| JAPANESE YEN Statistics | SPECULATORS | COMMERCIALS | SMALL TRADERS |
| – Percent of Open Interest Longs: | 14.8 | 73.0 | 10.5 |
| – Percent of Open Interest Shorts: | 44.7 | 37.6 | 16.0 |
| – Net Position: | -75,258 | 88,980 | -13,722 |
| – Gross Longs: | 37,201 | 183,539 | 26,462 |
| – Gross Shorts: | 112,459 | 94,559 | 40,184 |
| – Long to Short Ratio: | 0.3 to 1 | 1.9 to 1 | 0.7 to 1 |
| NET POSITION TREND: | | | |
| – Strength Index Score (3 Year Range Pct): | 22.5 | 79.1 | 25.6 |
| – Strength Index Reading (3 Year Range): | Bearish | Bullish | Bearish |
| NET POSITION MOVEMENT INDEX: | | | |
| – 6-Week Change in Strength Index: | 4.5 | -5.7 | 8.8 |
Swiss Franc Futures:
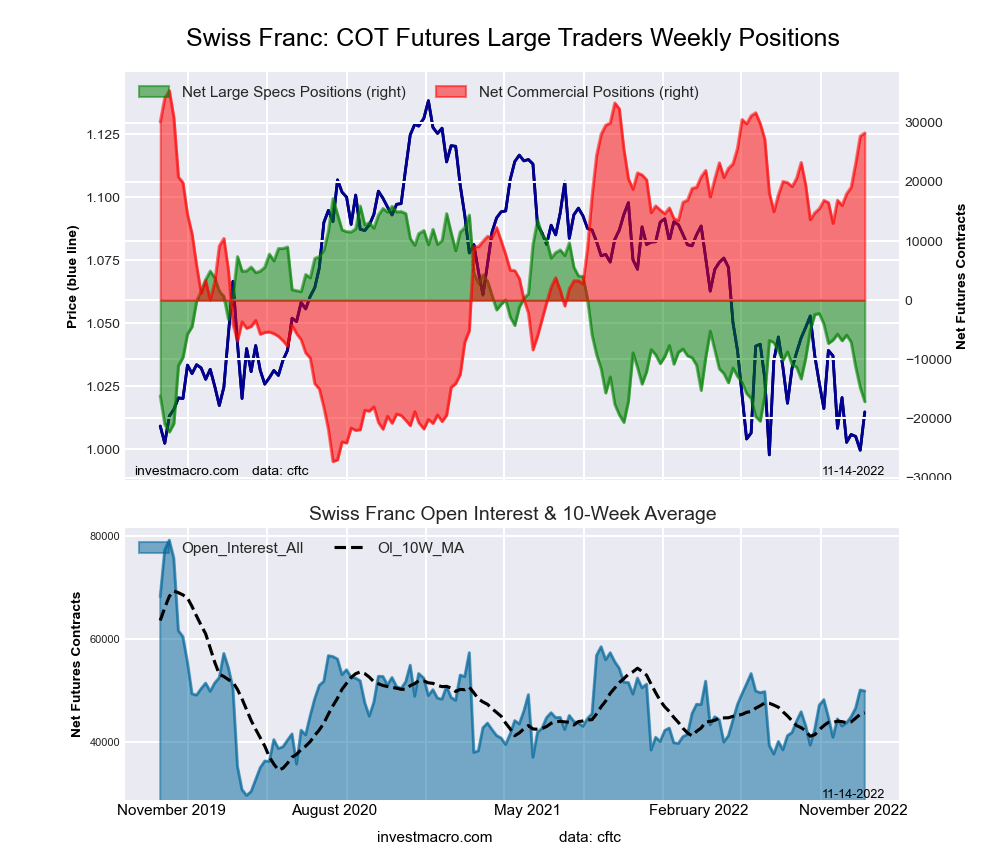 The Swiss Franc large speculator standing this week reached a net position of -17,154 contracts in the data reported through Tuesday. This was a weekly fall of -2,370 contracts from the previous week which had a total of -14,784 net contracts.
This week’s current strength score (the trader positioning range over the past three years, measured from 0 to 100) shows the speculators are currently Bearish-Extreme with a score of 13.0 percent. The commercials are Bullish-Extreme with a score of 88.6 percent and the small traders (not shown in chart) are Bearish-Extreme with a score of 19.9 percent.
| SWISS FRANC Statistics | SPECULATORS | COMMERCIALS | SMALL TRADERS |
| – Percent of Open Interest Longs: | 9.7 | 71.3 | 18.3 |
| – Percent of Open Interest Shorts: | 44.1 | 14.7 | 40.6 |
| – Net Position: | -17,154 | 28,276 | -11,122 |
| – Gross Longs: | 4,865 | 35,603 | 9,156 |
| – Gross Shorts: | 22,019 | 7,327 | 20,278 |
| – Long to Short Ratio: | 0.2 to 1 | 4.9 to 1 | 0.5 to 1 |
| NET POSITION TREND: | | | |
| – Strength Index Score (3 Year Range Pct): | 13.0 | 88.6 | 19.9 |
| – Strength Index Reading (3 Year Range): | Bearish-Extreme | Bullish-Extreme | Bearish-Extreme |
| NET POSITION MOVEMENT INDEX: | | | |
| – 6-Week Change in Strength Index: | -29.0 | 18.1 | 0.2 |
Canadian Dollar Futures:
 The Canadian Dollar large speculator standing this week reached a net position of -18,464 contracts in the data reported through Tuesday. This was a weekly fall of -815 contracts from the previous week which had a total of -17,649 net contracts.
This week’s current strength score (the trader positioning range over the past three years, measured from 0 to 100) shows the speculators are currently Bearish-Extreme with a score of 19.8 percent. The commercials are Bullish-Extreme with a score of 83.7 percent and the small traders (not shown in chart) are Bearish with a score of 31.2 percent.
| CANADIAN DOLLAR Statistics | SPECULATORS | COMMERCIALS | SMALL TRADERS |
| – Percent of Open Interest Longs: | 26.8 | 51.3 | 20.6 |
| – Percent of Open Interest Shorts: | 39.3 | 39.2 | 20.2 |
| – Net Position: | -18,464 | 17,930 | 534 |
| – Gross Longs: | 39,586 | 75,750 | 30,370 |
| – Gross Shorts: | 58,050 | 57,820 | 29,836 |
| – Long to Short Ratio: | 0.7 to 1 | 1.3 to 1 | 1.0 to 1 |
| NET POSITION TREND: | | | |
| – Strength Index Score (3 Year Range Pct): | 19.8 | 83.7 | 31.2 |
| – Strength Index Reading (3 Year Range): | Bearish-Extreme | Bullish-Extreme | Bearish |
| NET POSITION MOVEMENT INDEX: | | | |
| – 6-Week Change in Strength Index: | -1.0 | -3.1 | 9.2 |
Australian Dollar Futures:
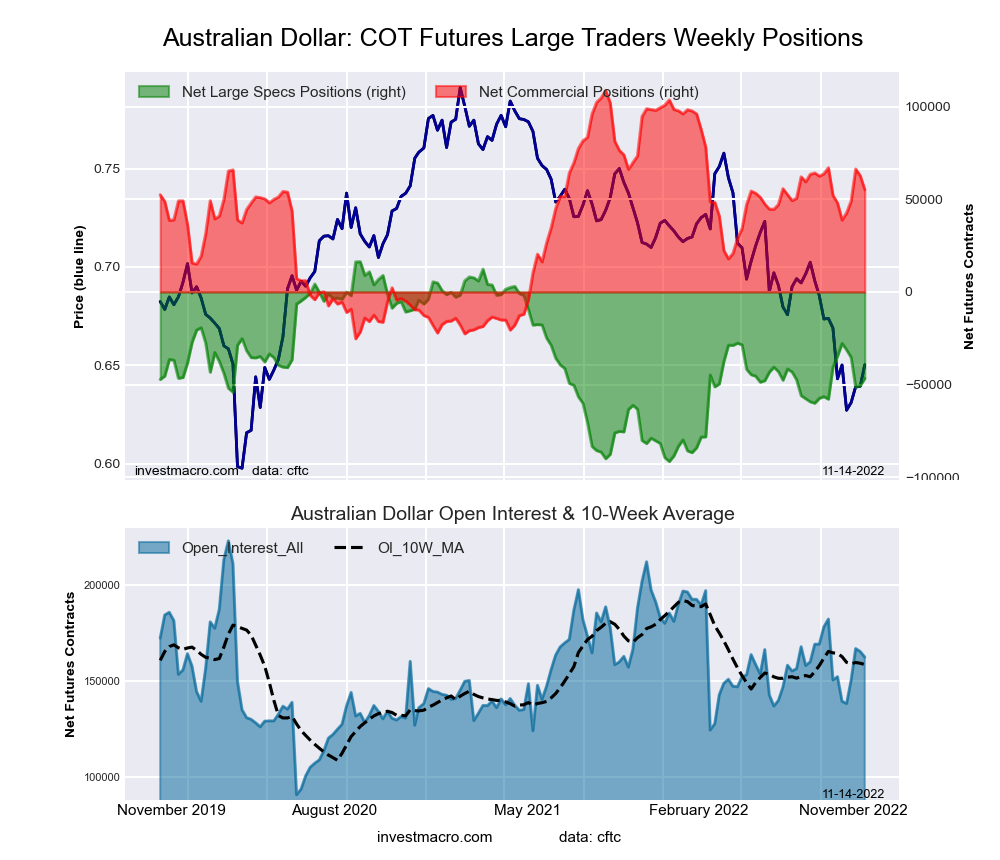 The Australian Dollar large speculator standing this week reached a net position of -46,683 contracts in the data reported through Tuesday. This was a weekly boost of 3,849 contracts from the previous week which had a total of -50,532 net contracts.
This week’s current strength score (the trader positioning range over the past three years, measured from 0 to 100) shows the speculators are currently Bearish with a score of 41.6 percent. The commercials are Bullish with a score of 60.1 percent and the small traders (not shown in chart) are Bearish with a score of 31.6 percent.
| AUSTRALIAN DOLLAR Statistics | SPECULATORS | COMMERCIALS | SMALL TRADERS |
| – Percent of Open Interest Longs: | 20.5 | 66.8 | 10.2 |
| – Percent of Open Interest Shorts: | 49.2 | 32.8 | 15.5 |
| – Net Position: | -46,683 | 55,223 | -8,540 |
| – Gross Longs: | 33,288 | 108,584 | 16,602 |
| – Gross Shorts: | 79,971 | 53,361 | 25,142 |
| – Long to Short Ratio: | 0.4 to 1 | 2.0 to 1 | 0.7 to 1 |
| NET POSITION TREND: | | | |
| – Strength Index Score (3 Year Range Pct): | 41.6 | 60.1 | 31.6 |
| – Strength Index Reading (3 Year Range): | Bearish | Bullish | Bearish |
| NET POSITION MOVEMENT INDEX: | | | |
| – 6-Week Change in Strength Index: | -11.2 | 5.4 | 11.7 |
New Zealand Dollar Futures:
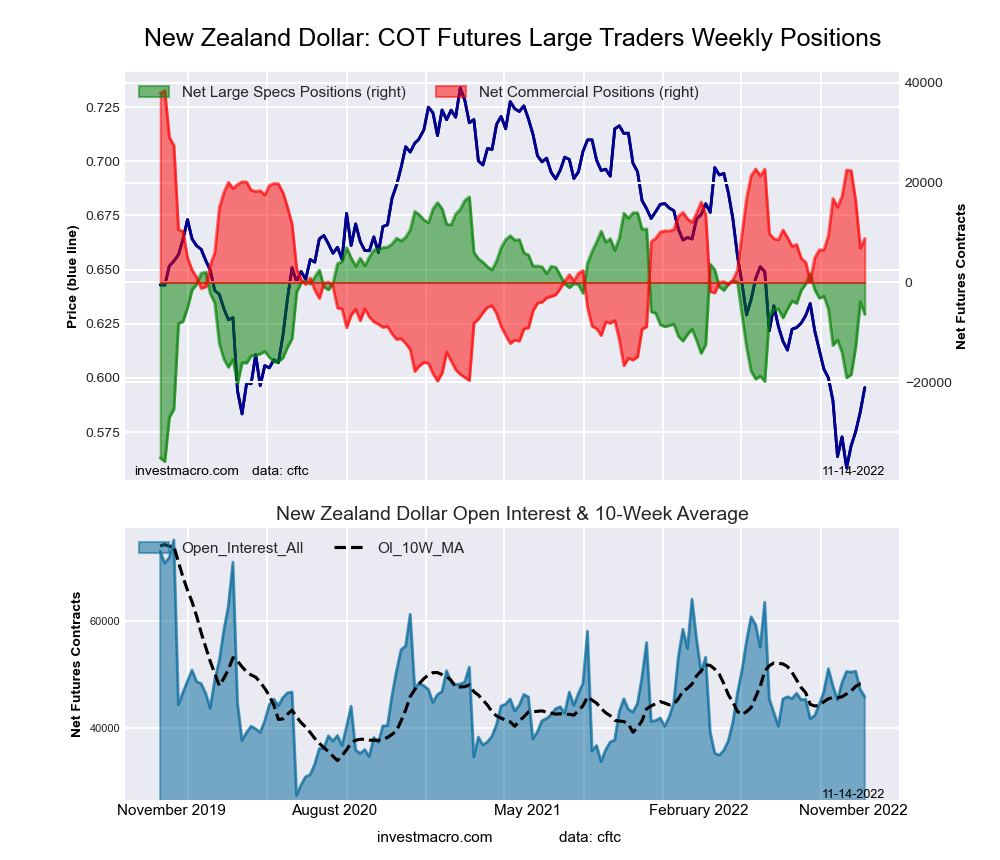 The New Zealand Dollar large speculator standing this week reached a net position of -6,367 contracts in the data reported through Tuesday. This was a weekly reduction of -2,520 contracts from the previous week which had a total of -3,847 net contracts.
This week’s current strength score (the trader positioning range over the past three years, measured from 0 to 100) shows the speculators are currently Bullish with a score of 55.6 percent. The commercials are Bearish with a score of 49.0 percent and the small traders (not shown in chart) are Bearish with a score of 23.8 percent.
| NEW ZEALAND DOLLAR Statistics | SPECULATORS | COMMERCIALS | SMALL TRADERS |
| – Percent of Open Interest Longs: | 39.5 | 54.4 | 5.5 |
| – Percent of Open Interest Shorts: | 53.4 | 35.2 | 10.8 |
| – Net Position: | -6,367 | 8,792 | -2,425 |
| – Gross Longs: | 18,085 | 24,923 | 2,532 |
| – Gross Shorts: | 24,452 | 16,131 | 4,957 |
| – Long to Short Ratio: | 0.7 to 1 | 1.5 to 1 | 0.5 to 1 |
| NET POSITION TREND: | | | |
| – Strength Index Score (3 Year Range Pct): | 55.6 | 49.0 | 23.8 |
| – Strength Index Reading (3 Year Range): | Bullish | Bearish | Bearish |
| NET POSITION MOVEMENT INDEX: | | | |
| – 6-Week Change in Strength Index: | 9.6 | -10.8 | 13.5 |
Mexican Peso Futures:
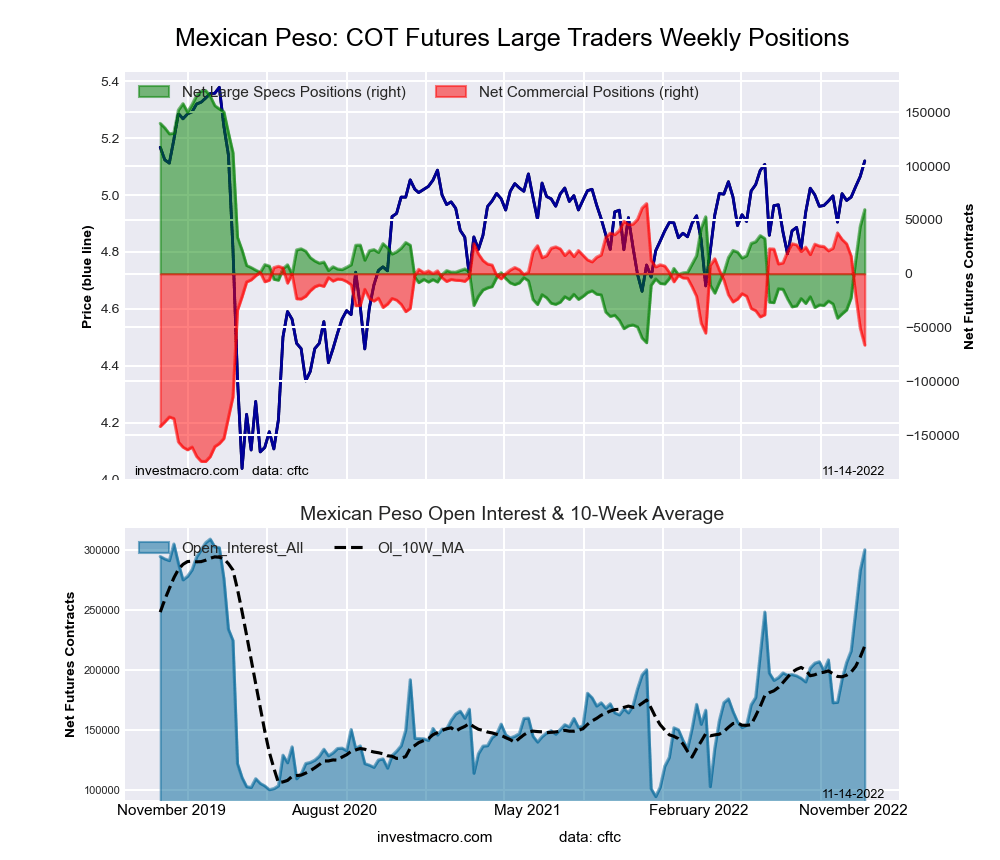 The Mexican Peso large speculator standing this week reached a net position of 59,614 contracts in the data reported through Tuesday. This was a weekly advance of 15,569 contracts from the previous week which had a total of 44,045 net contracts.
This week’s current strength score (the trader positioning range over the past three years, measured from 0 to 100) shows the speculators are currently Bullish with a score of 52.8 percent. The commercials are Bearish with a score of 45.1 percent and the small traders (not shown in chart) are Bullish with a score of 71.6 percent.
| MEXICAN PESO Statistics | SPECULATORS | COMMERCIALS | SMALL TRADERS |
| – Percent of Open Interest Longs: | 64.0 | 32.4 | 3.0 |
| – Percent of Open Interest Shorts: | 44.1 | 54.5 | 0.8 |
| – Net Position: | 59,614 | -66,356 | 6,742 |
| – Gross Longs: | 192,024 | 97,255 | 9,069 |
| – Gross Shorts: | 132,410 | 163,611 | 2,327 |
| – Long to Short Ratio: | 1.5 to 1 | 0.6 to 1 | 3.9 to 1 |
| NET POSITION TREND: | | | |
| – Strength Index Score (3 Year Range Pct): | 52.8 | 45.1 | 71.6 |
| – Strength Index Reading (3 Year Range): | Bullish | Bearish | Bullish |
| NET POSITION MOVEMENT INDEX: | | | |
| – 6-Week Change in Strength Index: | 43.0 | -43.5 | 14.5 |
Brazilian Real Futures:
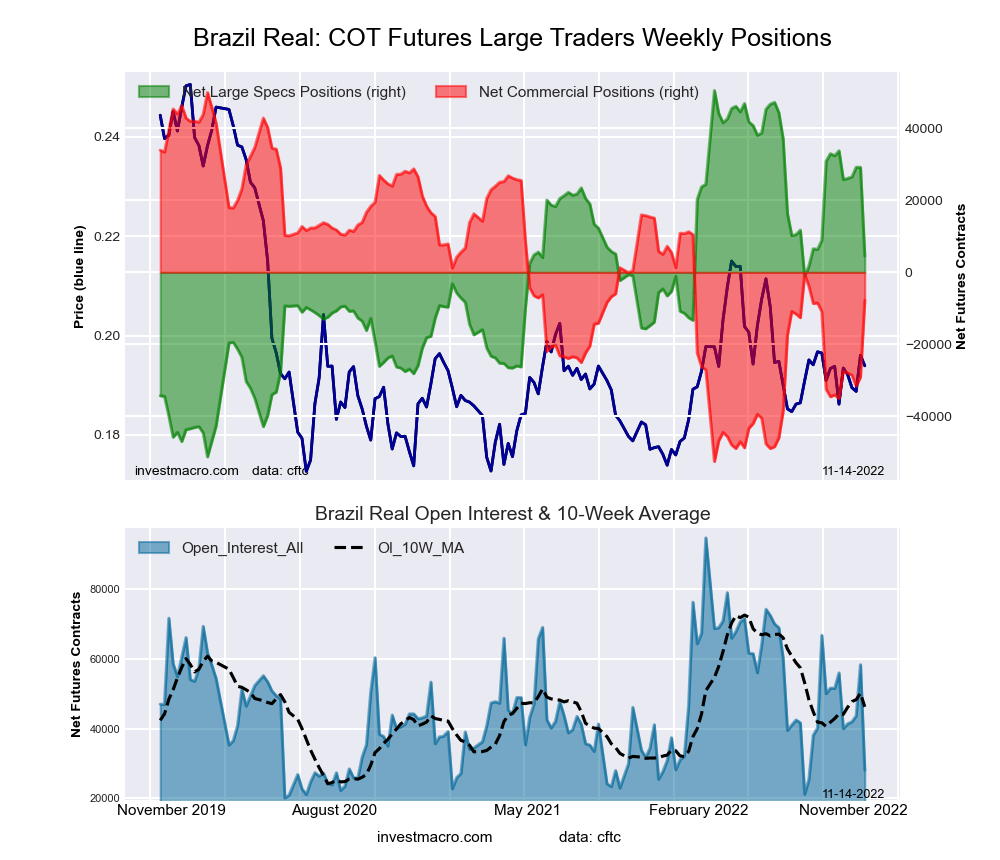 The Brazilian Real large speculator standing this week reached a net position of 4,501 contracts in the data reported through Tuesday. This was a weekly decline of -24,656 contracts from the previous week which had a total of 29,157 net contracts.
This week’s current strength score (the trader positioning range over the past three years, measured from 0 to 100) shows the speculators are currently Bullish with a score of 54.8 percent. The commercials are Bearish with a score of 43.7 percent and the small traders (not shown in chart) are Bullish-Extreme with a score of 100.0 percent.
| BRAZIL REAL Statistics | SPECULATORS | COMMERCIALS | SMALL TRADERS |
| – Percent of Open Interest Longs: | 65.3 | 18.6 | 16.1 |
| – Percent of Open Interest Shorts: | 49.2 | 46.3 | 4.4 |
| – Net Position: | 4,501 | -7,773 | 3,272 |
| – Gross Longs: | 18,306 | 5,219 | 4,502 |
| – Gross Shorts: | 13,805 | 12,992 | 1,230 |
| – Long to Short Ratio: | 1.3 to 1 | 0.4 to 1 | 3.7 to 1 |
| NET POSITION TREND: | | | |
| – Strength Index Score (3 Year Range Pct): | 54.8 | 43.7 | 100.0 |
| – Strength Index Reading (3 Year Range): | Bullish | Bearish | Bullish-Extreme |
| NET POSITION MOVEMENT INDEX: | | | |
| – 6-Week Change in Strength Index: | -28.8 | 26.6 | 22.8 |
Bitcoin Futures:
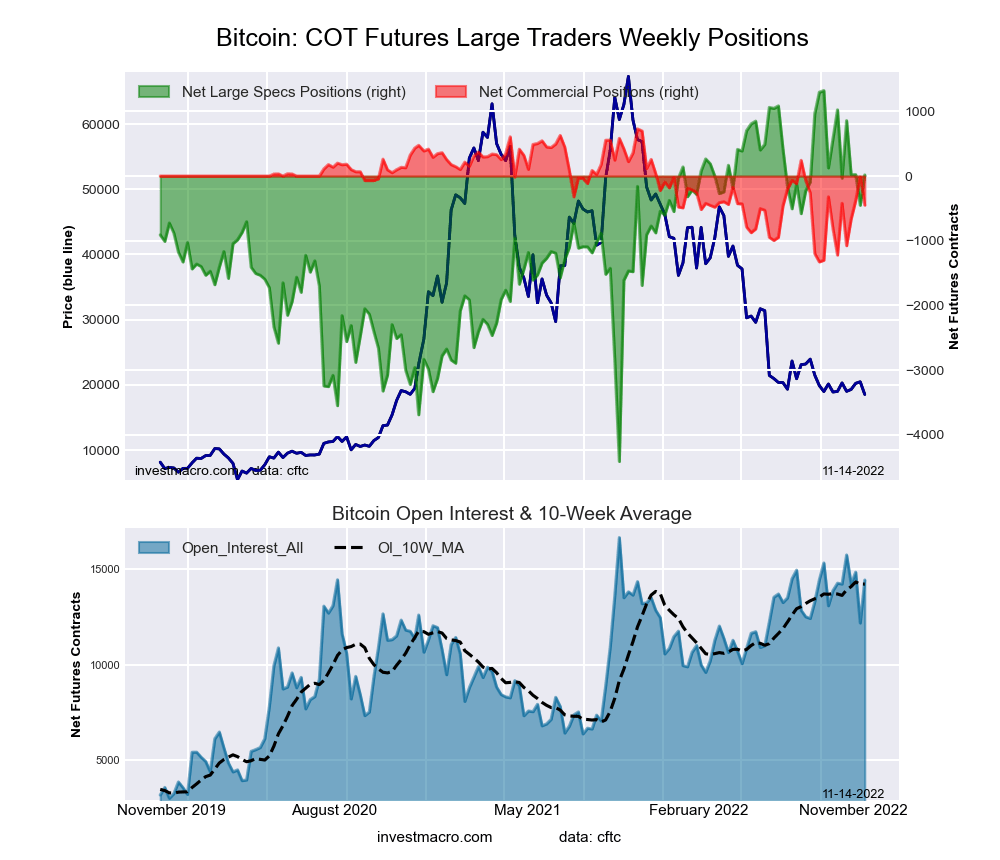 The Bitcoin large speculator standing this week reached a net position of 18 contracts in the data reported through Tuesday. This was a weekly rise of 470 contracts from the previous week which had a total of -452 net contracts.
This week’s current strength score (the trader positioning range over the past three years, measured from 0 to 100) shows the speculators are currently Bullish with a score of 77.3 percent. The commercials are Bearish with a score of 42.7 percent and the small traders (not shown in chart) are Bearish with a score of 22.7 percent.
| BITCOIN Statistics | SPECULATORS | COMMERCIALS | SMALL TRADERS |
| – Percent of Open Interest Longs: | 78.3 | 1.4 | 8.8 |
| – Percent of Open Interest Shorts: | 78.2 | 4.5 | 5.8 |
| – Net Position: | 18 | -449 | 431 |
| – Gross Longs: | 11,303 | 200 | 1,269 |
| – Gross Shorts: | 11,285 | 649 | 838 |
| – Long to Short Ratio: | 1.0 to 1 | 0.3 to 1 | 1.5 to 1 |
| NET POSITION TREND: | | | |
| – Strength Index Score (3 Year Range Pct): | 77.3 | 42.7 | 22.7 |
| – Strength Index Reading (3 Year Range): | Bullish | Bearish | Bearish |
| NET POSITION MOVEMENT INDEX: | | | |
| – 6-Week Change in Strength Index: | -17.5 | 37.5 | 5.3 |
Article By InvestMacro – Receive our weekly COT Newsletter
*COT Report: The COT data, released weekly to the public each Friday, is updated through the most recent Tuesday (data is 3 days old) and shows a quick view of how large speculators or non-commercials (for-profit traders) were positioned in the futures markets.
The CFTC categorizes trader positions according to commercial hedgers (traders who use futures contracts for hedging as part of the business), non-commercials (large traders who speculate to realize trading profits) and nonreportable traders (usually small traders/speculators) as well as their open interest (contracts open in the market at time of reporting). See CFTC criteria here.


