By InvestMacro
Here are the latest charts and statistics for the Commitment of Traders (COT) data published by the Commodities Futures Trading Commission (CFTC).
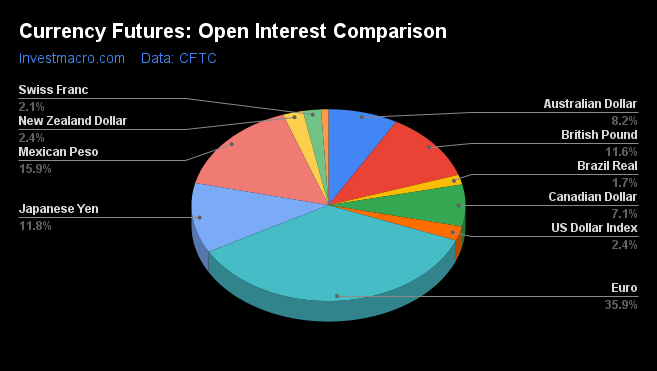
The latest COT data is updated through Tuesday November 29th and shows a quick view of how large market participants (for-profit speculators and commercial traders) were positioned in the futures markets. All currency positions are in direct relation to the US dollar where, for example, a bet for the euro is a bet that the euro will rise versus the dollar while a bet against the euro will be a bet that the euro will decline versus the dollar.
Weekly Speculator Changes
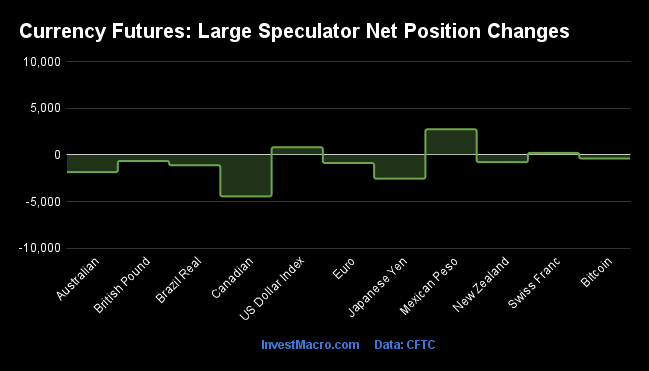
The COT currency market speculator bets were overall lower this week as three out of the eleven currency markets we cover had higher positioning while the other eight markets had lower speculator contracts.
Leading the gains for the currency markets was the Mexican peso (2,767 contracts) with the US Dollar Index (827 contracts) and the Swiss franc (229 contracts) also showing a positive week.
The currencies leading the declines in speculator bets this week were the Canadian dollar (-4,444 contracts) and the Japanese yen (-2,544 contracts) with the Australian dollar (-1,844 contracts), the Brazilian real (-1,099 contracts), the Euro (-865 contracts), the New Zealand dollar (-770 contracts), the British pound sterling (-642 contracts) and Bitcoin (-382 contracts) also registering lower bets on the week.
Highlighting the COT currency data this week is the rising Mexican peso positioning. Large speculators boosted their bullish bets for the Mexican peso this week for the eighth time out of the past nine weeks. Peso bets have now improved by a total of +107,408 contracts over that nine-week period going from a standing of -41,322 contracts on September 27th to +66,086 contracts through Tuesday.
The peso positioning has been helped out by the rising interest rates in Mexico that have reached 10 percent with expectations of another 50 basis point increase in December. Peso prices have also been on the rise higher against the US Dollar recently and are up by over 6 percent (vs USD) since late-September. The peso is also one of the rare currencies to be up overall against the US Dollar in 2022.
| Nov-29-2022 | OI | OI-Index | Spec-Net | Spec-Index | Com-Net | COM-Index | Smalls-Net | Smalls-Index |
|---|
| USD Index | 46,836 | 60 | 24,892 | 66 | -28,492 | 31 | 3,600 | 56 |
| EUR | 695,776 | 77 | 122,247 | 73 | -154,585 | 32 | 32,338 | 31 |
| GBP | 225,480 | 52 | -36,584 | 38 | 49,232 | 68 | -12,648 | 33 |
| JPY | 228,328 | 67 | -67,394 | 27 | 82,669 | 76 | -15,275 | 22 |
| CHF | 41,360 | 25 | -14,247 | 17 | 19,970 | 78 | -5,723 | 38 |
| CAD | 136,654 | 21 | -16,116 | 23 | 13,951 | 80 | 2,165 | 34 |
| AUD | 159,378 | 52 | -44,630 | 43 | 50,906 | 57 | -6,276 | 37 |
| NZD | 46,180 | 39 | -5,054 | 48 | 4,641 | 52 | 413 | 56 |
| MXN | 307,733 | 99 | 66,086 | 56 | -72,759 | 42 | 6,673 | 71 |
| RUB | 20,930 | 4 | 7,543 | 31 | -7,150 | 69 | -393 | 24 |
| BRL | 32,057 | 16 | 7,637 | 56 | -9,659 | 44 | 2,022 | 85 |
| Bitcoin | 16,832 | 90 | 324 | 83 | -780 | 0 | 456 | 23 |
Bitcoin, EuroFX lead Strength Scores
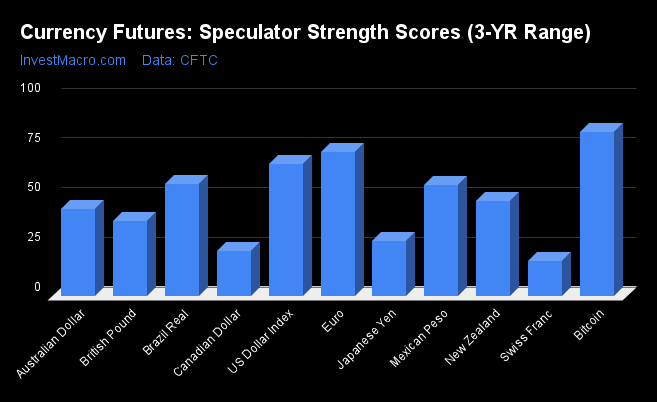
Strength Scores (a normalized measure of Speculator positions over a 3-Year range, from 0 to 100 where above 80 is extreme bullish and below 20 is extreme bearish) show that Bitcoin (82.6 percent) and the EuroFX (72.5 percent) lead the currency markets at the top of their respective ranges and are both in bullish extreme positions. The US Dollar Index (66.4 percent) comes in as the next highest in the currency markets in strength scores but the Dollar has been losing steam over the past weeks and months.
On the downside, the Swiss Franc (17.4 percent) comes in at the lowest strength level currently and is in a bearish extreme level (below 20 percent).
Strength Statistics:
US Dollar Index (66.4 percent) vs US Dollar Index previous week (65.1 percent)
EuroFX (72.5 percent) vs EuroFX previous week (72.8 percent)
British Pound Sterling (37.6 percent) vs British Pound Sterling previous week (38.2 percent)
Japanese Yen (27.4 percent) vs Japanese Yen previous week (28.9 percent)
Swiss Franc (17.4 percent) vs Swiss Franc previous week (16.8 percent)
Canadian Dollar (22.6 percent) vs Canadian Dollar previous week (27.9 percent)
Australian Dollar (43.5 percent) vs Australian Dollar previous week (45.2 percent)
New Zealand Dollar (47.8 percent) vs New Zealand Dollar previous week (49.6 percent)
Mexican Peso (55.5 percent) vs Mexican Peso previous week (54.3 percent)
Brazilian Real (56.0 percent) vs Brazilian Real previous week (57.2 percent)
Bitcoin (82.6 percent) vs Bitcoin previous week (89.3 percent)
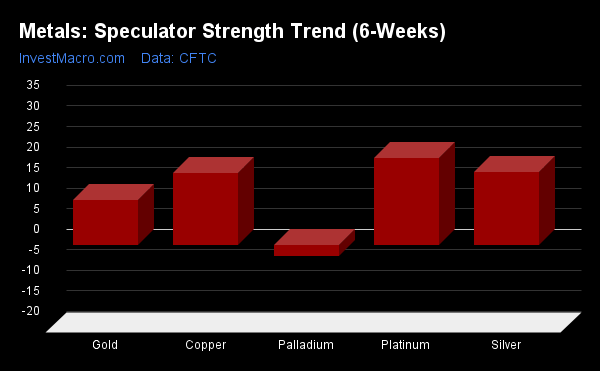
Strength Trends led by Mexican Peso
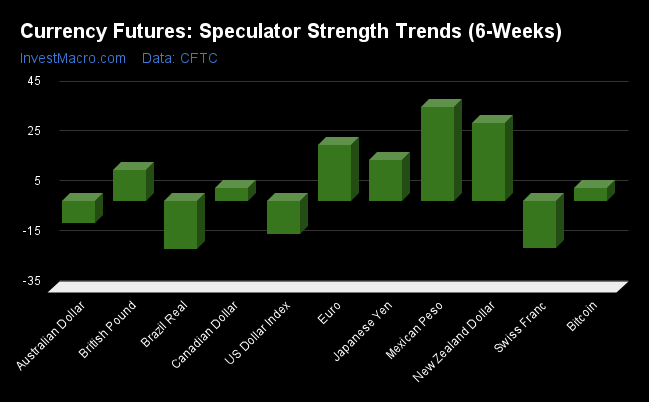
Strength Score Trends (or move index, calculates the 6-week changes in strength scores) showed that the Mexican Peso (37.7 percent) leads the past six weeks trends for the currency markets this week. The New Zealand Dollar (31.5 percent), the EuroFX (22.7 percent) and the Japanese Yen (16.6 percent) fill out the next top movers in the latest trends data.
The Brazilian Real (-19.3 percent) and the Swiss Franc (-18.8 percent) lead the downside trend scores currently while the next market with lower trend scores was the US Dollar Index (-13.0 percent).
Strength Trend Statistics:
US Dollar Index (-13.0 percent) vs US Dollar Index previous week (-14.5 percent)
EuroFX (22.7 percent) vs EuroFX previous week (26.3 percent)
British Pound Sterling (12.6 percent) vs British Pound Sterling previous week (2.8 percent)
Japanese Yen (16.6 percent) vs Japanese Yen previous week (7.7 percent)
Swiss Franc (-18.8 percent) vs Swiss Franc previous week (-22.6 percent)
Canadian Dollar (5.3 percent) vs Canadian Dollar previous week (16.7 percent)
Australian Dollar (-8.6 percent) vs Australian Dollar previous week (-10.7 percent)
New Zealand Dollar (31.5 percent) vs New Zealand Dollar previous week (34.8 percent)
Mexican Peso (37.7 percent) vs Mexican Peso previous week (41.4 percent)
Brazilian Real (-19.3 percent) vs Brazilian Real previous week (-17.8 percent)
Bitcoin (5.3 percent) vs Bitcoin previous week (-2.6 percent)
Individual COT Forex Markets:
US Dollar Index Futures:
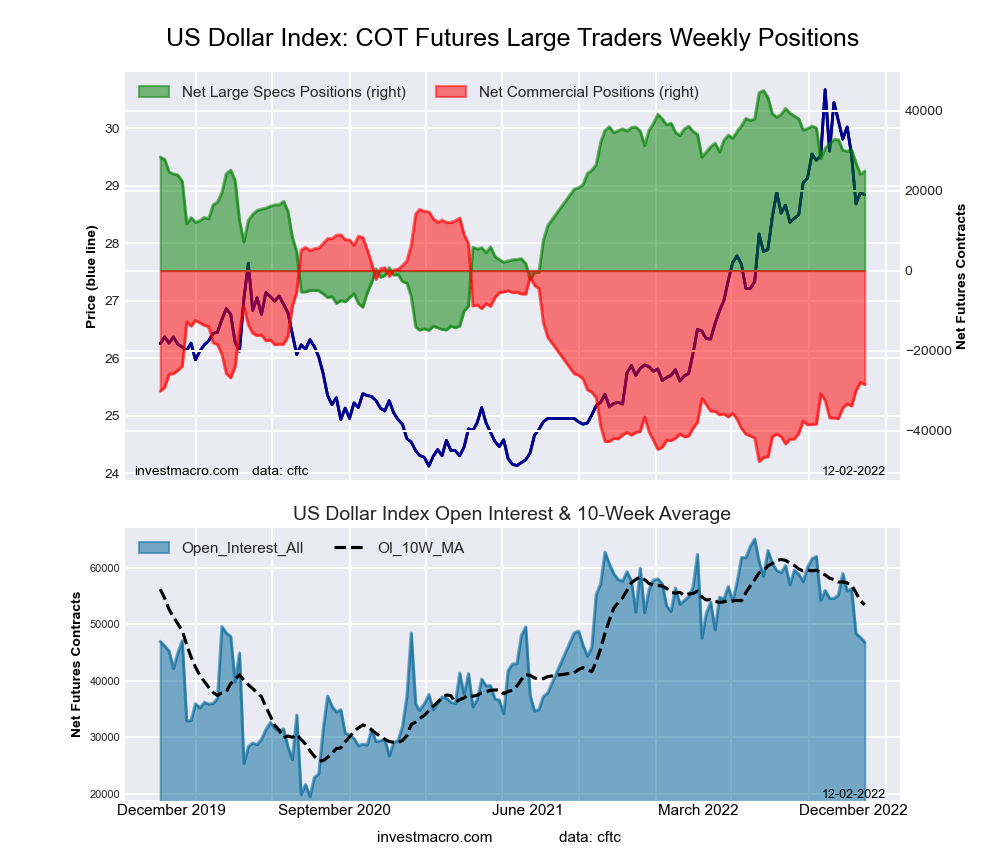 The US Dollar Index large speculator standing this week recorded a net position of 24,892 contracts in the data reported through Tuesday. This was a weekly lift of 827 contracts from the previous week which had a total of 24,065 net contracts.
This week’s current strength score (the trader positioning range over the past three years, measured from 0 to 100) shows the speculators are currently Bullish with a score of 66.4 percent. The commercials are Bearish with a score of 30.5 percent and the small traders (not shown in chart) are Bullish with a score of 55.9 percent.
| US DOLLAR INDEX Statistics | SPECULATORS | COMMERCIALS | SMALL TRADERS |
| – Percent of Open Interest Longs: | 79.6 | 4.4 | 13.2 |
| – Percent of Open Interest Shorts: | 26.4 | 65.3 | 5.5 |
| – Net Position: | 24,892 | -28,492 | 3,600 |
| – Gross Longs: | 37,279 | 2,079 | 6,199 |
| – Gross Shorts: | 12,387 | 30,571 | 2,599 |
| – Long to Short Ratio: | 3.0 to 1 | 0.1 to 1 | 2.4 to 1 |
| NET POSITION TREND: | | | |
| – Strength Index Score (3 Year Range Pct): | 66.4 | 30.5 | 55.9 |
| – Strength Index Reading (3 Year Range): | Bullish | Bearish | Bullish |
| NET POSITION MOVEMENT INDEX: | | | |
| – 6-Week Change in Strength Index: | -13.0 | 13.5 | -7.9 |
Euro Currency Futures:
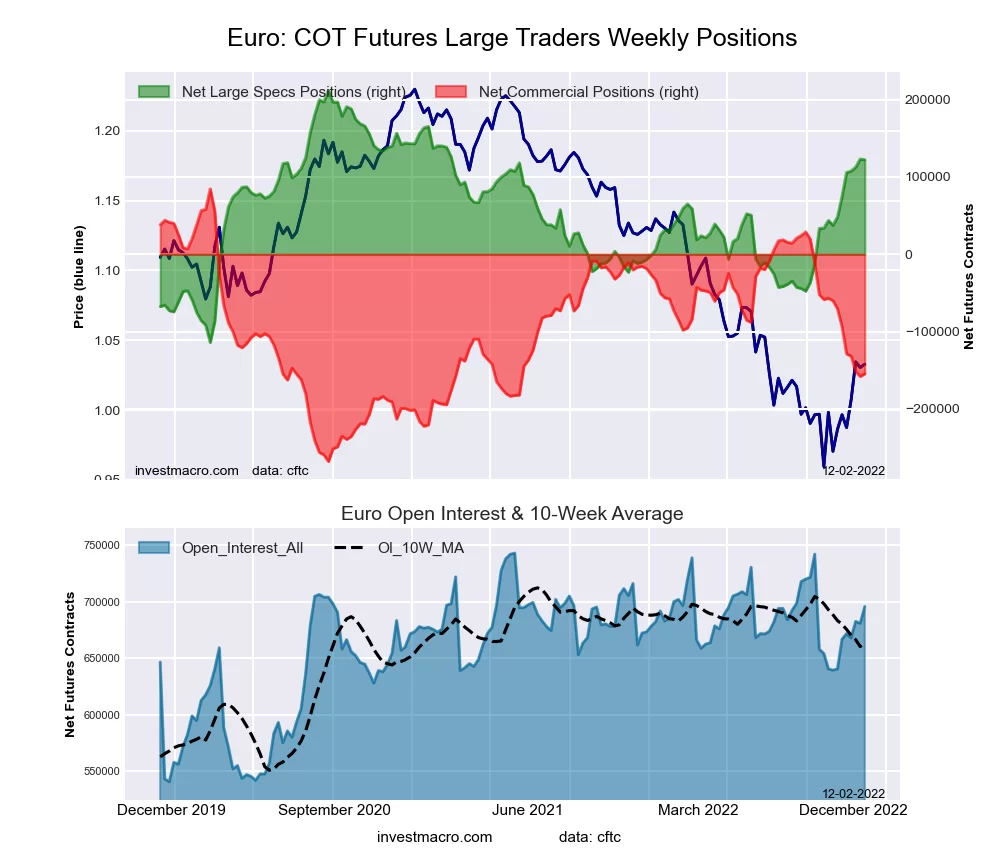 The Euro Currency large speculator standing this week recorded a net position of 122,247 contracts in the data reported through Tuesday. This was a weekly reduction of -865 contracts from the previous week which had a total of 123,112 net contracts.
This week’s current strength score (the trader positioning range over the past three years, measured from 0 to 100) shows the speculators are currently Bullish with a score of 72.5 percent. The commercials are Bearish with a score of 32.2 percent and the small traders (not shown in chart) are Bearish with a score of 30.6 percent.
| EURO Currency Statistics | SPECULATORS | COMMERCIALS | SMALL TRADERS |
| – Percent of Open Interest Longs: | 34.7 | 51.3 | 11.8 |
| – Percent of Open Interest Shorts: | 17.1 | 73.5 | 7.1 |
| – Net Position: | 122,247 | -154,585 | 32,338 |
| – Gross Longs: | 241,122 | 356,905 | 81,867 |
| – Gross Shorts: | 118,875 | 511,490 | 49,529 |
| – Long to Short Ratio: | 2.0 to 1 | 0.7 to 1 | 1.7 to 1 |
| NET POSITION TREND: | | | |
| – Strength Index Score (3 Year Range Pct): | 72.5 | 32.2 | 30.6 |
| – Strength Index Reading (3 Year Range): | Bullish | Bearish | Bearish |
| NET POSITION MOVEMENT INDEX: | | | |
| – 6-Week Change in Strength Index: | 22.7 | -23.8 | 15.8 |
British Pound Sterling Futures:
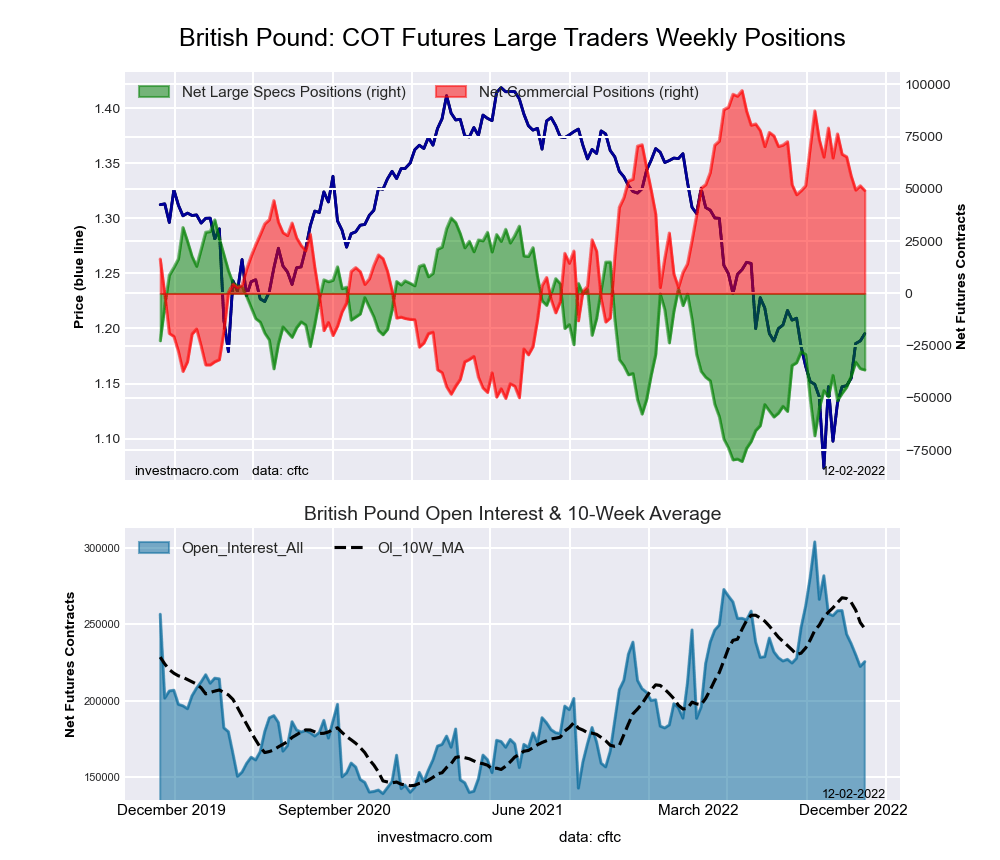 The British Pound Sterling large speculator standing this week recorded a net position of -36,584 contracts in the data reported through Tuesday. This was a weekly fall of -642 contracts from the previous week which had a total of -35,942 net contracts.
This week’s current strength score (the trader positioning range over the past three years, measured from 0 to 100) shows the speculators are currently Bearish with a score of 37.6 percent. The commercials are Bullish with a score of 67.5 percent and the small traders (not shown in chart) are Bearish with a score of 33.2 percent.
| BRITISH POUND Statistics | SPECULATORS | COMMERCIALS | SMALL TRADERS |
| – Percent of Open Interest Longs: | 11.5 | 76.4 | 9.5 |
| – Percent of Open Interest Shorts: | 27.8 | 54.5 | 15.1 |
| – Net Position: | -36,584 | 49,232 | -12,648 |
| – Gross Longs: | 26,000 | 172,199 | 21,363 |
| – Gross Shorts: | 62,584 | 122,967 | 34,011 |
| – Long to Short Ratio: | 0.4 to 1 | 1.4 to 1 | 0.6 to 1 |
| NET POSITION TREND: | | | |
| – Strength Index Score (3 Year Range Pct): | 37.6 | 67.5 | 33.2 |
| – Strength Index Reading (3 Year Range): | Bearish | Bullish | Bearish |
| NET POSITION MOVEMENT INDEX: | | | |
| – 6-Week Change in Strength Index: | 12.6 | -18.4 | 24.4 |
Japanese Yen Futures:
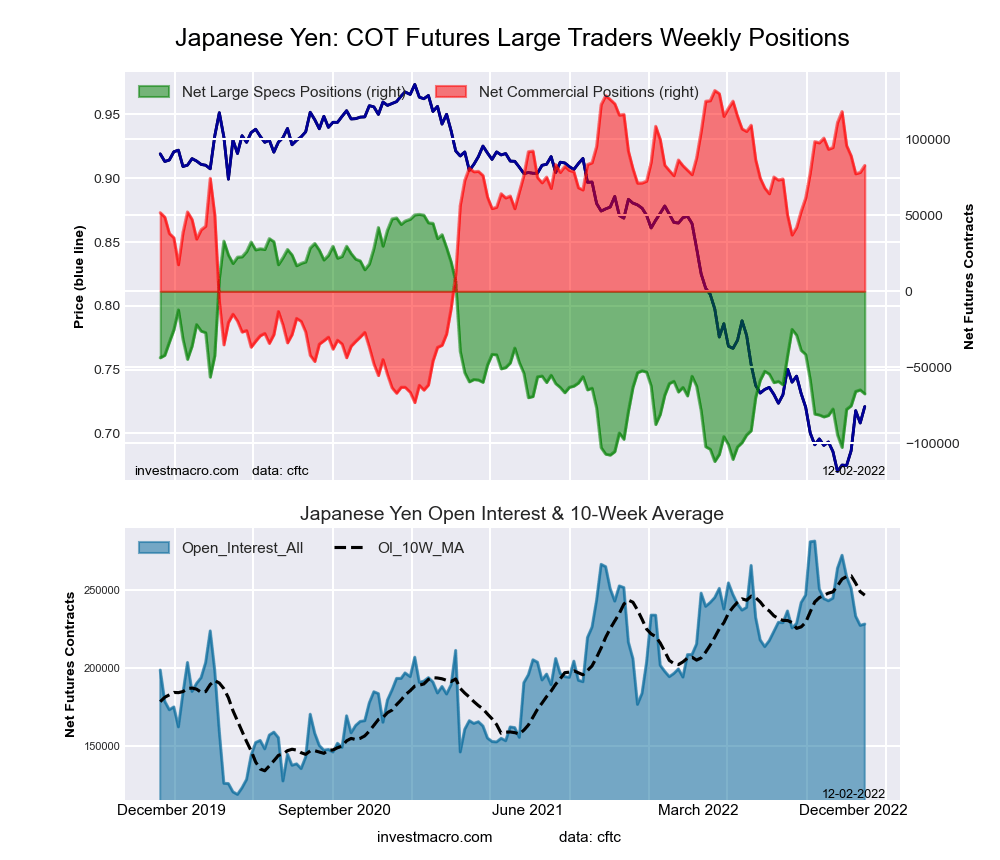 The Japanese Yen large speculator standing this week recorded a net position of -67,394 contracts in the data reported through Tuesday. This was a weekly lowering of -2,544 contracts from the previous week which had a total of -64,850 net contracts.
This week’s current strength score (the trader positioning range over the past three years, measured from 0 to 100) shows the speculators are currently Bearish with a score of 27.4 percent. The commercials are Bullish with a score of 76.0 percent and the small traders (not shown in chart) are Bearish with a score of 22.4 percent.
| JAPANESE YEN Statistics | SPECULATORS | COMMERCIALS | SMALL TRADERS |
| – Percent of Open Interest Longs: | 12.3 | 76.2 | 9.8 |
| – Percent of Open Interest Shorts: | 41.8 | 40.0 | 16.5 |
| – Net Position: | -67,394 | 82,669 | -15,275 |
| – Gross Longs: | 28,125 | 173,959 | 22,403 |
| – Gross Shorts: | 95,519 | 91,290 | 37,678 |
| – Long to Short Ratio: | 0.3 to 1 | 1.9 to 1 | 0.6 to 1 |
| NET POSITION TREND: | | | |
| – Strength Index Score (3 Year Range Pct): | 27.4 | 76.0 | 22.4 |
| – Strength Index Reading (3 Year Range): | Bearish | Bullish | Bearish |
| NET POSITION MOVEMENT INDEX: | | | |
| – 6-Week Change in Strength Index: | 16.6 | -13.7 | 2.5 |
Swiss Franc Futures:
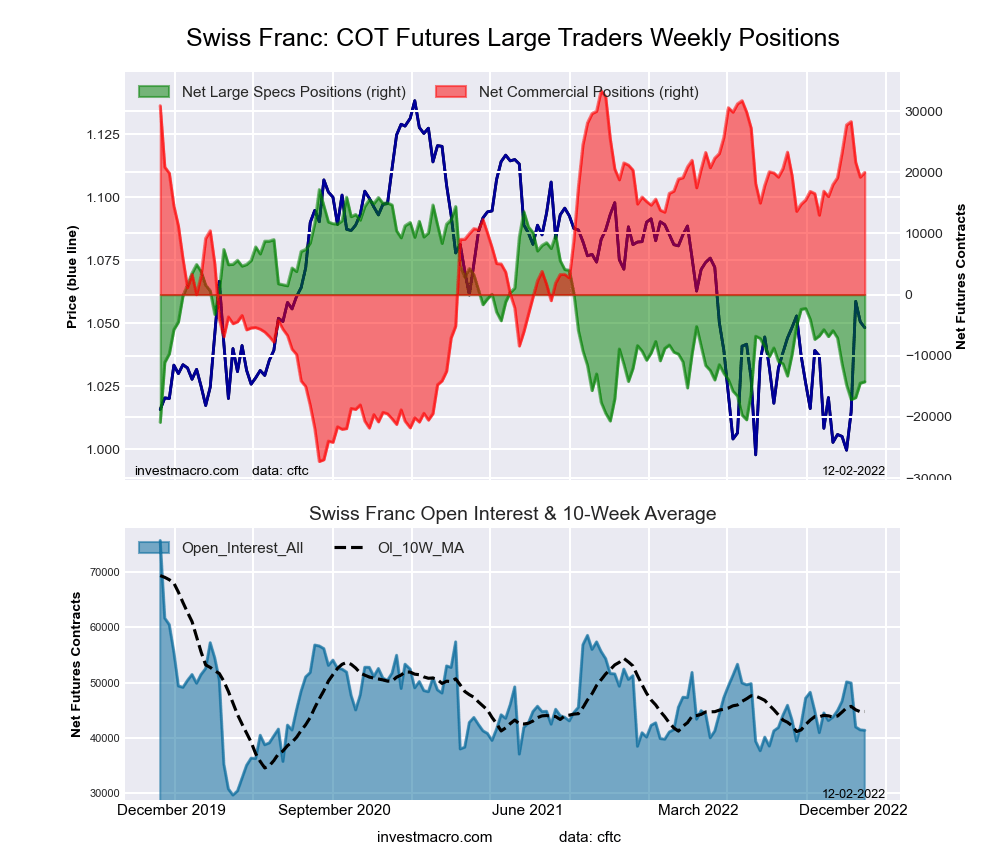 The Swiss Franc large speculator standing this week recorded a net position of -14,247 contracts in the data reported through Tuesday. This was a weekly rise of 229 contracts from the previous week which had a total of -14,476 net contracts.
This week’s current strength score (the trader positioning range over the past three years, measured from 0 to 100) shows the speculators are currently Bearish-Extreme with a score of 17.4 percent. The commercials are Bullish with a score of 77.9 percent and the small traders (not shown in chart) are Bearish with a score of 38.2 percent.
| SWISS FRANC Statistics | SPECULATORS | COMMERCIALS | SMALL TRADERS |
| – Percent of Open Interest Longs: | 3.6 | 69.7 | 25.9 |
| – Percent of Open Interest Shorts: | 38.0 | 21.4 | 39.7 |
| – Net Position: | -14,247 | 19,970 | -5,723 |
| – Gross Longs: | 1,488 | 28,814 | 10,696 |
| – Gross Shorts: | 15,735 | 8,844 | 16,419 |
| – Long to Short Ratio: | 0.1 to 1 | 3.3 to 1 | 0.7 to 1 |
| NET POSITION TREND: | | | |
| – Strength Index Score (3 Year Range Pct): | 17.4 | 77.9 | 38.2 |
| – Strength Index Reading (3 Year Range): | Bearish-Extreme | Bullish | Bearish |
| NET POSITION MOVEMENT INDEX: | | | |
| – 6-Week Change in Strength Index: | -18.8 | 1.4 | 21.3 |
Canadian Dollar Futures:
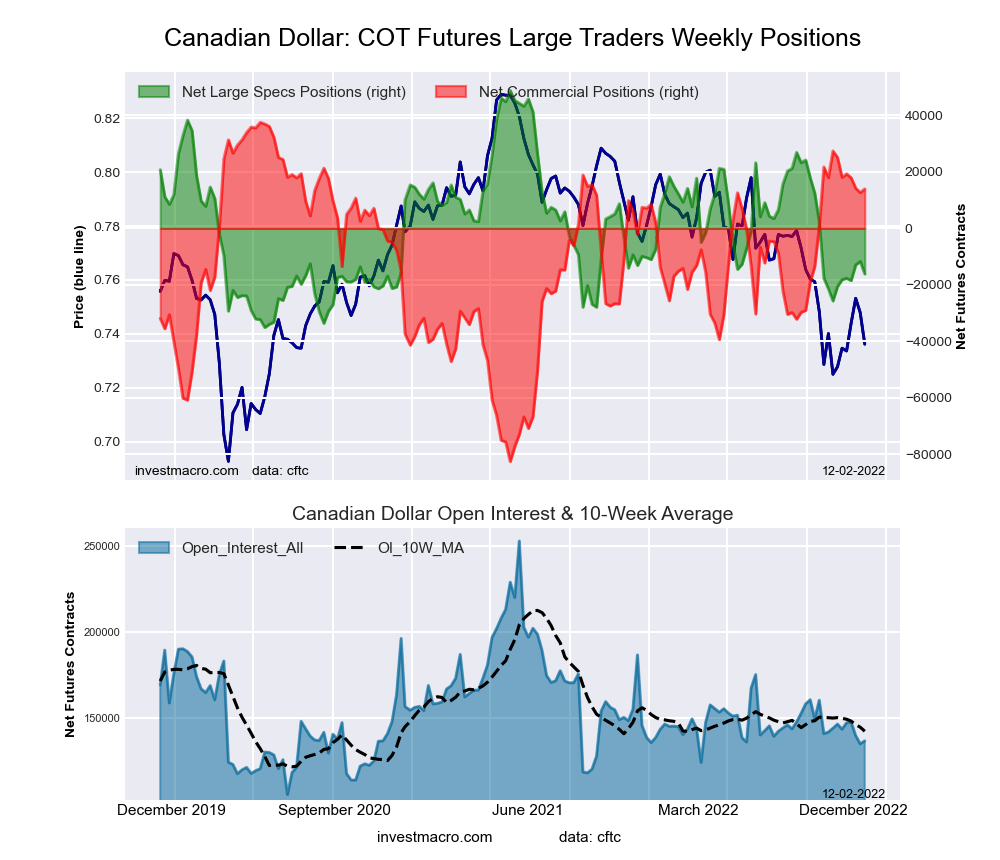 The Canadian Dollar large speculator standing this week recorded a net position of -16,116 contracts in the data reported through Tuesday. This was a weekly lowering of -4,444 contracts from the previous week which had a total of -11,672 net contracts.
This week’s current strength score (the trader positioning range over the past three years, measured from 0 to 100) shows the speculators are currently Bearish with a score of 22.6 percent. The commercials are Bullish-Extreme with a score of 80.4 percent and the small traders (not shown in chart) are Bearish with a score of 34.5 percent.
| CANADIAN DOLLAR Statistics | SPECULATORS | COMMERCIALS | SMALL TRADERS |
| – Percent of Open Interest Longs: | 25.7 | 48.5 | 24.4 |
| – Percent of Open Interest Shorts: | 37.5 | 38.3 | 22.8 |
| – Net Position: | -16,116 | 13,951 | 2,165 |
| – Gross Longs: | 35,123 | 66,304 | 33,375 |
| – Gross Shorts: | 51,239 | 52,353 | 31,210 |
| – Long to Short Ratio: | 0.7 to 1 | 1.3 to 1 | 1.1 to 1 |
| NET POSITION TREND: | | | |
| – Strength Index Score (3 Year Range Pct): | 22.6 | 80.4 | 34.5 |
| – Strength Index Reading (3 Year Range): | Bearish | Bullish-Extreme | Bearish |
| NET POSITION MOVEMENT INDEX: | | | |
| – 6-Week Change in Strength Index: | 5.3 | -9.3 | 13.5 |
Australian Dollar Futures:
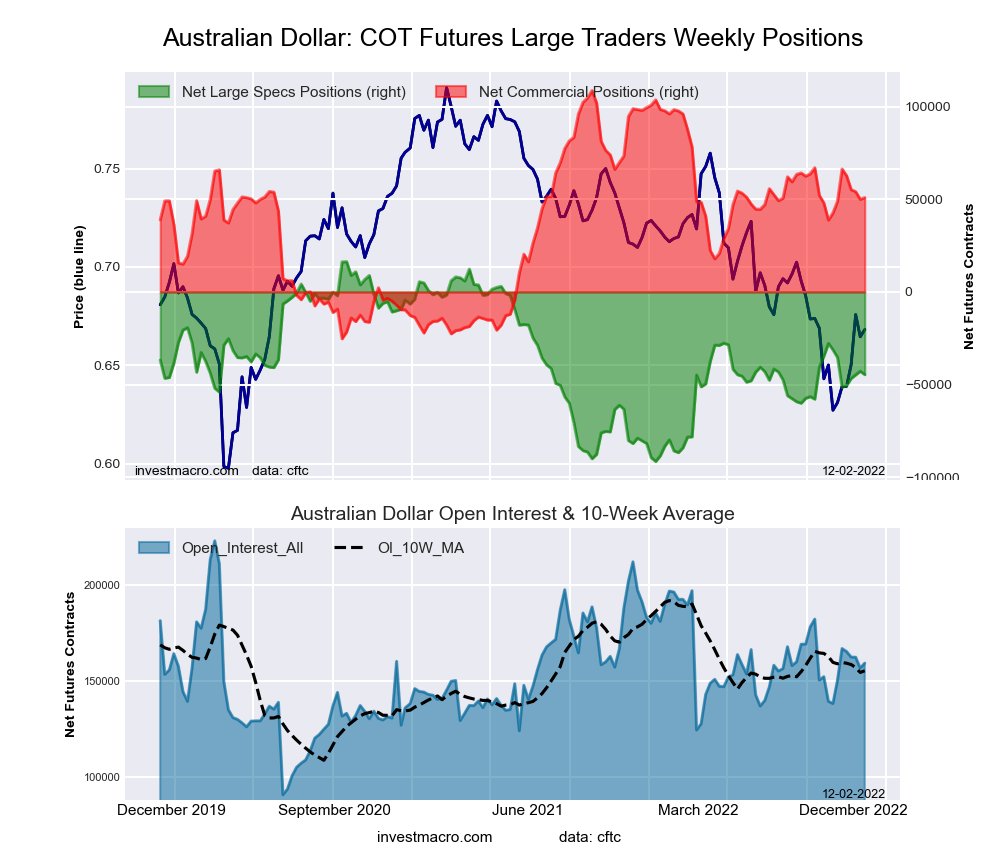 The Australian Dollar large speculator standing this week recorded a net position of -44,630 contracts in the data reported through Tuesday. This was a weekly fall of -1,844 contracts from the previous week which had a total of -42,786 net contracts.
This week’s current strength score (the trader positioning range over the past three years, measured from 0 to 100) shows the speculators are currently Bearish with a score of 43.5 percent. The commercials are Bullish with a score of 56.9 percent and the small traders (not shown in chart) are Bearish with a score of 37.1 percent.
| AUSTRALIAN DOLLAR Statistics | SPECULATORS | COMMERCIALS | SMALL TRADERS |
| – Percent of Open Interest Longs: | 22.0 | 65.6 | 9.8 |
| – Percent of Open Interest Shorts: | 50.0 | 33.6 | 13.8 |
| – Net Position: | -44,630 | 50,906 | -6,276 |
| – Gross Longs: | 35,045 | 104,506 | 15,698 |
| – Gross Shorts: | 79,675 | 53,600 | 21,974 |
| – Long to Short Ratio: | 0.4 to 1 | 1.9 to 1 | 0.7 to 1 |
| NET POSITION TREND: | | | |
| – Strength Index Score (3 Year Range Pct): | 43.5 | 56.9 | 37.1 |
| – Strength Index Reading (3 Year Range): | Bearish | Bullish | Bearish |
| NET POSITION MOVEMENT INDEX: | | | |
| – 6-Week Change in Strength Index: | -8.6 | 1.4 | 17.9 |
New Zealand Dollar Futures:
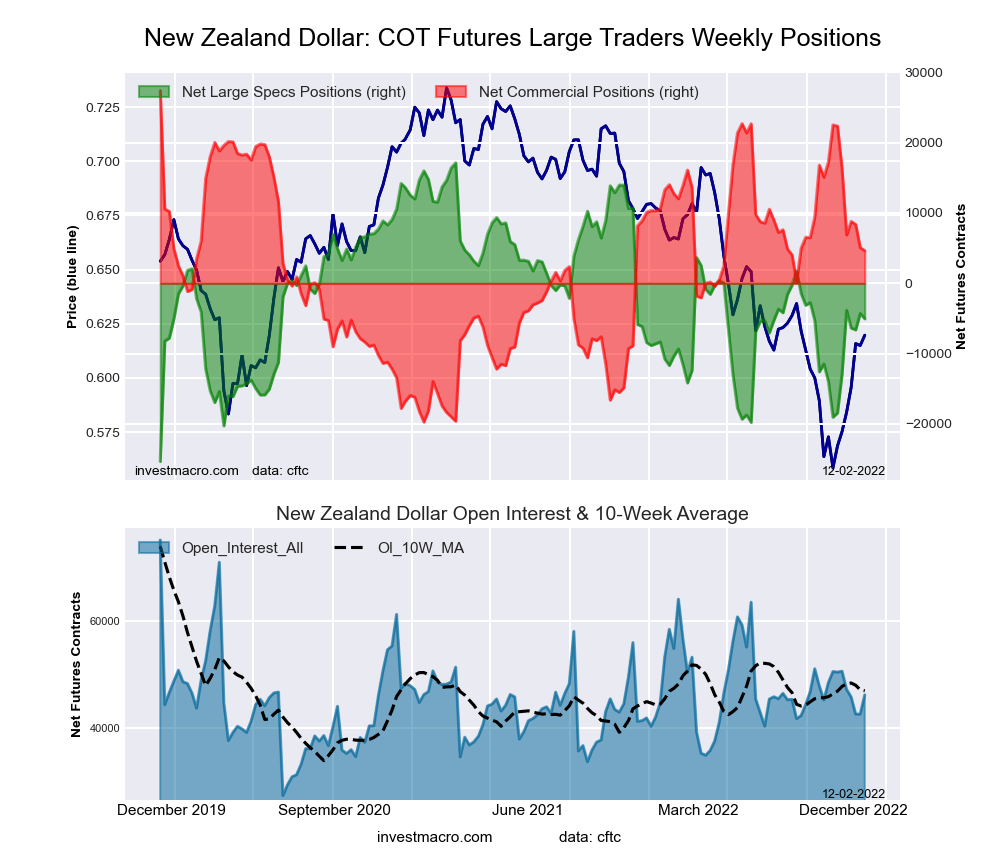 The New Zealand Dollar large speculator standing this week recorded a net position of -5,054 contracts in the data reported through Tuesday. This was a weekly decline of -770 contracts from the previous week which had a total of -4,284 net contracts.
This week’s current strength score (the trader positioning range over the past three years, measured from 0 to 100) shows the speculators are currently Bearish with a score of 47.8 percent. The commercials are Bullish with a score of 51.7 percent and the small traders (not shown in chart) are Bullish with a score of 56.4 percent.
| NEW ZEALAND DOLLAR Statistics | SPECULATORS | COMMERCIALS | SMALL TRADERS |
| – Percent of Open Interest Longs: | 40.8 | 50.2 | 8.0 |
| – Percent of Open Interest Shorts: | 51.8 | 40.1 | 7.1 |
| – Net Position: | -5,054 | 4,641 | 413 |
| – Gross Longs: | 18,855 | 23,162 | 3,691 |
| – Gross Shorts: | 23,909 | 18,521 | 3,278 |
| – Long to Short Ratio: | 0.8 to 1 | 1.3 to 1 | 1.1 to 1 |
| NET POSITION TREND: | | | |
| – Strength Index Score (3 Year Range Pct): | 47.8 | 51.7 | 56.4 |
| – Strength Index Reading (3 Year Range): | Bearish | Bullish | Bullish |
| NET POSITION MOVEMENT INDEX: | | | |
| – 6-Week Change in Strength Index: | 31.5 | -37.6 | 49.7 |
Mexican Peso Futures:
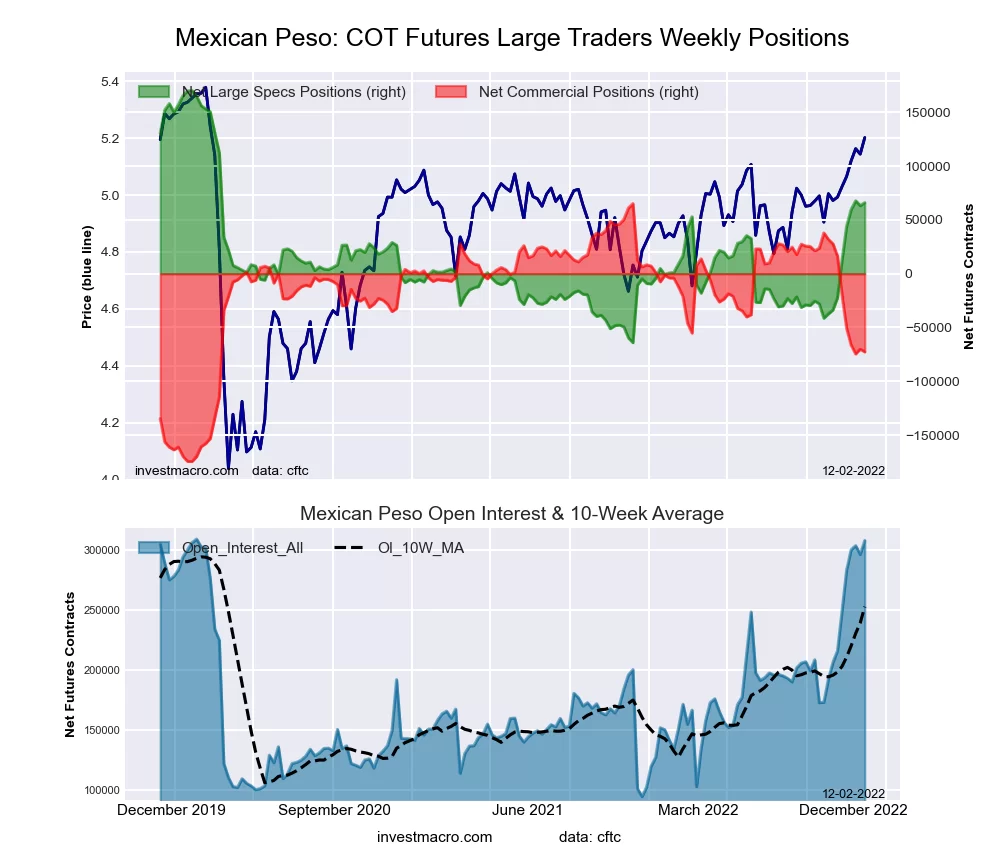 The Mexican Peso large speculator standing this week recorded a net position of 66,086 contracts in the data reported through Tuesday. This was a weekly lift of 2,767 contracts from the previous week which had a total of 63,319 net contracts.
This week’s current strength score (the trader positioning range over the past three years, measured from 0 to 100) shows the speculators are currently Bullish with a score of 55.5 percent. The commercials are Bearish with a score of 42.5 percent and the small traders (not shown in chart) are Bullish with a score of 71.3 percent.
| MEXICAN PESO Statistics | SPECULATORS | COMMERCIALS | SMALL TRADERS |
| – Percent of Open Interest Longs: | 64.9 | 32.0 | 3.0 |
| – Percent of Open Interest Shorts: | 43.4 | 55.6 | 0.8 |
| – Net Position: | 66,086 | -72,759 | 6,673 |
| – Gross Longs: | 199,744 | 98,322 | 9,226 |
| – Gross Shorts: | 133,658 | 171,081 | 2,553 |
| – Long to Short Ratio: | 1.5 to 1 | 0.6 to 1 | 3.6 to 1 |
| NET POSITION TREND: | | | |
| – Strength Index Score (3 Year Range Pct): | 55.5 | 42.5 | 71.3 |
| – Strength Index Reading (3 Year Range): | Bullish | Bearish | Bullish |
| NET POSITION MOVEMENT INDEX: | | | |
| – 6-Week Change in Strength Index: | 37.7 | -37.1 | 2.8 |
Brazilian Real Futures:
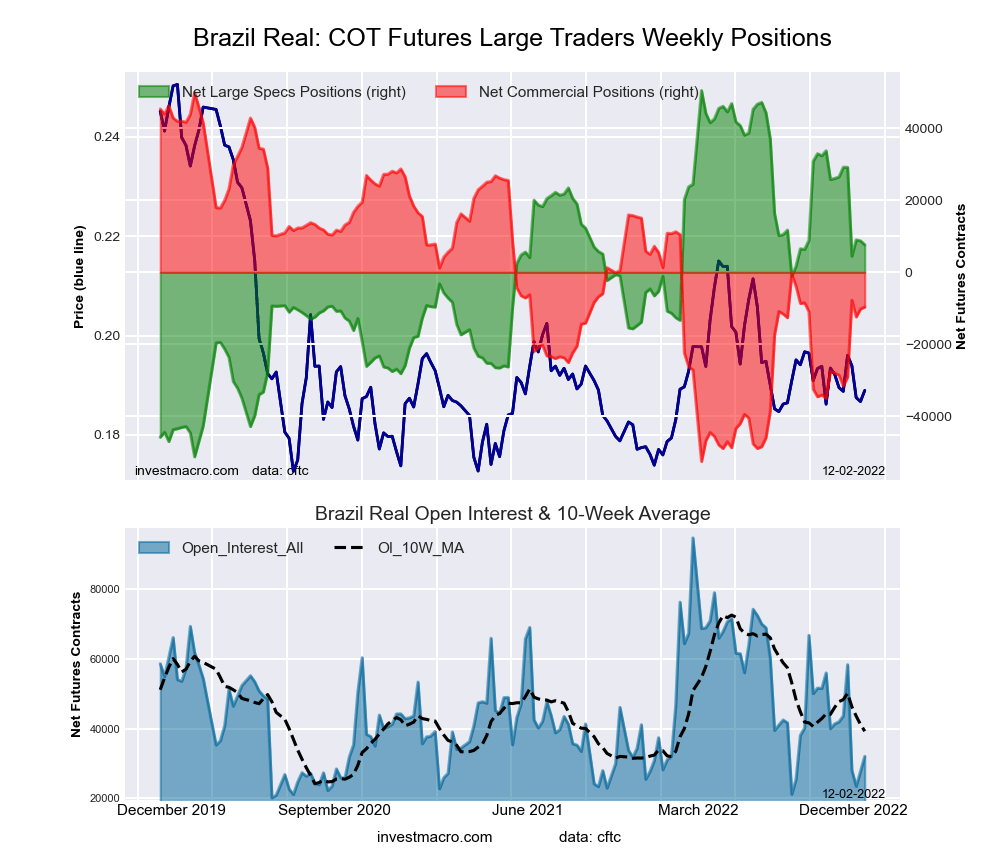 The Brazilian Real large speculator standing this week recorded a net position of 7,637 contracts in the data reported through Tuesday. This was a weekly fall of -1,099 contracts from the previous week which had a total of 8,736 net contracts.
This week’s current strength score (the trader positioning range over the past three years, measured from 0 to 100) shows the speculators are currently Bullish with a score of 56.0 percent. The commercials are Bearish with a score of 43.6 percent and the small traders (not shown in chart) are Bullish-Extreme with a score of 84.7 percent.
| BRAZIL REAL Statistics | SPECULATORS | COMMERCIALS | SMALL TRADERS |
| – Percent of Open Interest Longs: | 51.5 | 36.0 | 11.4 |
| – Percent of Open Interest Shorts: | 27.6 | 66.1 | 5.1 |
| – Net Position: | 7,637 | -9,659 | 2,022 |
| – Gross Longs: | 16,500 | 11,541 | 3,666 |
| – Gross Shorts: | 8,863 | 21,200 | 1,644 |
| – Long to Short Ratio: | 1.9 to 1 | 0.5 to 1 | 2.2 to 1 |
| NET POSITION TREND: | | | |
| – Strength Index Score (3 Year Range Pct): | 56.0 | 43.6 | 84.7 |
| – Strength Index Reading (3 Year Range): | Bullish | Bearish | Bullish-Extreme |
| NET POSITION MOVEMENT INDEX: | | | |
| – 6-Week Change in Strength Index: | -19.3 | 19.2 | -0.7 |
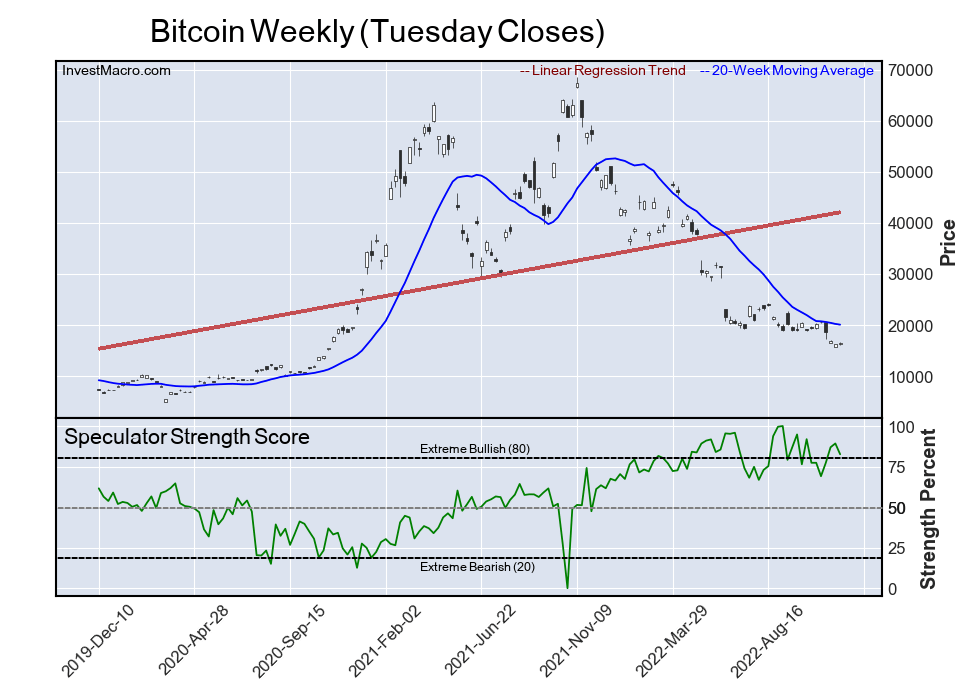
Bitcoin Futures:
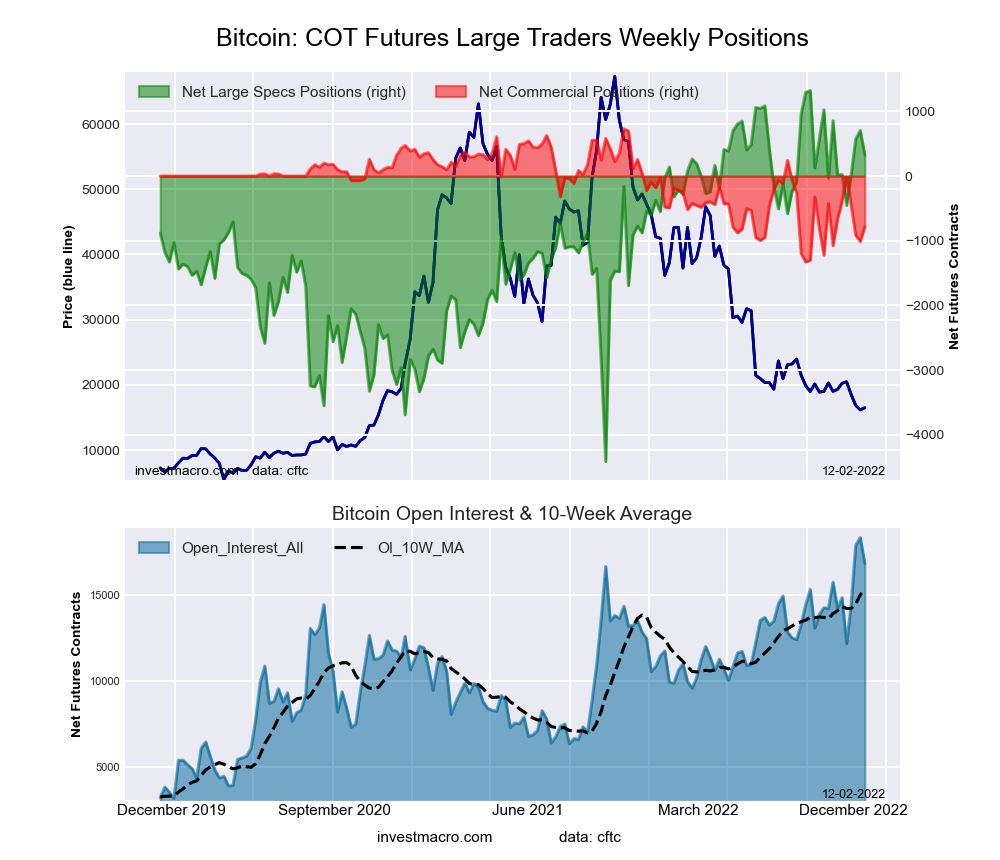 The Bitcoin large speculator standing this week recorded a net position of 324 contracts in the data reported through Tuesday. This was a weekly lowering of -382 contracts from the previous week which had a total of 706 net contracts.
This week’s current strength score (the trader positioning range over the past three years, measured from 0 to 100) shows the speculators are currently Bullish-Extreme with a score of 82.6 percent. The commercials are Bearish with a score of 26.6 percent and the small traders (not shown in chart) are Bearish with a score of 23.3 percent.
| BITCOIN Statistics | SPECULATORS | COMMERCIALS | SMALL TRADERS |
| – Percent of Open Interest Longs: | 81.9 | 0.8 | 7.3 |
| – Percent of Open Interest Shorts: | 80.0 | 5.4 | 4.6 |
| – Net Position: | 324 | -780 | 456 |
| – Gross Longs: | 13,783 | 127 | 1,236 |
| – Gross Shorts: | 13,459 | 907 | 780 |
| – Long to Short Ratio: | 1.0 to 1 | 0.1 to 1 | 1.6 to 1 |
| NET POSITION TREND: | | | |
| – Strength Index Score (3 Year Range Pct): | 82.6 | 26.6 | 23.3 |
| – Strength Index Reading (3 Year Range): | Bullish-Extreme | Bearish | Bearish |
| NET POSITION MOVEMENT INDEX: | | | |
| – 6-Week Change in Strength Index: | 5.3 | -5.6 | -4.3 |
Article By InvestMacro – Receive our weekly COT Newsletter
*COT Report: The COT data, released weekly to the public each Friday, is updated through the most recent Tuesday (data is 3 days old) and shows a quick view of how large speculators or non-commercials (for-profit traders) were positioned in the futures markets.
The CFTC categorizes trader positions according to commercial hedgers (traders who use futures contracts for hedging as part of the business), non-commercials (large traders who speculate to realize trading profits) and nonreportable traders (usually small traders/speculators) as well as their open interest (contracts open in the market at time of reporting). See CFTC criteria here.


