By InvestMacro
Here are the latest charts and statistics for the Commitment of Traders (COT) data published by the Commodities Futures Trading Commission (CFTC).
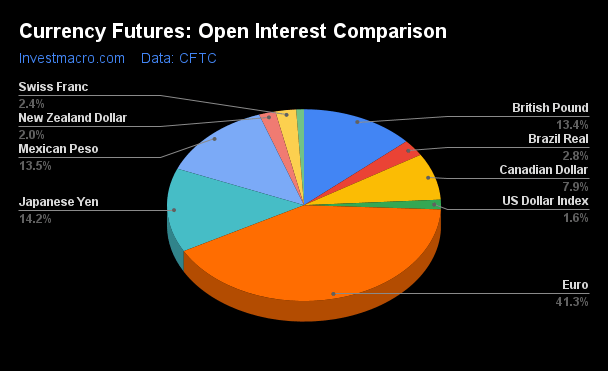
The latest COT data is updated through Tuesday July 11th and shows a quick view of how large market participants (for-profit speculators and commercial traders) were positioned in the futures markets. All currency positions are in direct relation to the US dollar where, for example, a bet for the euro is a bet that the euro will rise versus the dollar while a bet against the euro will be a bet that the euro will decline versus the dollar.
Weekly Speculator Changes led by British Pound & Brazilian Real
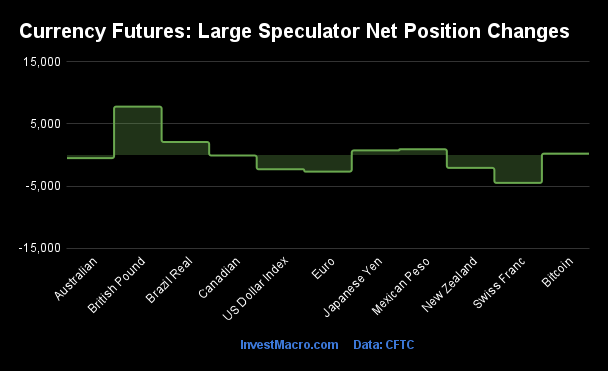
The COT currency market speculator bets were lower this week as five out of the eleven currency markets we cover had higher positioning while the other six markets had lower speculator contracts.
Leading the gains for the currency markets was the British Pound (7,798 contracts) with the Brazilian Real (2,094 contracts), Mexican Peso (926 contracts), Japanese Yen (738 contracts) and Bitcoin (221 contracts) also showing positive weeks.
The currencies seeing declines in speculator bets on the week were the Swiss Franc (-4,503 contracts), the US Dollar Index (-2,306 contracts), EuroFX (-2,675 contracts), the New Zealand Dollar (-2,081 contracts), the Australian Dollar (-502 contracts) and the Canadian Dollar (-83 contracts)also registering lower bets on the week.
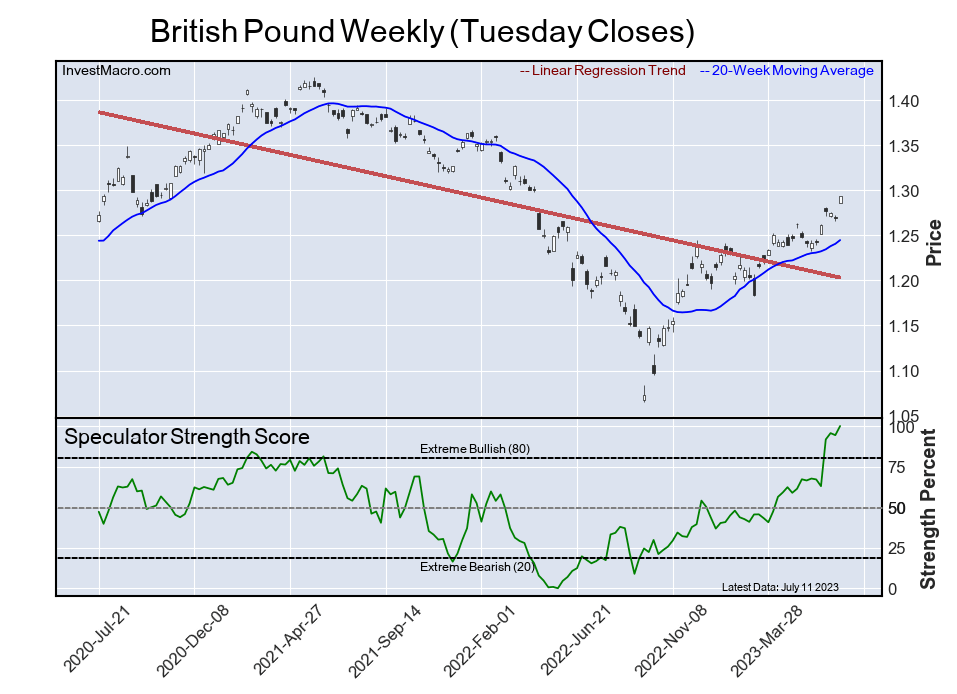
British Pound Speculator bets jump to 15-year high as GBP closes above 1.30
Highlighting the COT currency’s data this week is the bullish strength in the speculator’s positioning of the British Pound Sterling. Large speculative Pound positions rose this week by almost +8,000 contracts and have now increased their bullish positions in three out of the past four weeks.
The overall gain for the past four weeks now totals +51,328 contracts. This has pushed the overall net position, which currently sits at +58,063 contracts, to the highest speculator bullish standing since November 6th of 2007, an over 15-year high.
The Pound’s positioning has been helped out by the Bank of England’s most recent interest rate increase in June that was by 50 basis points and brought the bank rate to 5 percent – its highest sitting in the past 15 years as well. Traders are forecasting more rate hikes out of the UK due to high inflation while other countries, like the US, are likely nearing the end of a rate-rising cycle.
The Pound Sterling exchange rate against the US Dollar has been streaking higher this year and this week closed above the 1.3000 exchange rate for the first time since April of 2022. The GBPUSD currency pair had touched a low near 1.0360 as recently as September and has been on a strong uptrend since then. The GBPUSD has now risen by approximately 25 percent since that September bottom.
| Jul-11-2023 | OI | OI-Index | Spec-Net | Spec-Index | Com-Net | COM-Index | Smalls-Net | Smalls-Index |
|---|
| USD Index | 28,925 | 6 | 12,011 | 45 | -13,577 | 54 | 1,566 | 34 |
| EUR | 736,056 | 56 | 140,162 | 72 | -192,462 | 25 | 52,300 | 62 |
| GBP | 239,125 | 61 | 58,063 | 100 | -72,701 | 0 | 14,638 | 87 |
| JPY | 252,349 | 79 | -117,182 | 0 | 129,077 | 99 | -11,895 | 29 |
| CHF | 43,563 | 48 | -7,907 | 34 | 8,165 | 58 | -258 | 57 |
| CAD | 140,395 | 19 | 4,444 | 59 | -14,026 | 47 | 9,582 | 44 |
| AUD | 152,495 | 42 | -45,084 | 43 | 54,035 | 59 | -8,951 | 31 |
| NZD | 34,947 | 20 | -1,251 | 50 | 2,619 | 53 | -1,368 | 34 |
| MXN | 239,738 | 51 | 96,166 | 98 | -99,493 | 2 | 3,327 | 32 |
| RUB | 20,930 | 4 | 7,543 | 31 | -7,150 | 69 | -393 | 24 |
| BRL | 49,363 | 38 | 33,198 | 78 | -31,193 | 26 | -2,005 | 28 |
| Bitcoin | 16,302 | 80 | -1,855 | 45 | 804 | 0 | 1,051 | 37 |
Strength Scores led by British Pound & Mexican Peso
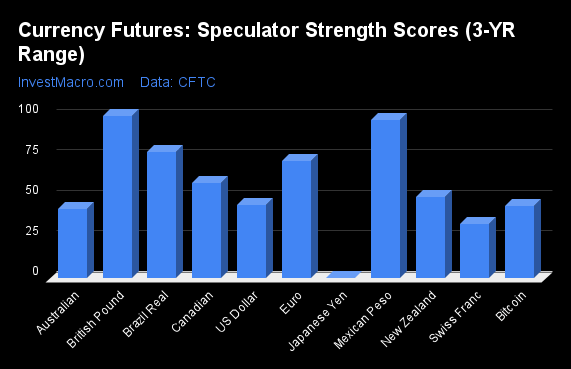
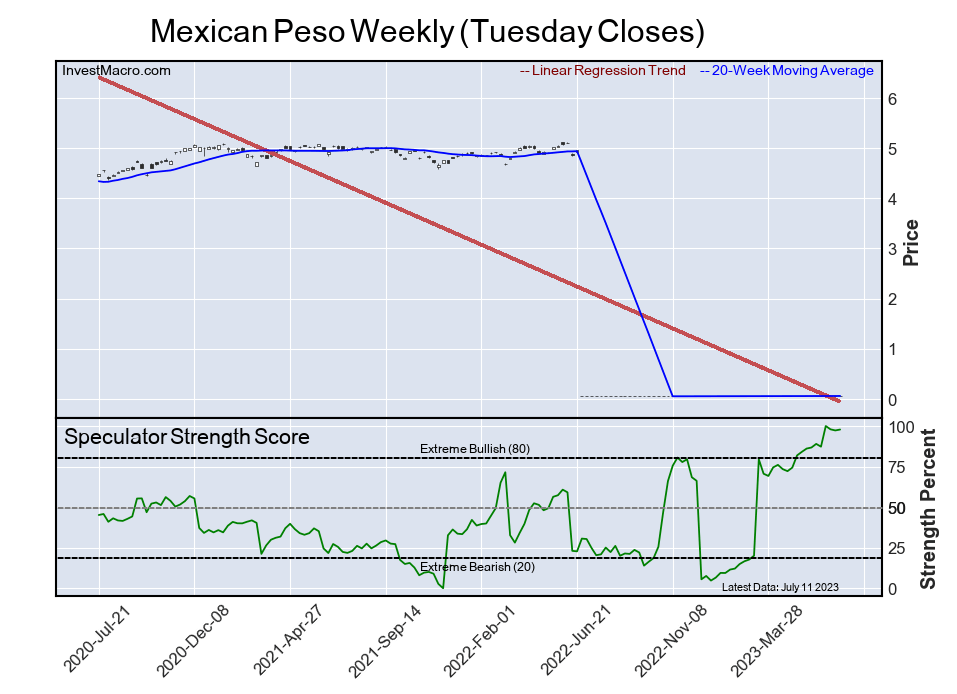
COT Strength Scores (a normalized measure of Speculator positions over a 3-Year range, from 0 to 100 where above 80 is Extreme-Bullish and below 20 is Extreme-Bearish) showed that the British Pound (100 percent) and the Mexican Peso (98 percent) lead the currency markets this week. The Brazilian Real (78 percent), EuroFX (72 percent) and the Canadian Dollar (59 percent) come in as the next highest in the weekly strength scores.
On the downside, the Japanese Yen (0 percent) and the Swiss Franc (34 percent) come in at the lowest strength levels currently and are in Extreme-Bearish territory (below 20 percent). The next lowest strength scores are the Australian Dollar (43 percent) and the Bitcoin (45 percent).
Strength Statistics:
US Dollar Index (45.0 percent) vs US Dollar Index previous week (48.8 percent)
EuroFX (72.4 percent) vs EuroFX previous week (73.4 percent)
British Pound Sterling (100.0 percent) vs British Pound Sterling previous week (94.4 percent)
Japanese Yen (0.4 percent) vs Japanese Yen previous week (0.0 percent)
Swiss Franc (33.7 percent) vs Swiss Franc previous week (45.6 percent)
Canadian Dollar (58.7 percent) vs Canadian Dollar previous week (58.8 percent)
Australian Dollar (43.0 percent) vs Australian Dollar previous week (43.5 percent)
New Zealand Dollar (50.2 percent) vs New Zealand Dollar previous week (55.8 percent)
Mexican Peso (97.8 percent) vs Mexican Peso previous week (97.3 percent)
Brazilian Real (78.0 percent) vs Brazilian Real previous week (75.3 percent)
Bitcoin (44.6 percent) vs Bitcoin previous week (40.7 percent)
British Pound & Canadian Dollar top the 6-Week Strength Trends
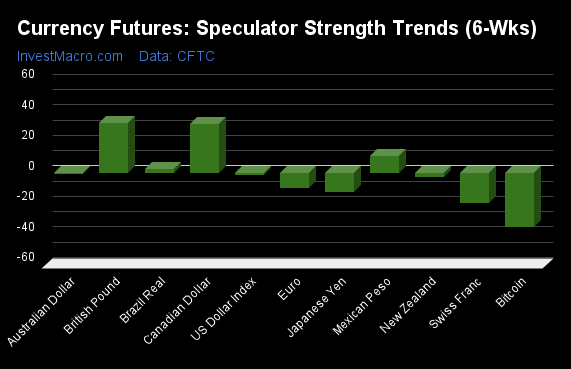
COT Strength Score Trends (or move index, calculates the 6-week changes in strength scores) showed that the British Pound (32 percent) and the Canadian Dollar (32 percent) lead the past six weeks trends for the currencies. The Mexican Peso (11 percent), the Brazilian Real (2 percent) and the US Dollar Index (-1 percent) are the next highest positive movers in the latest trends data.
The Bitcoin (-36 percent) leads the downside trend scores currently with the Swiss Franc (-20 percent), Japanese Yen (-12 percent) and the EuroFX (-10 percent) following next with lower trend scores.
Strength Trend Statistics:
US Dollar Index (-1.3 percent) vs US Dollar Index previous week (5.1 percent)
EuroFX (-9.9 percent) vs EuroFX previous week (-11.9 percent)
British Pound Sterling (32.4 percent) vs British Pound Sterling previous week (27.9 percent)
Japanese Yen (-12.5 percent) vs Japanese Yen previous week (-22.1 percent)
Swiss Franc (-19.8 percent) vs Swiss Franc previous week (-6.6 percent)
Canadian Dollar (32.0 percent) vs Canadian Dollar previous week (49.5 percent)
Australian Dollar (-0.9 percent) vs Australian Dollar previous week (4.2 percent)
New Zealand Dollar (-3.0 percent) vs New Zealand Dollar previous week (3.2 percent)
Mexican Peso (11.1 percent) vs Mexican Peso previous week (11.2 percent)
Brazilian Real (2.4 percent) vs Brazilian Real previous week (-2.0 percent)
Bitcoin (-35.6 percent) vs Bitcoin previous week (-51.8 percent)
Individual COT Forex Markets:
US Dollar Index Futures:
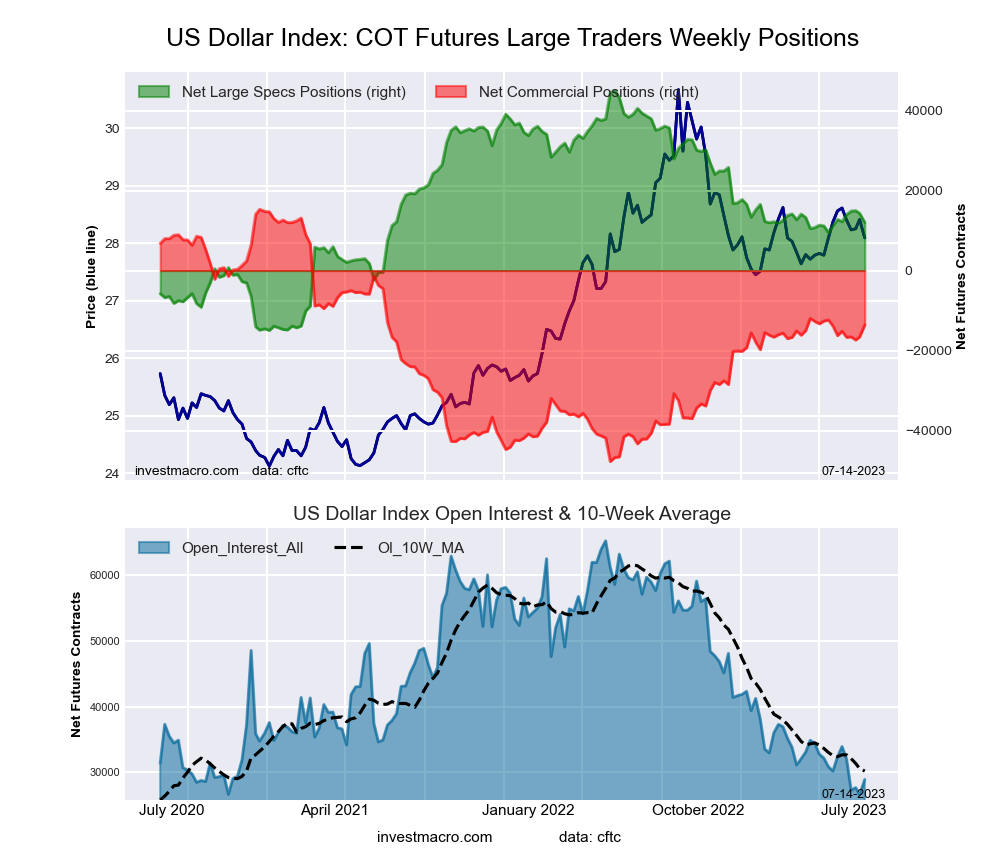 The US Dollar Index large speculator standing this week equaled a net position of 12,011 contracts in the data reported through Tuesday. This was a weekly decline of -2,306 contracts from the previous week which had a total of 14,317 net contracts.
This week’s current strength score (the trader positioning range over the past three years, measured from 0 to 100) shows the speculators are currently Bearish with a score of 45.0 percent. The commercials are Bullish with a score of 54.2 percent and the small traders (not shown in chart) are Bearish with a score of 33.6 percent.
Price Trend-Following Model: Weak Uptrend
Our weekly trend-following model classifies the current market price position as: Weak Uptrend. The current action for the model is considered to be: Hold – Maintain Long Position.
| US DOLLAR INDEX Statistics | SPECULATORS | COMMERCIALS | SMALL TRADERS |
| – Percent of Open Interest Longs: | 71.7 | 8.8 | 14.9 |
| – Percent of Open Interest Shorts: | 30.2 | 55.7 | 9.5 |
| – Net Position: | 12,011 | -13,577 | 1,566 |
| – Gross Longs: | 20,741 | 2,536 | 4,316 |
| – Gross Shorts: | 8,730 | 16,113 | 2,750 |
| – Long to Short Ratio: | 2.4 to 1 | 0.2 to 1 | 1.6 to 1 |
| NET POSITION TREND: | | | |
| – Strength Index Score (3 Year Range Pct): | 45.0 | 54.2 | 33.6 |
| – Strength Index Reading (3 Year Range): | Bearish | Bullish | Bearish |
| NET POSITION MOVEMENT INDEX: | | | |
| – 6-Week Change in Strength Index: | -1.3 | 4.3 | -21.1 |
Euro Currency Futures:
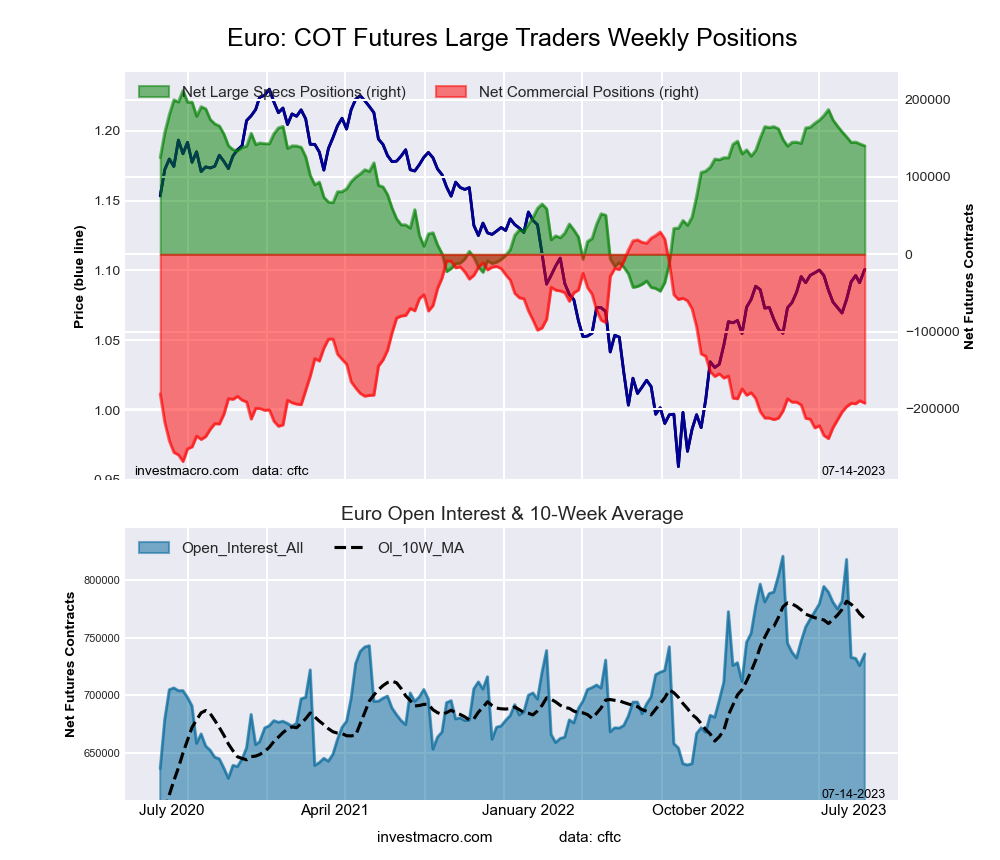 The Euro Currency large speculator standing this week equaled a net position of 140,162 contracts in the data reported through Tuesday. This was a weekly decline of -2,675 contracts from the previous week which had a total of 142,837 net contracts.
This week’s current strength score (the trader positioning range over the past three years, measured from 0 to 100) shows the speculators are currently Bullish with a score of 72.4 percent. The commercials are Bearish with a score of 25.4 percent and the small traders (not shown in chart) are Bullish with a score of 62.4 percent.
Price Trend-Following Model: Strong Uptrend
Our weekly trend-following model classifies the current market price position as: Strong Uptrend. The current action for the model is considered to be: Hold – Maintain Long Position.
| EURO Currency Statistics | SPECULATORS | COMMERCIALS | SMALL TRADERS |
| – Percent of Open Interest Longs: | 30.5 | 54.8 | 13.0 |
| – Percent of Open Interest Shorts: | 11.4 | 81.0 | 5.9 |
| – Net Position: | 140,162 | -192,462 | 52,300 |
| – Gross Longs: | 224,351 | 403,460 | 95,768 |
| – Gross Shorts: | 84,189 | 595,922 | 43,468 |
| – Long to Short Ratio: | 2.7 to 1 | 0.7 to 1 | 2.2 to 1 |
| NET POSITION TREND: | | | |
| – Strength Index Score (3 Year Range Pct): | 72.4 | 25.4 | 62.4 |
| – Strength Index Reading (3 Year Range): | Bullish | Bearish | Bullish |
| NET POSITION MOVEMENT INDEX: | | | |
| – 6-Week Change in Strength Index: | -9.9 | 7.3 | 6.4 |
British Pound Sterling Futures:
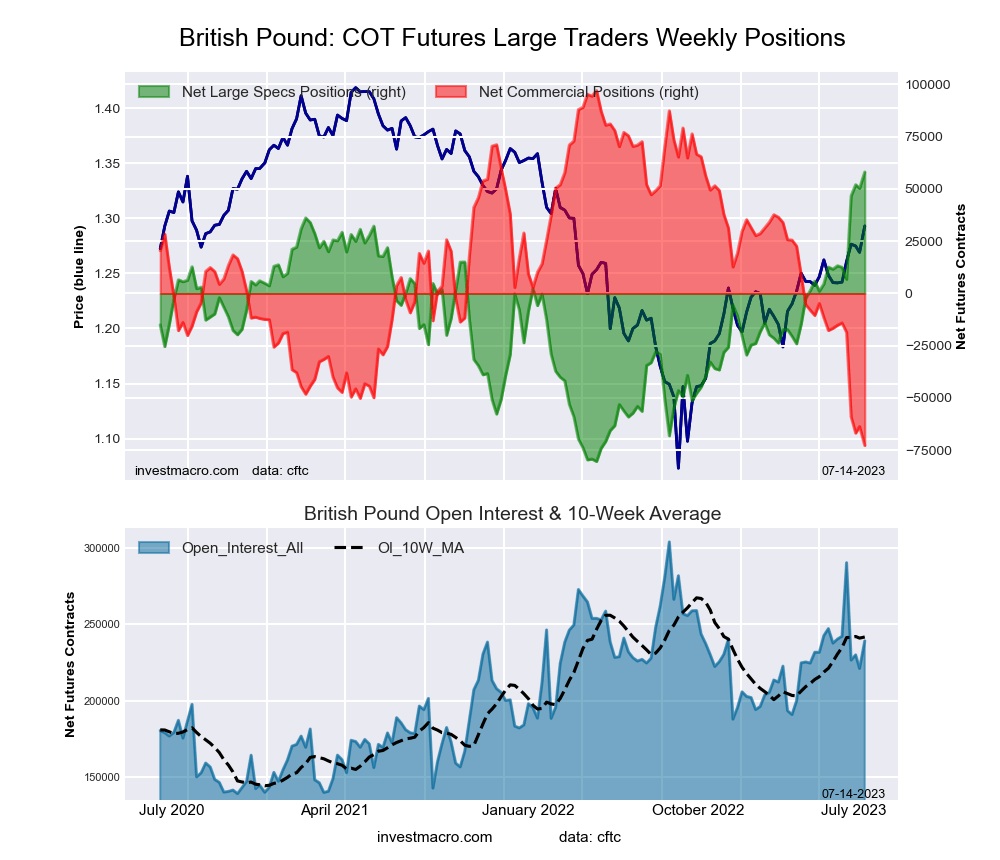 The British Pound Sterling large speculator standing this week equaled a net position of 58,063 contracts in the data reported through Tuesday. This was a weekly boost of 7,798 contracts from the previous week which had a total of 50,265 net contracts.
This week’s current strength score (the trader positioning range over the past three years, measured from 0 to 100) shows the speculators are currently Bullish-Extreme with a score of 100.0 percent. The commercials are Bearish-Extreme with a score of 0.0 percent and the small traders (not shown in chart) are Bullish-Extreme with a score of 86.7 percent.
Price Trend-Following Model: Strong Uptrend
Our weekly trend-following model classifies the current market price position as: Strong Uptrend. The current action for the model is considered to be: Hold – Maintain Long Position.
| BRITISH POUND Statistics | SPECULATORS | COMMERCIALS | SMALL TRADERS |
| – Percent of Open Interest Longs: | 46.7 | 30.6 | 16.7 |
| – Percent of Open Interest Shorts: | 22.4 | 61.0 | 10.5 |
| – Net Position: | 58,063 | -72,701 | 14,638 |
| – Gross Longs: | 111,667 | 73,150 | 39,825 |
| – Gross Shorts: | 53,604 | 145,851 | 25,187 |
| – Long to Short Ratio: | 2.1 to 1 | 0.5 to 1 | 1.6 to 1 |
| NET POSITION TREND: | | | |
| – Strength Index Score (3 Year Range Pct): | 100.0 | 0.0 | 86.7 |
| – Strength Index Reading (3 Year Range): | Bullish-Extreme | Bearish-Extreme | Bullish-Extreme |
| NET POSITION MOVEMENT INDEX: | | | |
| – 6-Week Change in Strength Index: | 32.4 | -33.9 | 24.8 |
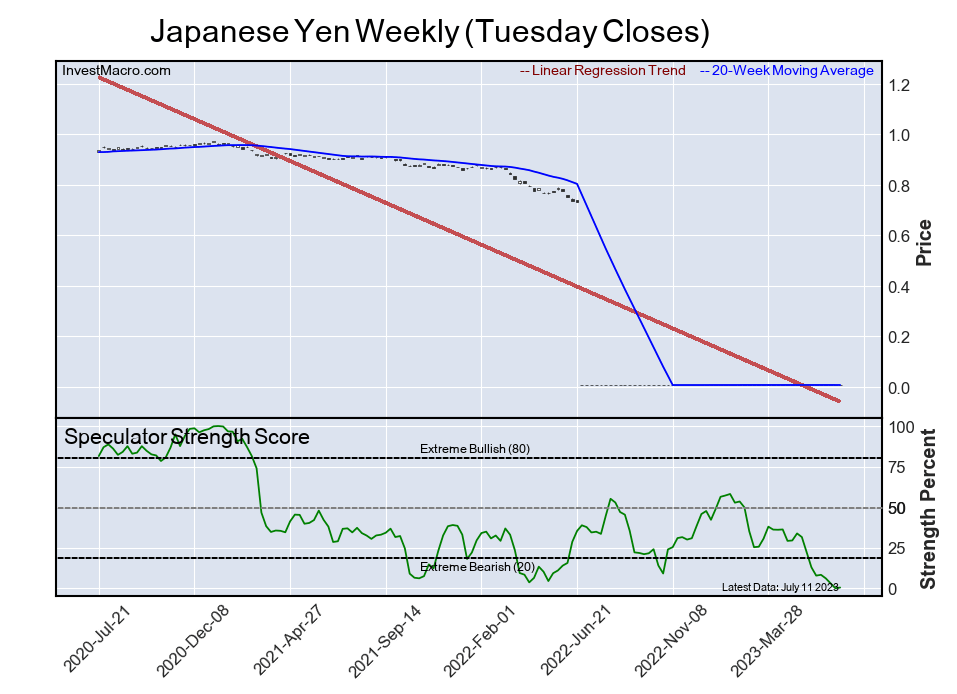
Japanese Yen Futures:
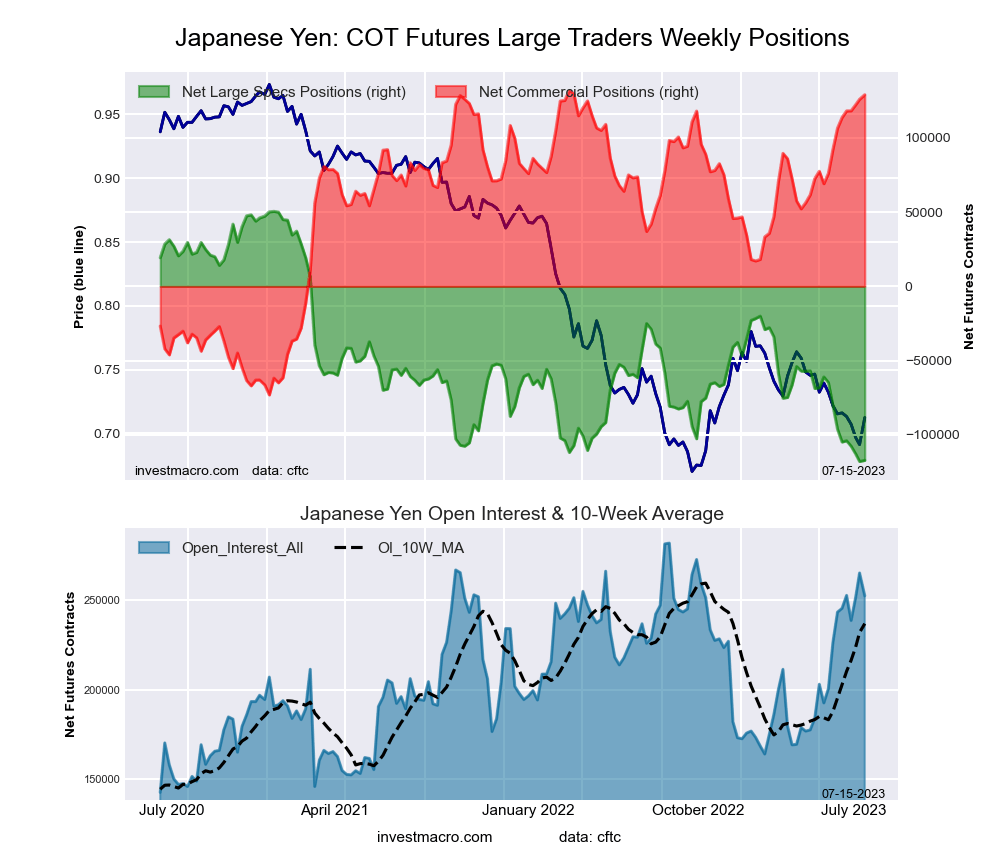 The Japanese Yen large speculator standing this week equaled a net position of -117,182 contracts in the data reported through Tuesday. This was a weekly rise of 738 contracts from the previous week which had a total of -117,920 net contracts.
This week’s current strength score (the trader positioning range over the past three years, measured from 0 to 100) shows the speculators are currently Bearish-Extreme with a score of 0.4 percent. The commercials are Bullish-Extreme with a score of 98.6 percent and the small traders (not shown in chart) are Bearish with a score of 29.3 percent.
Price Trend-Following Model: Downtrend
Our weekly trend-following model classifies the current market price position as: Downtrend. The current action for the model is considered to be: Hold – Maintain Short Position.
| JAPANESE YEN Statistics | SPECULATORS | COMMERCIALS | SMALL TRADERS |
| – Percent of Open Interest Longs: | 11.8 | 75.4 | 11.6 |
| – Percent of Open Interest Shorts: | 58.3 | 24.2 | 16.3 |
| – Net Position: | -117,182 | 129,077 | -11,895 |
| – Gross Longs: | 29,838 | 190,189 | 29,288 |
| – Gross Shorts: | 147,020 | 61,112 | 41,183 |
| – Long to Short Ratio: | 0.2 to 1 | 3.1 to 1 | 0.7 to 1 |
| NET POSITION TREND: | | | |
| – Strength Index Score (3 Year Range Pct): | 0.4 | 98.6 | 29.3 |
| – Strength Index Reading (3 Year Range): | Bearish-Extreme | Bullish-Extreme | Bearish |
| NET POSITION MOVEMENT INDEX: | | | |
| – 6-Week Change in Strength Index: | -12.5 | 11.0 | -3.2 |
Swiss Franc Futures:
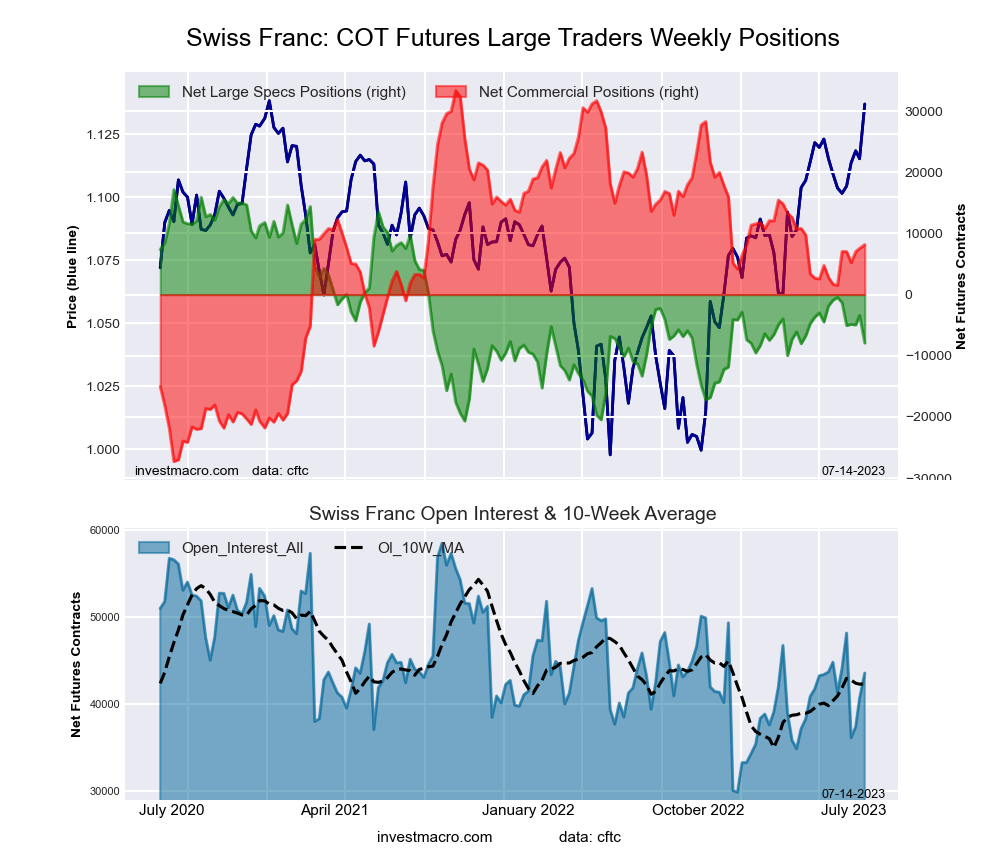 The Swiss Franc large speculator standing this week equaled a net position of -7,907 contracts in the data reported through Tuesday. This was a weekly decrease of -4,503 contracts from the previous week which had a total of -3,404 net contracts.
This week’s current strength score (the trader positioning range over the past three years, measured from 0 to 100) shows the speculators are currently Bearish with a score of 33.7 percent. The commercials are Bullish with a score of 58.5 percent and the small traders (not shown in chart) are Bullish with a score of 56.7 percent.
Price Trend-Following Model: Strong Uptrend
Our weekly trend-following model classifies the current market price position as: Strong Uptrend. The current action for the model is considered to be: Hold – Maintain Long Position.
| SWISS FRANC Statistics | SPECULATORS | COMMERCIALS | SMALL TRADERS |
| – Percent of Open Interest Longs: | 17.0 | 47.3 | 35.4 |
| – Percent of Open Interest Shorts: | 35.2 | 28.6 | 36.0 |
| – Net Position: | -7,907 | 8,165 | -258 |
| – Gross Longs: | 7,417 | 20,604 | 15,411 |
| – Gross Shorts: | 15,324 | 12,439 | 15,669 |
| – Long to Short Ratio: | 0.5 to 1 | 1.7 to 1 | 1.0 to 1 |
| NET POSITION TREND: | | | |
| – Strength Index Score (3 Year Range Pct): | 33.7 | 58.5 | 56.7 |
| – Strength Index Reading (3 Year Range): | Bearish | Bullish | Bullish |
| NET POSITION MOVEMENT INDEX: | | | |
| – 6-Week Change in Strength Index: | -19.8 | 10.9 | 2.8 |
Canadian Dollar Futures:
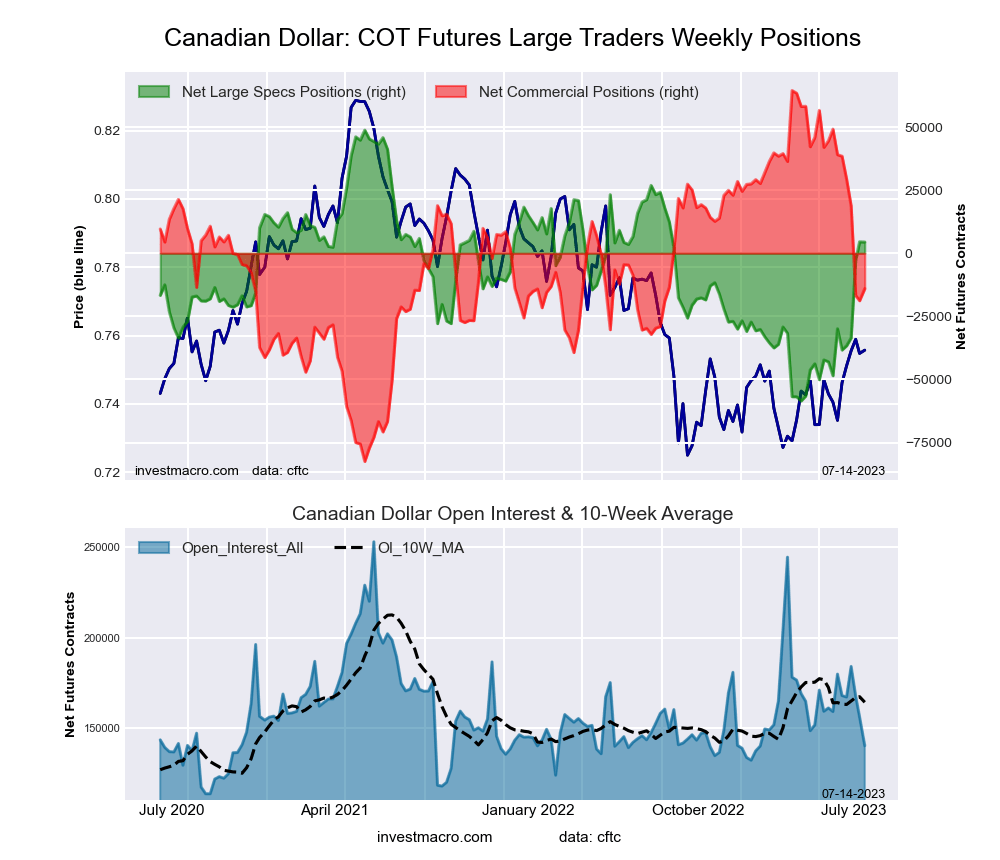 The Canadian Dollar large speculator standing this week equaled a net position of 4,444 contracts in the data reported through Tuesday. This was a weekly fall of -83 contracts from the previous week which had a total of 4,527 net contracts.
This week’s current strength score (the trader positioning range over the past three years, measured from 0 to 100) shows the speculators are currently Bullish with a score of 58.7 percent. The commercials are Bearish with a score of 46.6 percent and the small traders (not shown in chart) are Bearish with a score of 44.1 percent.
Price Trend-Following Model: Strong Uptrend
Our weekly trend-following model classifies the current market price position as: Strong Uptrend. The current action for the model is considered to be: Hold – Maintain Long Position.
| CANADIAN DOLLAR Statistics | SPECULATORS | COMMERCIALS | SMALL TRADERS |
| – Percent of Open Interest Longs: | 25.0 | 49.1 | 23.4 |
| – Percent of Open Interest Shorts: | 21.8 | 59.1 | 16.6 |
| – Net Position: | 4,444 | -14,026 | 9,582 |
| – Gross Longs: | 35,072 | 68,935 | 32,865 |
| – Gross Shorts: | 30,628 | 82,961 | 23,283 |
| – Long to Short Ratio: | 1.1 to 1 | 0.8 to 1 | 1.4 to 1 |
| NET POSITION TREND: | | | |
| – Strength Index Score (3 Year Range Pct): | 58.7 | 46.6 | 44.1 |
| – Strength Index Reading (3 Year Range): | Bullish | Bearish | Bearish |
| NET POSITION MOVEMENT INDEX: | | | |
| – 6-Week Change in Strength Index: | 32.0 | -36.1 | 41.5 |
Australian Dollar Futures:
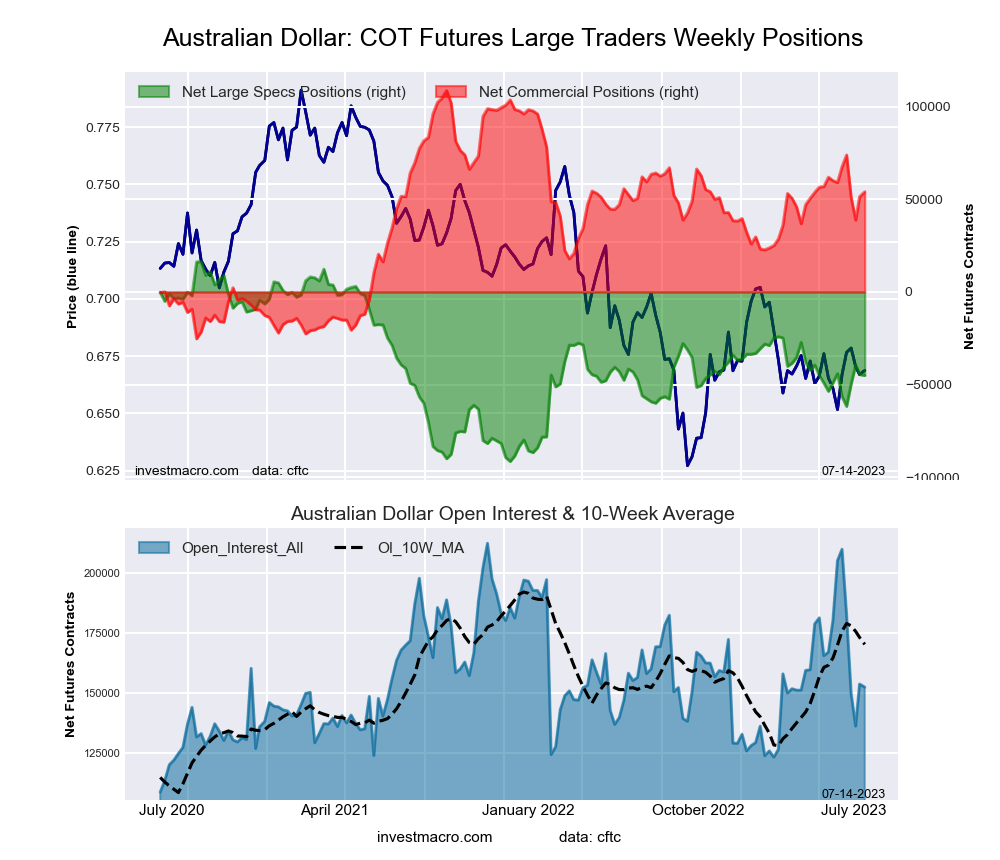 The Australian Dollar large speculator standing this week equaled a net position of -45,084 contracts in the data reported through Tuesday. This was a weekly decline of -502 contracts from the previous week which had a total of -44,582 net contracts.
This week’s current strength score (the trader positioning range over the past three years, measured from 0 to 100) shows the speculators are currently Bearish with a score of 43.0 percent. The commercials are Bullish with a score of 59.2 percent and the small traders (not shown in chart) are Bearish with a score of 30.6 percent.
Price Trend-Following Model: Strong Uptrend
Our weekly trend-following model classifies the current market price position as: Strong Uptrend. The current action for the model is considered to be: New Buy – Long Position.
| AUSTRALIAN DOLLAR Statistics | SPECULATORS | COMMERCIALS | SMALL TRADERS |
| – Percent of Open Interest Longs: | 28.6 | 57.4 | 10.7 |
| – Percent of Open Interest Shorts: | 58.2 | 21.9 | 16.6 |
| – Net Position: | -45,084 | 54,035 | -8,951 |
| – Gross Longs: | 43,661 | 87,458 | 16,392 |
| – Gross Shorts: | 88,745 | 33,423 | 25,343 |
| – Long to Short Ratio: | 0.5 to 1 | 2.6 to 1 | 0.6 to 1 |
| NET POSITION TREND: | | | |
| – Strength Index Score (3 Year Range Pct): | 43.0 | 59.2 | 30.6 |
| – Strength Index Reading (3 Year Range): | Bearish | Bullish | Bearish |
| NET POSITION MOVEMENT INDEX: | | | |
| – 6-Week Change in Strength Index: | -0.9 | -3.8 | 14.7 |
New Zealand Dollar Futures:
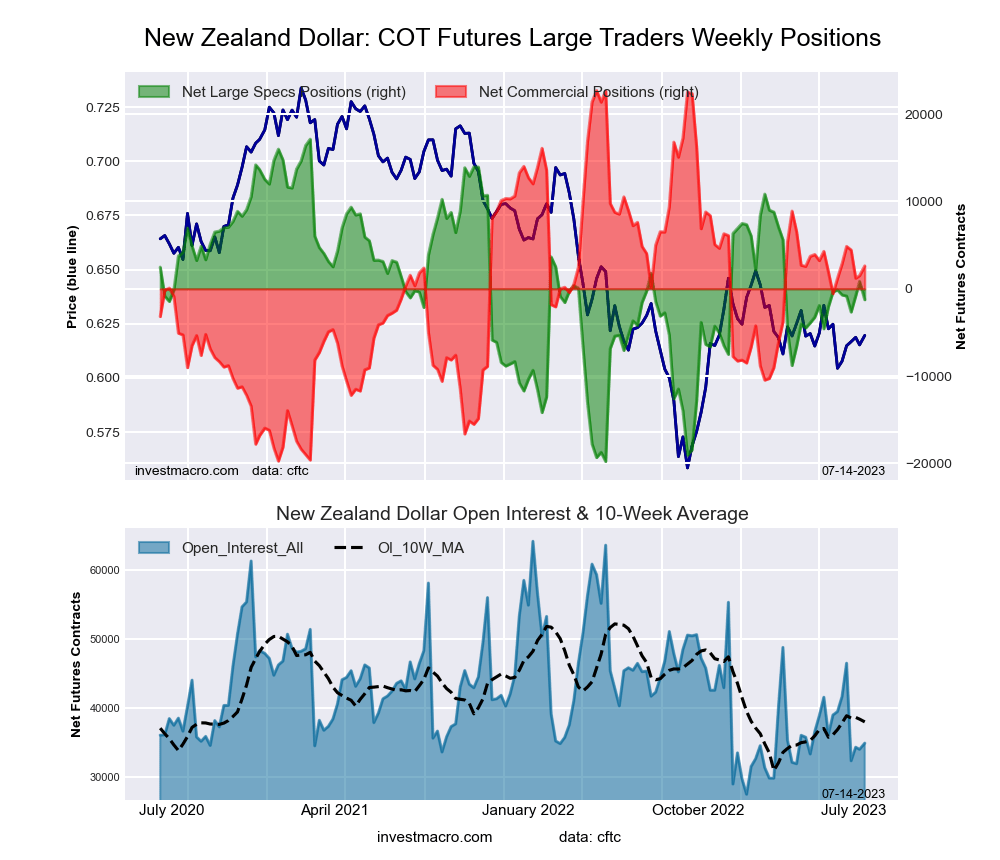 The New Zealand Dollar large speculator standing this week equaled a net position of -1,251 contracts in the data reported through Tuesday. This was a weekly lowering of -2,081 contracts from the previous week which had a total of 830 net contracts.
This week’s current strength score (the trader positioning range over the past three years, measured from 0 to 100) shows the speculators are currently Bullish with a score of 50.2 percent. The commercials are Bullish with a score of 52.7 percent and the small traders (not shown in chart) are Bearish with a score of 33.7 percent.
Price Trend-Following Model: Weak Downtrend
Our weekly trend-following model classifies the current market price position as: Weak Downtrend. The current action for the model is considered to be: Hold – Maintain Short Position.
| NEW ZEALAND DOLLAR Statistics | SPECULATORS | COMMERCIALS | SMALL TRADERS |
| – Percent of Open Interest Longs: | 38.0 | 53.4 | 7.6 |
| – Percent of Open Interest Shorts: | 41.6 | 45.9 | 11.5 |
| – Net Position: | -1,251 | 2,619 | -1,368 |
| – Gross Longs: | 13,297 | 18,666 | 2,656 |
| – Gross Shorts: | 14,548 | 16,047 | 4,024 |
| – Long to Short Ratio: | 0.9 to 1 | 1.2 to 1 | 0.7 to 1 |
| NET POSITION TREND: | | | |
| – Strength Index Score (3 Year Range Pct): | 50.2 | 52.7 | 33.7 |
| – Strength Index Reading (3 Year Range): | Bullish | Bullish | Bearish |
| NET POSITION MOVEMENT INDEX: | | | |
| – 6-Week Change in Strength Index: | -3.0 | 3.4 | -3.6 |
Mexican Peso Futures:
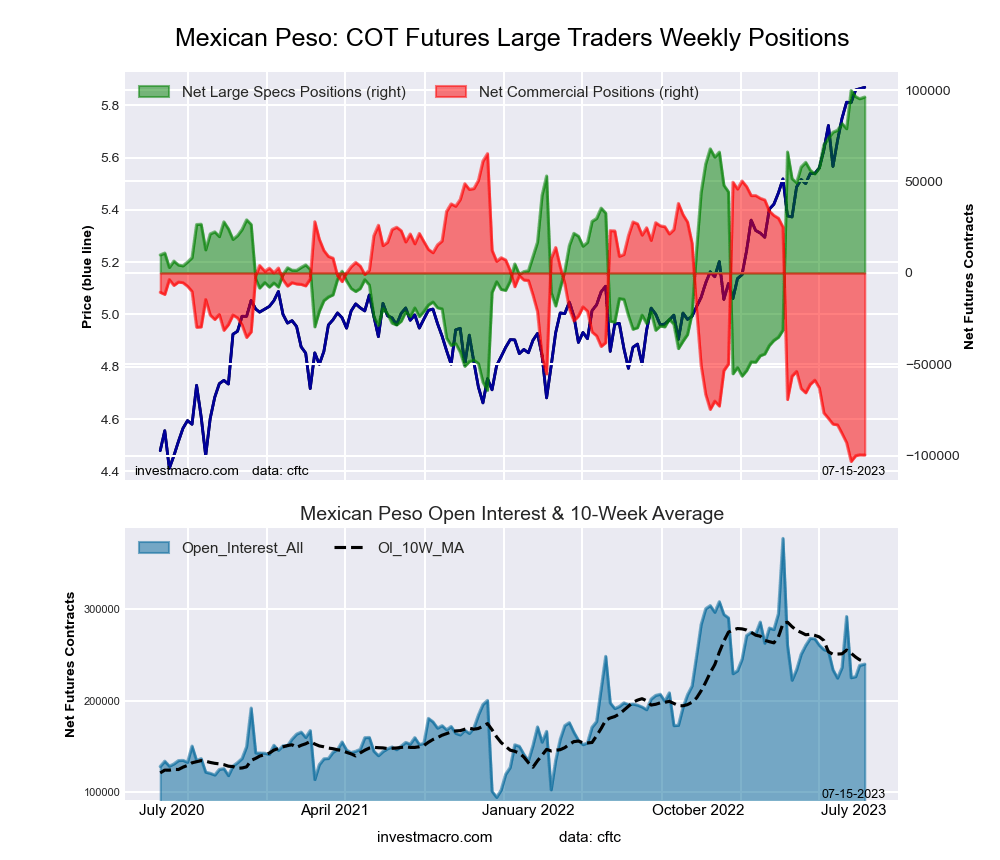 The Mexican Peso large speculator standing this week equaled a net position of 96,166 contracts in the data reported through Tuesday. This was a weekly gain of 926 contracts from the previous week which had a total of 95,240 net contracts.
This week’s current strength score (the trader positioning range over the past three years, measured from 0 to 100) shows the speculators are currently Bullish-Extreme with a score of 97.8 percent. The commercials are Bearish-Extreme with a score of 2.1 percent and the small traders (not shown in chart) are Bearish with a score of 32.4 percent.
Price Trend-Following Model: Strong Uptrend
Our weekly trend-following model classifies the current market price position as: Strong Uptrend. The current action for the model is considered to be: Hold – Maintain Long Position.
| MEXICAN PESO Statistics | SPECULATORS | COMMERCIALS | SMALL TRADERS |
| – Percent of Open Interest Longs: | 51.3 | 44.8 | 3.5 |
| – Percent of Open Interest Shorts: | 11.2 | 86.3 | 2.1 |
| – Net Position: | 96,166 | -99,493 | 3,327 |
| – Gross Longs: | 122,996 | 107,491 | 8,414 |
| – Gross Shorts: | 26,830 | 206,984 | 5,087 |
| – Long to Short Ratio: | 4.6 to 1 | 0.5 to 1 | 1.7 to 1 |
| NET POSITION TREND: | | | |
| – Strength Index Score (3 Year Range Pct): | 97.8 | 2.1 | 32.4 |
| – Strength Index Reading (3 Year Range): | Bullish-Extreme | Bearish-Extreme | Bearish |
| NET POSITION MOVEMENT INDEX: | | | |
| – 6-Week Change in Strength Index: | 11.1 | -9.8 | -10.8 |
Brazilian Real Futures:
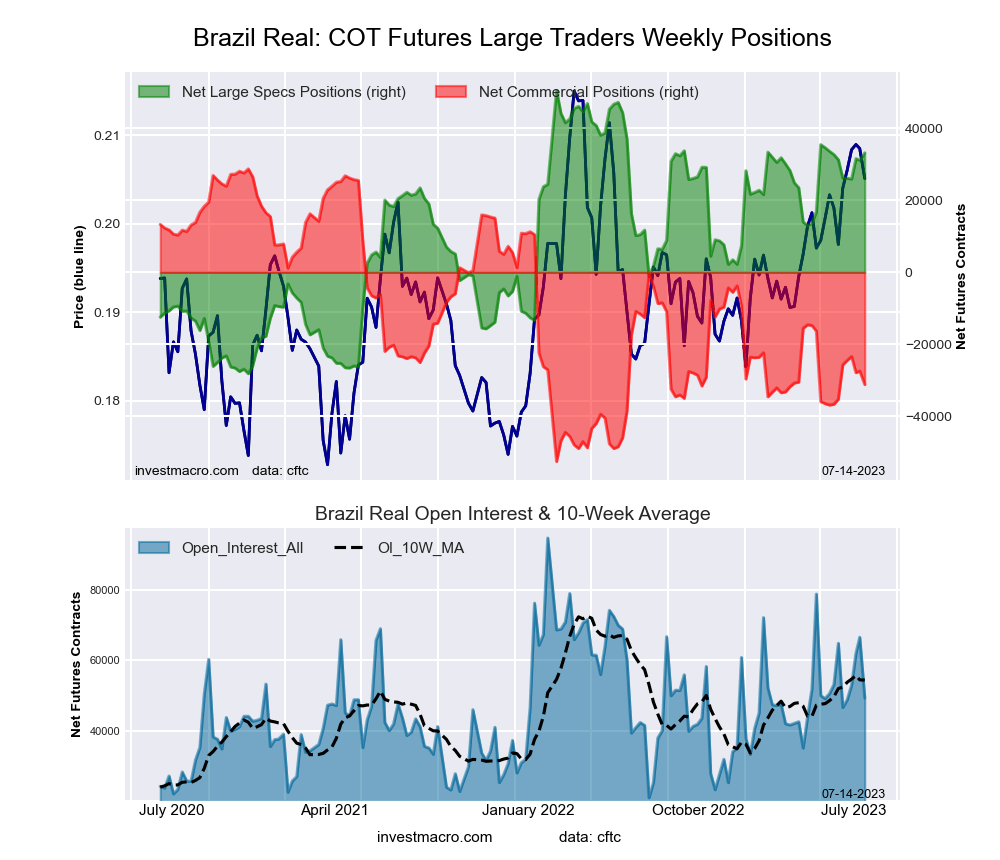 The Brazilian Real large speculator standing this week equaled a net position of 33,198 contracts in the data reported through Tuesday. This was a weekly gain of 2,094 contracts from the previous week which had a total of 31,104 net contracts.
This week’s current strength score (the trader positioning range over the past three years, measured from 0 to 100) shows the speculators are currently Bullish with a score of 78.0 percent. The commercials are Bearish with a score of 26.3 percent and the small traders (not shown in chart) are Bearish with a score of 28.0 percent.
Price Trend-Following Model: Uptrend
Our weekly trend-following model classifies the current market price position as: Uptrend. The current action for the model is considered to be: Hold – Maintain Long Position.
| BRAZIL REAL Statistics | SPECULATORS | COMMERCIALS | SMALL TRADERS |
| – Percent of Open Interest Longs: | 74.0 | 16.3 | 8.5 |
| – Percent of Open Interest Shorts: | 6.8 | 79.5 | 12.6 |
| – Net Position: | 33,198 | -31,193 | -2,005 |
| – Gross Longs: | 36,541 | 8,070 | 4,213 |
| – Gross Shorts: | 3,343 | 39,263 | 6,218 |
| – Long to Short Ratio: | 10.9 to 1 | 0.2 to 1 | 0.7 to 1 |
| NET POSITION TREND: | | | |
| – Strength Index Score (3 Year Range Pct): | 78.0 | 26.3 | 28.0 |
| – Strength Index Reading (3 Year Range): | Bullish | Bearish | Bearish |
| NET POSITION MOVEMENT INDEX: | | | |
| – 6-Week Change in Strength Index: | 2.4 | 5.0 | -47.7 |
Bitcoin Futures:
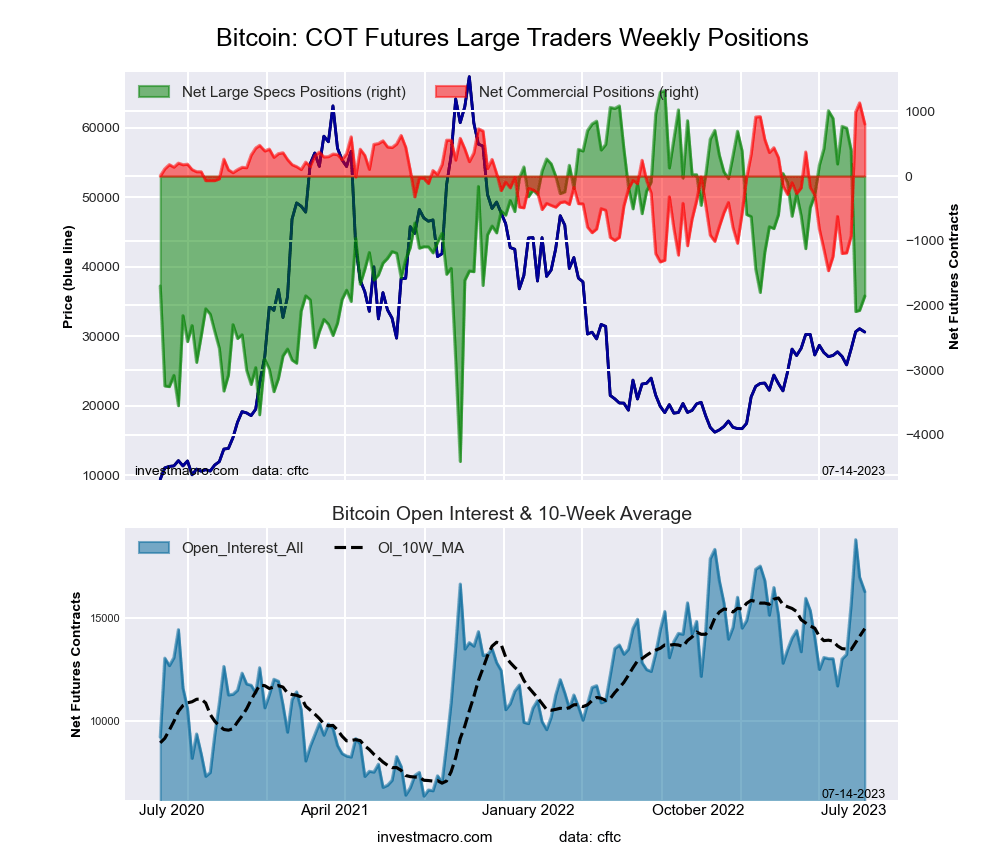 The Bitcoin large speculator standing this week equaled a net position of -1,855 contracts in the data reported through Tuesday. This was a weekly advance of 221 contracts from the previous week which had a total of -2,076 net contracts.
This week’s current strength score (the trader positioning range over the past three years, measured from 0 to 100) shows the speculators are currently Bearish with a score of 44.6 percent. The commercials are Bullish-Extreme with a score of 87.4 percent and the small traders (not shown in chart) are Bearish with a score of 36.8 percent.
Price Trend-Following Model: Strong Uptrend
Our weekly trend-following model classifies the current market price position as: Strong Uptrend. The current action for the model is considered to be: Hold – Maintain Long Position.
| BITCOIN Statistics | SPECULATORS | COMMERCIALS | SMALL TRADERS |
| – Percent of Open Interest Longs: | 75.6 | 8.2 | 9.4 |
| – Percent of Open Interest Shorts: | 87.0 | 3.3 | 3.0 |
| – Net Position: | -1,855 | 804 | 1,051 |
| – Gross Longs: | 12,322 | 1,343 | 1,535 |
| – Gross Shorts: | 14,177 | 539 | 484 |
| – Long to Short Ratio: | 0.9 to 1 | 2.5 to 1 | 3.2 to 1 |
| NET POSITION TREND: | | | |
| – Strength Index Score (3 Year Range Pct): | 44.6 | 87.4 | 36.8 |
| – Strength Index Reading (3 Year Range): | Bearish | Bullish-Extreme | Bearish |
| NET POSITION MOVEMENT INDEX: | | | |
| – 6-Week Change in Strength Index: | -35.6 | 55.0 | 14.0 |
Article By InvestMacro – Receive our weekly COT Newsletter
*COT Report: The COT data, released weekly to the public each Friday, is updated through the most recent Tuesday (data is 3 days old) and shows a quick view of how large speculators or non-commercials (for-profit traders) were positioned in the futures markets.
The CFTC categorizes trader positions according to commercial hedgers (traders who use futures contracts for hedging as part of the business), non-commercials (large traders who speculate to realize trading profits) and nonreportable traders (usually small traders/speculators) as well as their open interest (contracts open in the market at time of reporting). See CFTC criteria here.
All information and opinions on this website are for general informational purposes only and do not constitute investment advice.


